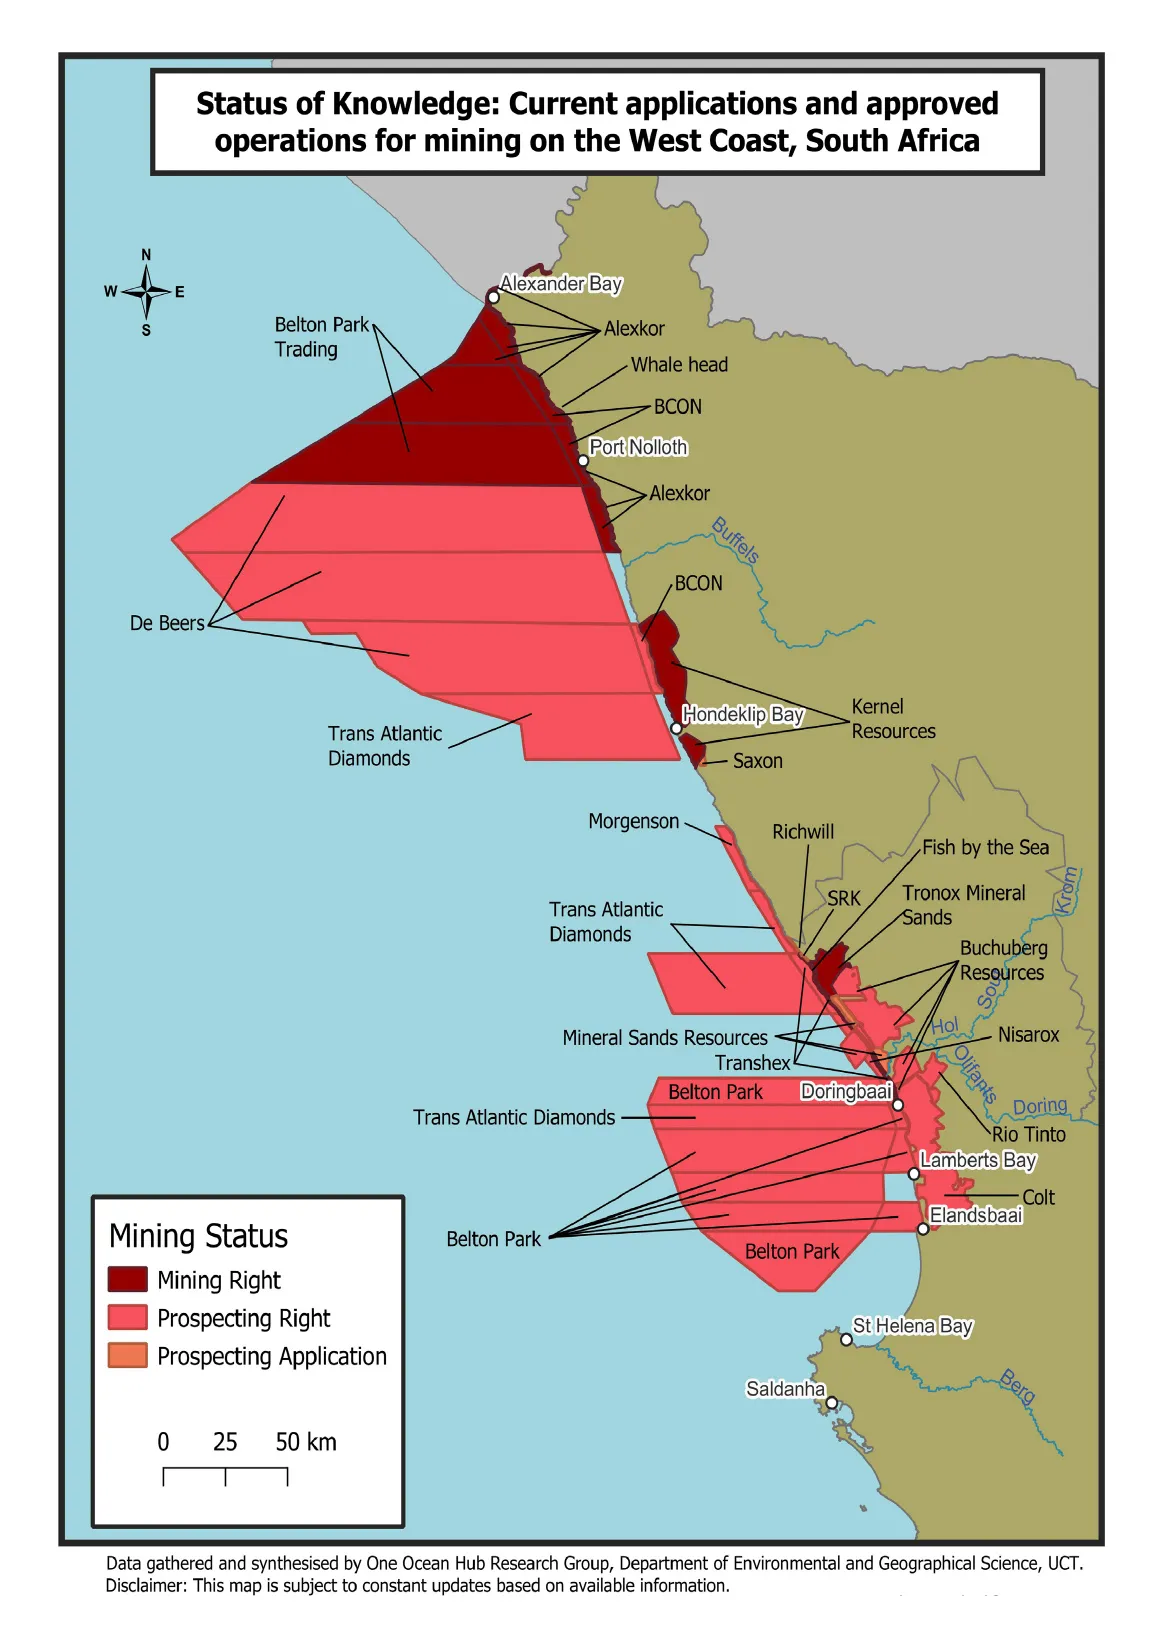
The Democratic Alliance (DA), South Africa’s opposition party, has governed the Western Cape province since 2009.
Ahead of national elections scheduled for 29 May 2024, party leader John Steenhuisen has admonished what he calls “mercenary parties” challenging the DA’s leadership in the Western Cape.
Rather than being “in opposition to the opposition”, Steenhuisen has argued, political parties such as the Patriotic Alliance, Good, and Rise Mzansi should focus their attention on other provinces. This is because the DA has a proven track record in the Western Cape, he and other party officials have claimed.
Is the party delivering on key issues such as unemployment, access to basic services and crime? In this report, we look into five claims the DA has made about its performance in the province.
Read more in Daily Maverick: 2024 elections hub
Claim: “Where we govern in the Western Cape, eight out of 10 people are employed …”
Verdict: Incorrect
The DA launched its election manifesto on 17 February. You can read our fact-check of that plan here.
In his keynote address at the launch in Pretoria, in the northern Gauteng province, Steenhuisen made several claims about the DA’s track record in the Western Cape.
On the topic of jobs, he said eight out of 10 people in the province were employed.
Statistics South Africa (Stats SA) records unemployment in its quarterly labour force surveys (QLFS). The most recent survey available when the DA published its manifesto was for the third quarter of 2023, from July to September. During those months, the unemployment rate in the Western Cape was 20.2%. In other words, about two in 10 people were considered unemployed.
However, this doesn’t mean that 80% of people were “employed”. Stats SA considers a person to be unemployed if they did not have a job at the time of the survey but were actively seeking work and were available to work, or were set to start a new job at a definite date in the future.
An expanded definition of unemployment includes people who are unemployed and want to work, but have a reason for not seeking work — for example, a lack of available jobs in their area.
The labour force refers to all those employed and unemployed. By the expanded definition, 25.6% of the labour force in the Western Cape was unemployed in the third quarter of 2023. However, this still does not include all people in the Western Cape.
For the proportion of the working-age population (all people aged 15 to 64) that is employed, the absorption rate is a better indicator. This is what Dr Neva Makgetla, a senior economist at the Trade and Industrial Policy Strategies research institute, previously told Africa Check. This indicator includes people aged 15 to 64 who did paid work for at least an hour or had a job or business during the week of the survey.
In the third quarter of 2023, the absorption rate in the Western Cape was 54.7%, higher than any other province, but not as high as the DA claimed. Gauteng had the second highest absorption rate (45%) and Limpopo third (38.5%).
Data for the fourth quarter of 2023 was not available when the DA published its manifesto. However, the figures did not change much. The official unemployment rate was recorded at 20.3%, while the expanded rate was 25.6%. The absorption rate was 55.0%.
Claim: “This province is responsible for 78.9% of all jobs in our country in the last five years.”
Verdict: Misleading
At the launch of the DA’s manifesto in the Western Cape, Premier Alan Winde claimed that the province was responsible for creating 78.9% of all jobs in South Africa over the past five years.
A reader asked us to look into the claim.
Kylie Hatton, special adviser to the premier, told Africa Check that the source of the claim was Stats SA’s QLFS, “which shows that 78.9% of net jobs were created in Western Cape” since the fourth quarter of 2019.
However, the QLFS does not use the term “net jobs” and Stats SA previously told Africa Check that it does not “have an official definition for this”.
The latest edition of the QLFS covers the fourth quarter of 2023 (the months of October to December). Winde spoke about “the last five years”, which should have started with the fourth quarter of 2018, but Winde used figures from the fourth quarter of 2019 instead.
The increase in employment in the Western Cape between the fourth quarter of 2019 and 2023 was around 239,000 people. Over the same period, employment in South Africa as a whole increased by around 303,000 people. In percentage terms, the Western Cape accounts for about 78.9% of this total. But statisticians don’t use this method to compare changes in employment, and for very good reasons.
‘Not totally wrong but misleading’
Dr Ihsaan Bassier, a researcher at the South African Labour and Development Research Unit and the London School of Economics, told Africa Check that the claim was “not totally wrong, but I would classify it as misleading”.
The first issue becomes apparent when using data from 2018, five years before 2023, not from 2019 onwards. Employment increases in the Western Cape over this period were 236,000 and for South Africa, 194,000.
By the DA’s calculations, this would mean that the Western Cape produced 121.5% of the net jobs in that time. But KwaZulu-Natal province also provided more than 100% “of all jobs” during this period.
“Some provinces increased employment, some provinces decreased employment, and so a particular province can in fact ‘over explain’ national net job creation, as in this case, with over 100%,” Bassier said.
Employment also experienced major shock in 2020 as a result of the Covid pandemic. “In historical terms, the period since 2020 has been anomalous,” Bassier said. The net number of jobs created over the past five years finally turned positive in 2023 but was still very small.
Bassier calculated that for the period 2021 to 2023, which would be less affected by the pandemic, Gauteng had the highest percentage of “net national employment growth” at 23.4%, followed by the Western Cape at 22.7%.
Stats SA does not use the measure
Desiree Manamela, chief director for labour statistics at Stats SA told Africa Check that the data agency “does not use this measure used by the DA to assume that the Western Cape was responsible for 78.9% of all jobs in the country in the last five years and does not use the measure ‘% of net jobs’.”
So what can other measures tell us about the Western Cape’s employment statistics?
Between the fourth quarters of 2018 and 2023, the Western Cape did see the largest increase in employment of any province, with just over 236,000 more people employed in 2023 than in 2018. KwaZulu-Natal was a close second, with an increase of just over 208,000 people. Four provinces (Eastern Cape, Free State, North West and Gauteng) saw a decline in employment over that period.
Over the four years used by Winde, five provinces experienced a decrease in employment, with the Western Cape again recording the largest increase at 239,000 people. KwaZulu-Natal was again second with 192,000. There are, however, other ways of looking at the contribution to employment.
For example, Manamela highlighted how each province’s employment figures had changed as a percentage of people already employed in the province. This makes comparisons between provinces more intuitive, as, for example, a province that doubled its employment figures would show an employment increase of 100%, whether that meant an increase from 100 people to 200 or from 1 million to 2 million people. This means that large provinces do not dominate employment figures simply by having large populations.
From the fourth quarter of 2019 to 2023, employment in the Western Cape increased by 9.5% of its initial value. This was the highest increase of any province, followed by KwaZulu-Natal at 7.2% and Limpopo at 7%.
So the Western Cape is doing well in terms of employment, but Winde used a misleading measure to communicate this.
Claim: “Where we govern, in places like Cape Town … [we provide] the cleanest drinking water …”
Verdict: Incorrect
During the manifesto launch, Steenhuisen narrowed in on the City of Cape Town, claiming that the DA provided the cleanest drinking water there.
The 2022 general household survey (GHS), the latest available, shows that 99.3% of households in the Western Cape had access to piped or tap water. The quality of this water is another matter.
South Africa’s Department of Water and Sanitation (DWS) defines water quality in terms of its “microbiological, physical, and chemical properties”.
This information is made publicly available on the National Integrated Water Information System (Niwis), an interactive dashboard maintained by the department. The latest Niwis results at the time of publishing are for samples tested between 1 March 2023 and 1 February 2024.
Prof Craig Sheridan is the director of the Centre in Water Research and Development at the University of the Witwatersrand in Johannesburg. He told Africa Check that a water quality index helped determine how good the water was in a given place because it considered the chemical and microbiological aspects of the water. “The best score on a [water quality index] would be the best water,” Sheridan said.
The Niwis measures the quality of drinking water according to six chemical and microbiological categories and provides a rating of bad, poor, good or excellent.
Neil Griffin, a research officer at Rhodes University’s Institute for Water Research in Makhanda, told Africa Check that the index was based on the South African National Standard Drinking Water Specification (Sans 241). It sets out the minimum standards for water that is safe to consume. While there were other standards, Griffin said, Sans 241 was “probably the best”.
The results of the Niwis dashboard showed that Cape Town’s water was rated as excellent in four categories, poor in one and bad in another. Water in the City of Tshwane in Gauteng, which is also governed by the DA, was rated as good in two categories, poor in two others and bad in the remaining two.
On the other hand, water in the ANC-run City of Johannesburg was rated as excellent in five categories and bad in one. Water in the eThekwini municipality, also led by the ANC, was rated excellent in four categories, good in one and bad in another.
Based on the samples tested, the City of Cape Town therefore does not have the cleanest drinking water.
Asked about Cape Town’s poor result for the “chemical: disinfectant” category, Griffin said this indicated that the city’s water had higher residual chlorine levels than Johannesburg between 1 March 2023 and 1 February 2024.
Claim: “… and the best sanitation services in the entire country.”
Verdict: Unproven
South Africa’s national treasury defines basic sanitation services as providing households with easily accessible and sustainable facilities. These are often referred to as “improved sanitation” — flush toilets connected to a public sewerage system or a septic tank, or a pit toilet with ventilation pipes (also known as a VIP toilet).
Outdated facilities that do not fall into this category include pit toilets, chemical toilets (which collect human waste in a tank and use chemicals to minimise odour) and pit latrines.
According to the 2022 GHS, the Western Cape had the highest number of households using improved sanitation, at 95.7%. This was followed by Gauteng (87.3%) and the Free State (78.7%). The Western Cape also had the lowest number of households using pit toilets (0.2%), followed by Gauteng (6%).
However, the numbers look different at the local government level — particularly in metropolitan municipalities, known as metros.
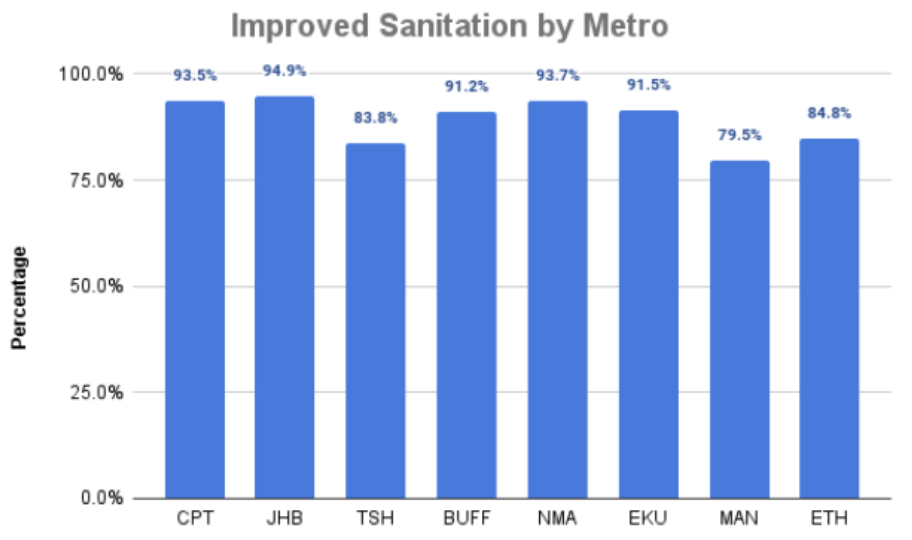
(Data source: Stats SA, 2022)
Using the total number of sanitation facilities per metro from Stats SA’s 2022 census, the City of Johannesburg (94.9%) had the highest number of individuals that made use of improved sanitation, followed by Nelson Mandela Bay (93.7%) and the City of Cape Town (93.5%).
However, in terms of households, the 2022 general household survey showed that the ANC-governed Buffalo City (97.8%) had the highest number of improved sanitation facilities out of all the metros. The DA-governed Tshwane ranked second to last in terms of access to improved sanitation.
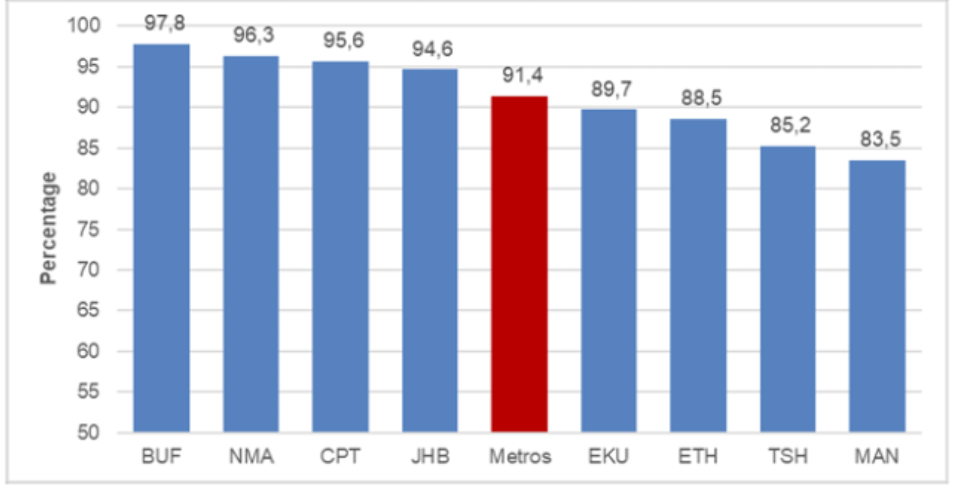
(Source: Stats SA, 2022 general household survey)
The difference in these figures is due to the distinction between a census and a survey. While the census aims to collect data from every person in South Africa, a survey collects data from a sample of the population.
Performance should reflect changes over time
Given the different data sets available, we asked Mike Muller, former director-general of South Africa’s water affairs department and adjunct professor at Wits University’s Graduate School of Governance, to weigh in.
“Without seeing the exact statements made, it’s difficult to respond,” he said. “Improved sanitation” was a very wide definition and the type and status of sanitation adopted by a household depended on the type of housing and settlement as well as household incomes.
In addition, Muller said, “‘performance’ cannot be measured by a single data point but must reflect changes made over a given period”. He said the 2022 GHS provided some useful insights into the performance of the different provinces over the past two decades.
It showed that at the national level, access to improved sanitation rose from 61.7% in 2002 to 83.2% in 2022.
“The best ‘performing’ province was the Eastern Cape where access rose from 33.4% to 90%. Limpopo also improved significantly, from 26.9% to 63.1%,” Muller said.
While most urban provinces showed limited progress, they started from a high coverage base and experienced high levels of in-migration, Muller added.
For example, access to improved sanitation in the Western Cape increased from 92.2% in 2002 to 95.9% in 2022. In Gauteng, the figures were 88.9% and 90.5%.
According to Muller, this meant that “poor rural provinces” had seen the most improvement.
“The two developed urban provinces started with high levels of coverage which improved slightly in percentage terms over the two decades. However, to compare their ‘performance’ it would be necessary to consider the number of households served since areas with high in-migration or more households to serve have to do more simply to stay in the same place.”
What looks like a slow rate of increase in percentage terms may be masking a significant rate of increase in terms of the number of households with appropriate access.
We have therefore rated this claim unproven. That is, publicly available evidence neither proves nor disproves the claim.
Claim: “The only province in South Africa where the murder rate is plateauing or coming down is in [the Western Cape].”
Verdict: Incorrect
Launching the DA’s manifesto in the Western Cape, Premier Alan Winde claimed that his province was the only one to see a drop or stagnation in the murder rate.
The Western Cape has long been associated with high murder rates. In April 2024, news media reported that 94 people had been murdered over just three days.
The province’s murders are largely concentrated in townships on the outskirts of the city of Cape Town and in areas characterised by economic exclusion, lack of access to basic services and gang activity.
Historically, the high murder rates in the Western Cape have been attributed to a number of factors, including the proliferation of gangs, the related issue of illegal firearms, and a weakened criminal justice system.
The Institute for Security Studies (ISS) in Pretoria uses police data to calculate annual murder rates for South Africa. These take the total population into account by looking at the number of murders in a given time and place per 100,000 people. At 56, the rate in the Western Cape was higher than the national average of 45 in 2022/23.
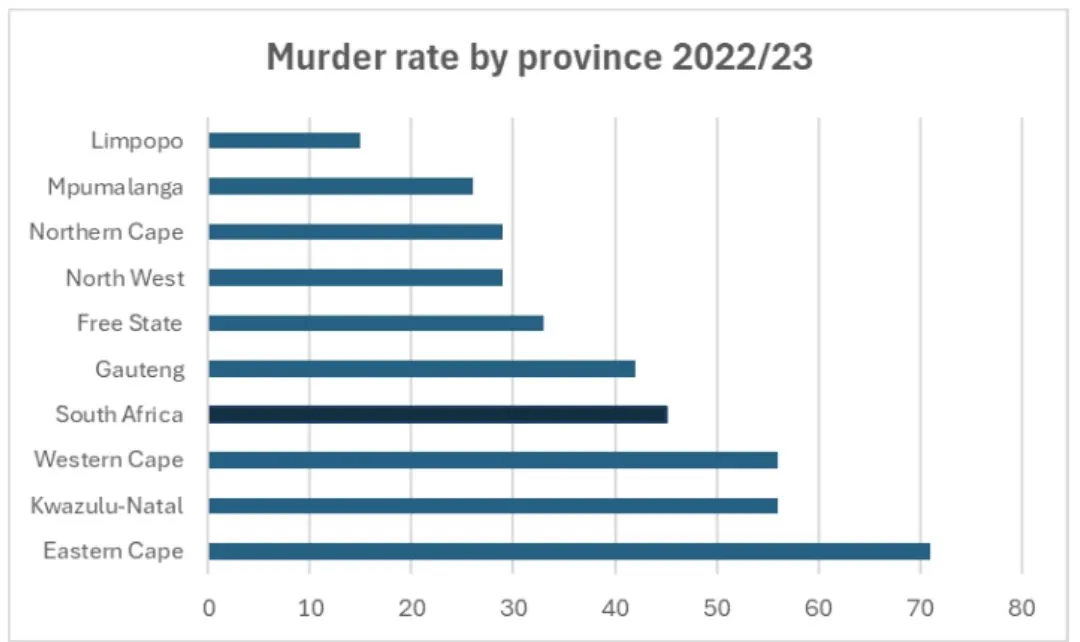
(Source: Policy brief: Murder trends in South Africa’s deadliest provinces)
Winde told Africa Check that his claim was based on a policy brief published by the ISS. It analysed trends in murder rates at a provincial level and found the Western Cape’s murder rate had fallen by 1.4 in the five years between 2017/18 and 2022/23.
Zoom out, and the picture is less hopeful. The policy brief also compares current murder rates with those of 2011/12. Here the Western Cape increased from 43 in 2011/12 to 56 in 2022/23. The national rate also increased from 31 to 45 over the same period.
Recent murder declines and the Leap initiative
As the policy brief points out, the increase in the Western Cape was between 2011/12 and 2017/18.
In recent years the province has introduced initiatives aimed at curbing the crime epidemic, such as the Law Enforcement Advancement Plan (Leap). Created in 2020, Leap focused law enforcement resources in murder hotspots. Murder rates started to decline around this time.
Africa Check spoke to David Bruce, security researcher and author of the policy brief, to learn more. He said that statistics since 2019 did suggest that initiatives like Leap might have had “a positive impact” on murder rates in the province.
Other researchers have written about the likely link between Leap and reductions in the murder rate. In a 2022 article, Dr Jean Redpath, senior researcher at the Dullah Omar Institute at the University of the Western Cape, wrote: “The Leap intervention, involving multilevel government co-operation, provides hope that it may be possible to make a dent in SA’s crime problem.”
Bruce added that the Western Cape did not show the same pattern of increasing murder rates over this period as seen in other provinces known to have high murder rates.
For example, while the murder rate decreased slightly in the Western Cape, Gauteng, the Eastern Cape and KwaZulu-Natal have all seen significant increases in the last five years.
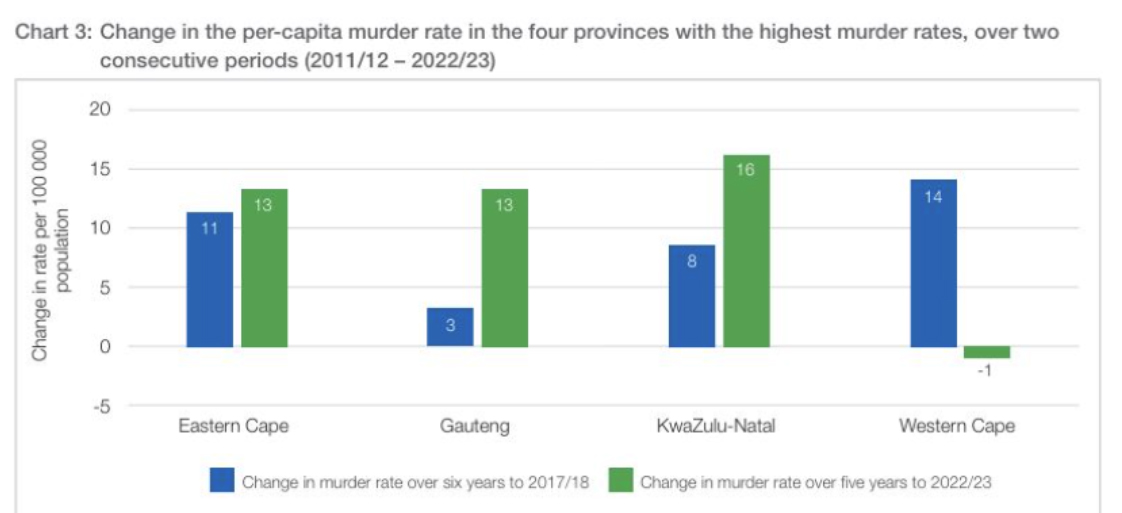
(Source: Policy brief: Murder trends in South Africa’s deadliest provinces)
The ‘only’ province to see a decrease?
Winde claimed that the Western Cape was the only province in South Africa to see a decrease or plateau in murder rates. But when comparing rates between 2011/12 and 2022/23 data, the Free State observed a slight decline of 2% and the Northern Cape a decline of 4%. While the decline in the Northern Cape was concentrated between 2011/12 and 2017/18, the decline in the Free State took place between 2017/18 and 2022/23. Limpopo’s murder rate declined by 0.4% between 2017/18 and 2022/23.
This means the Western Cape is not the only province to see a plateau or a decrease.
Latest data a ‘curve ball’
More recent statistics further challenge Winde’s claim. Bruce told Africa Check that the last three quarterly crime reports from the South African Police Service (SAPS) show the province’s murder rate has increased slightly, “by about 5%”.
From April to December 2023, SAPS recorded 3,404 murders (adding quarters one, two and three). In the same period of the previous year, there were 3,242 murders.
As we have written before, experts prefer to use the more finalised annual data, when available, rather than quarterly reports. But for murder, according to Bruce, the difference in these numbers is “usually less than 1%”.
The data from the last three quarterly reports presents a “curve ball”, Bruce said. While the Western Cape’s murder rate had been in decline, this is no longer the case.
With fourth-quarter results due to be released in May 2024, it remains to be seen whether the province has started to buck the trend again. DM
This report is produced as part of the work of a South African election coalition. In the run-up to the 2024 national elections, the coalition aims to ensure that the claims made by those in charge of state resources and delivering essential services are factually accurate. As voters head to the polls, it is increasingly important that they are able to make informed decisions.
First published by Africa Check.


 Share
Share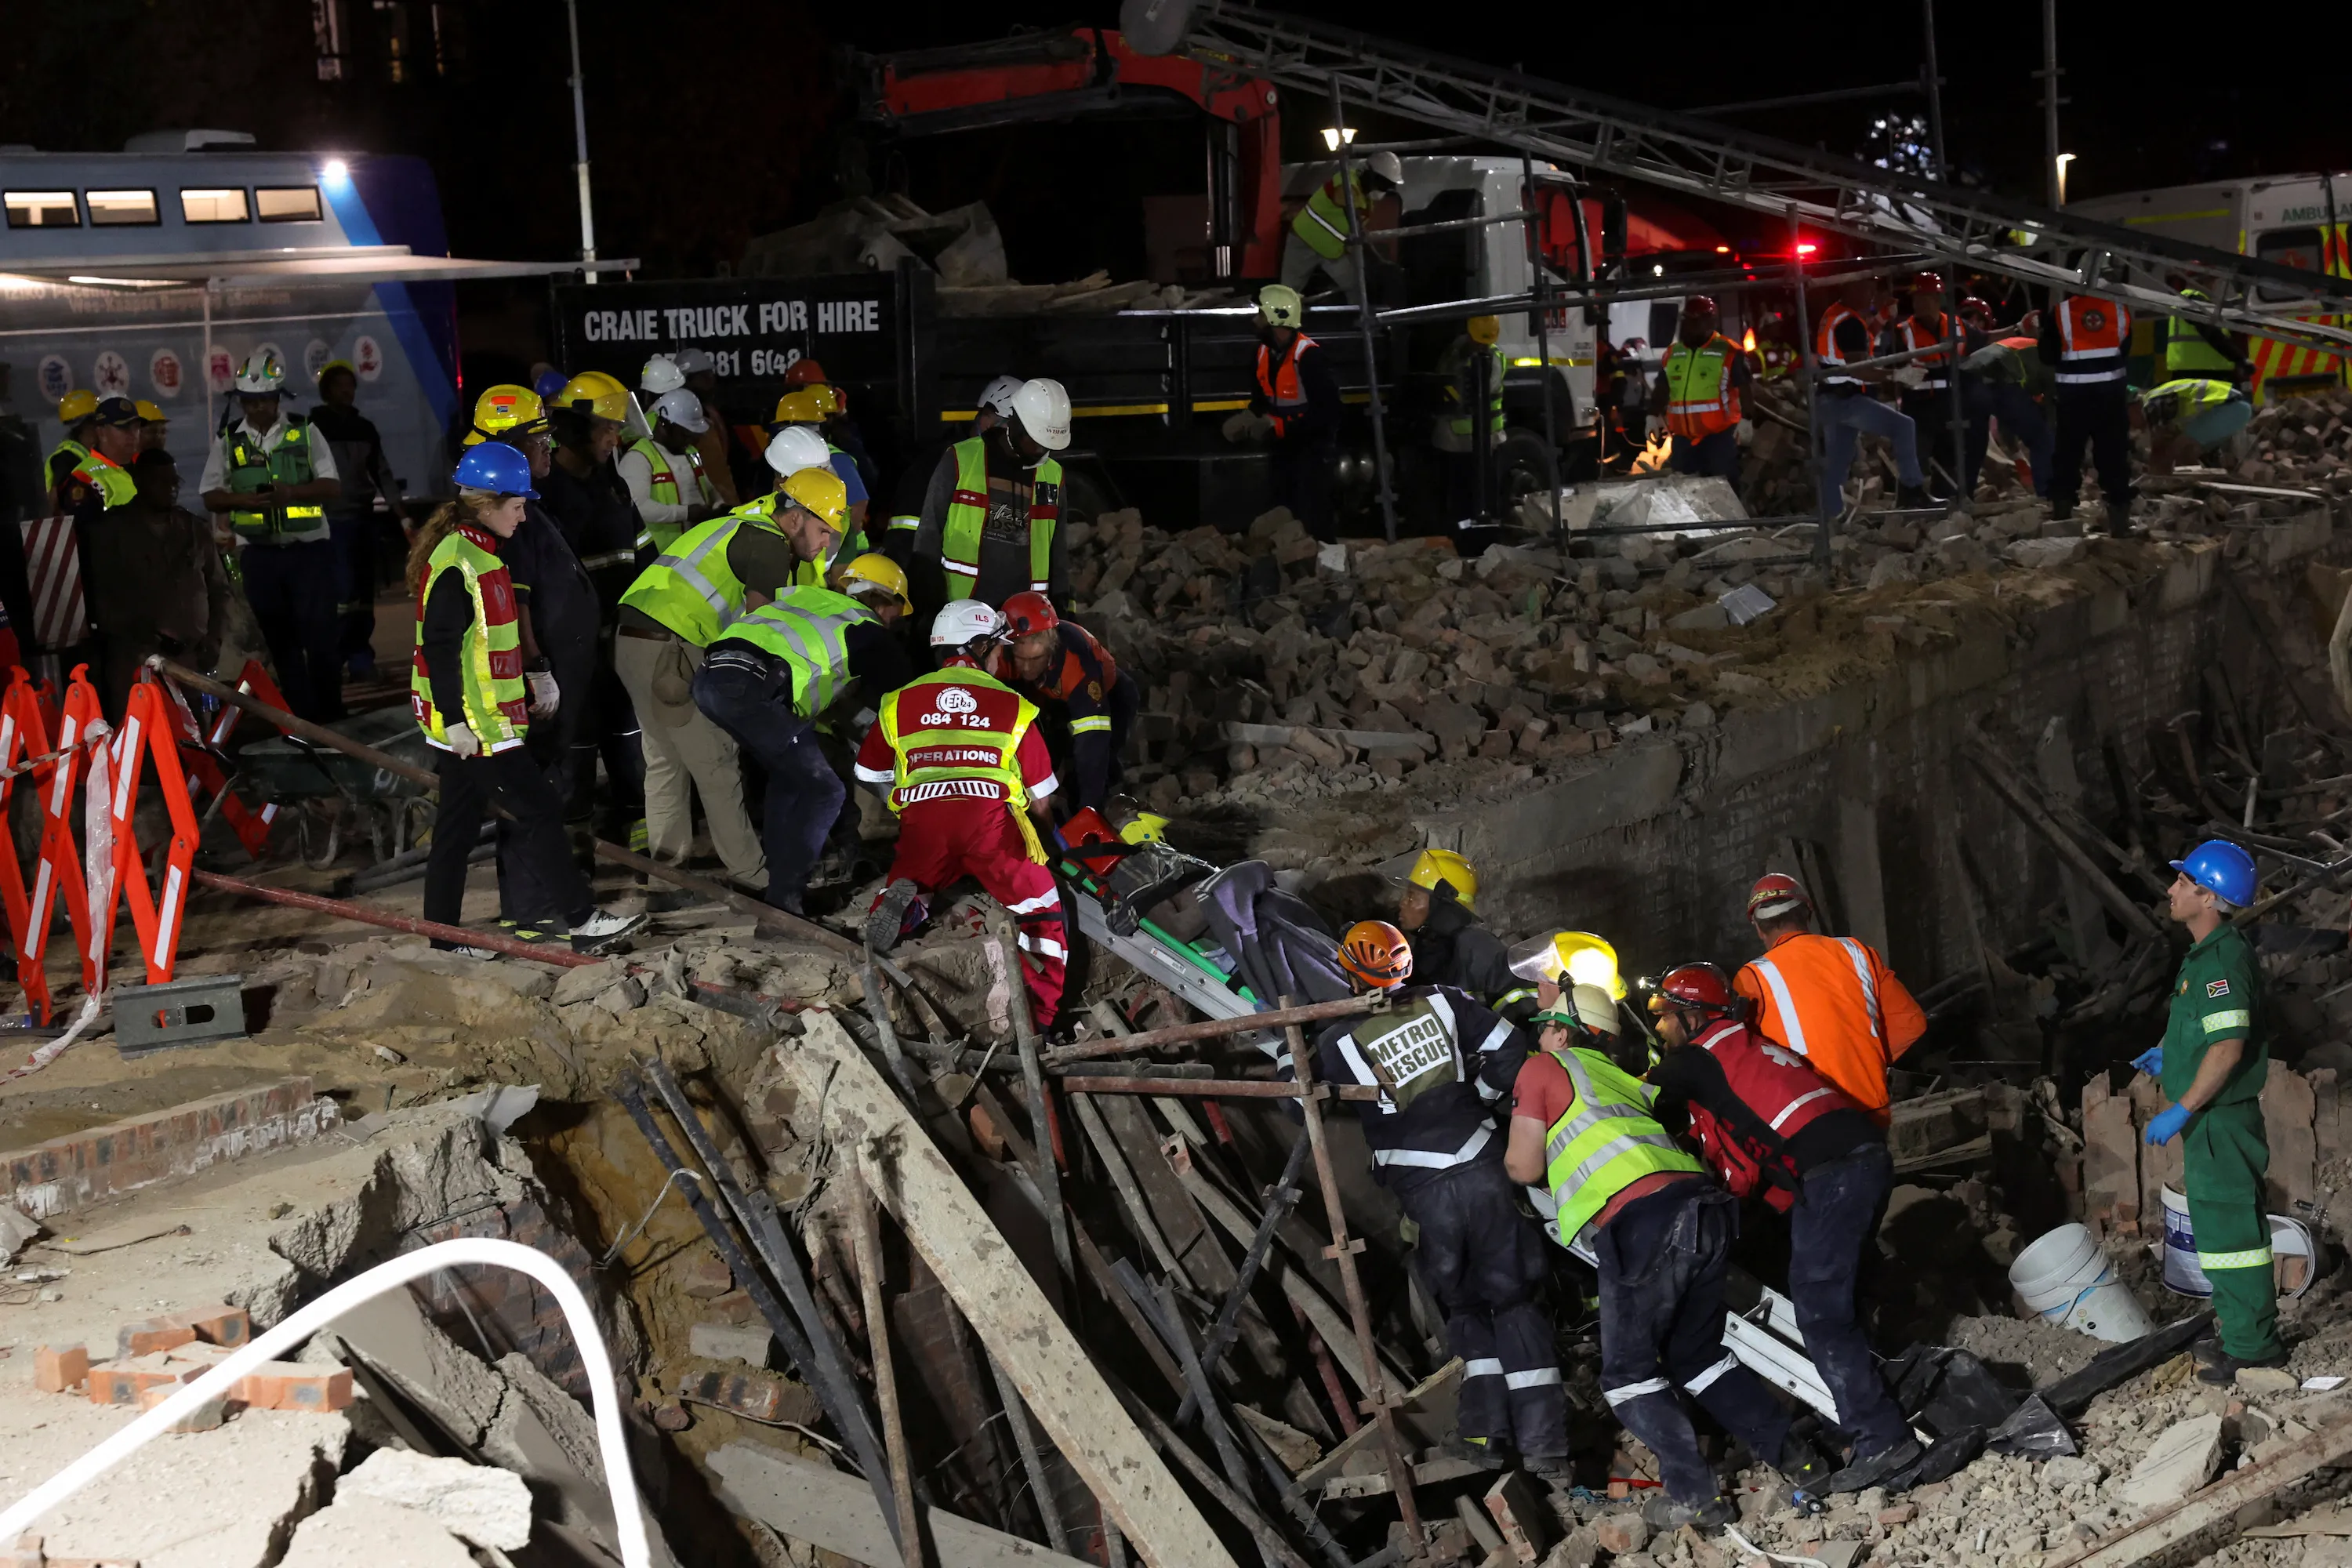


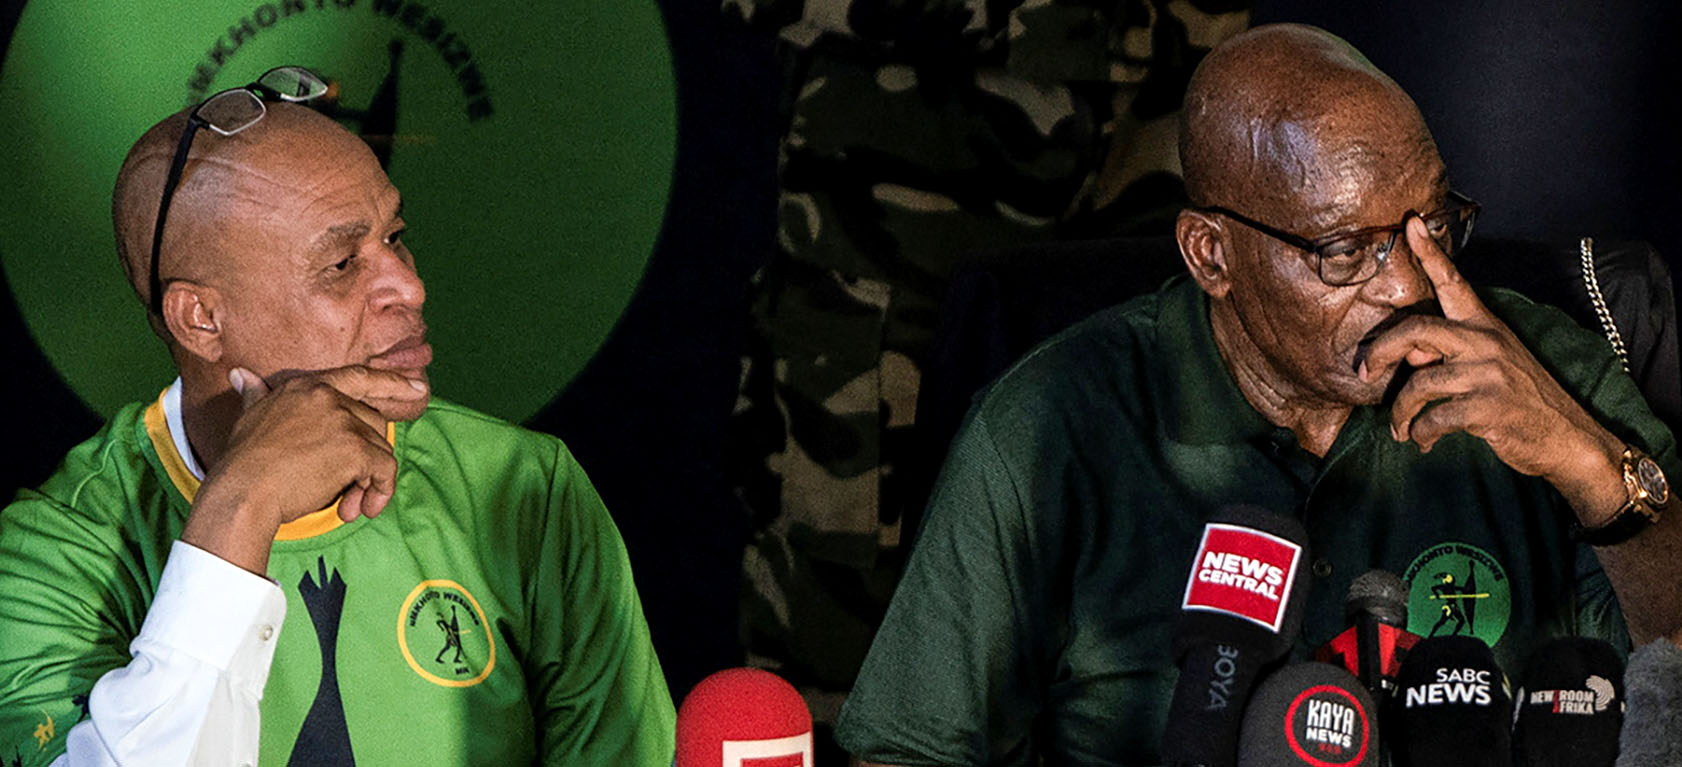 Former president Jacob Zuma, flanked by Jabulani Khumalo, speaks about his political future at a press conference in Orlando East, Soweto, on 16 December 2023. (Photo: Reuters /Shiraaz Mohamed)
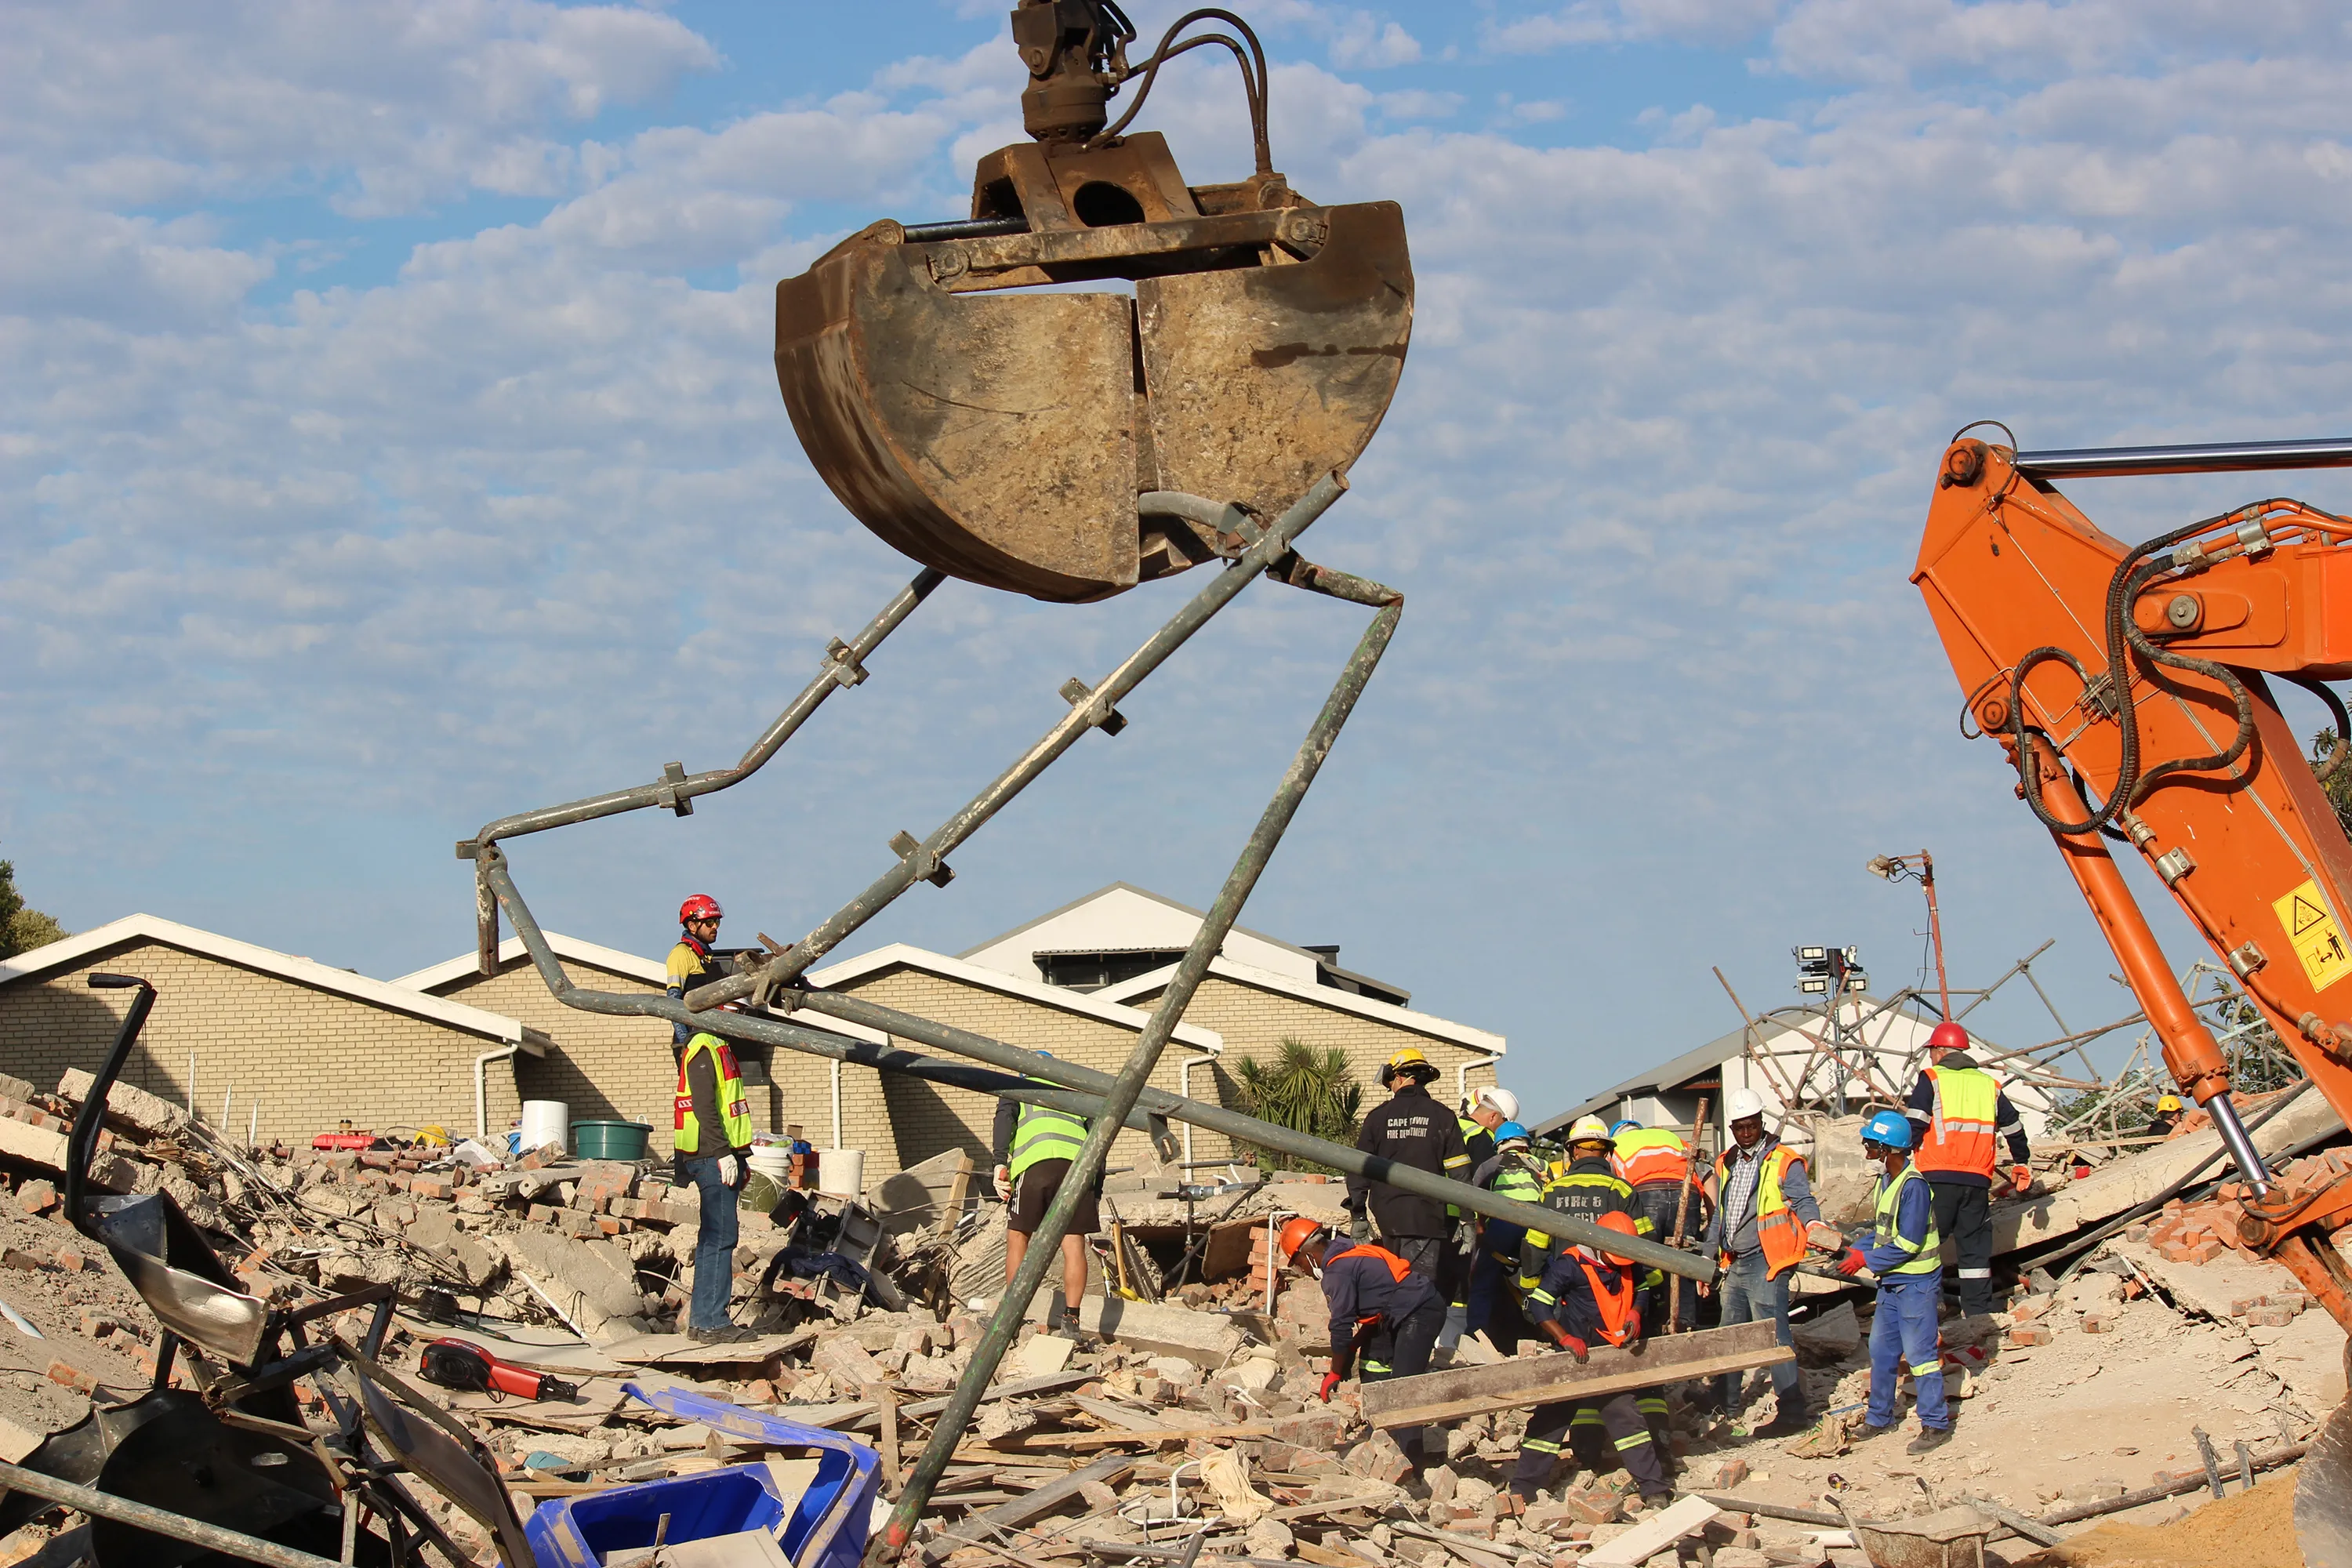
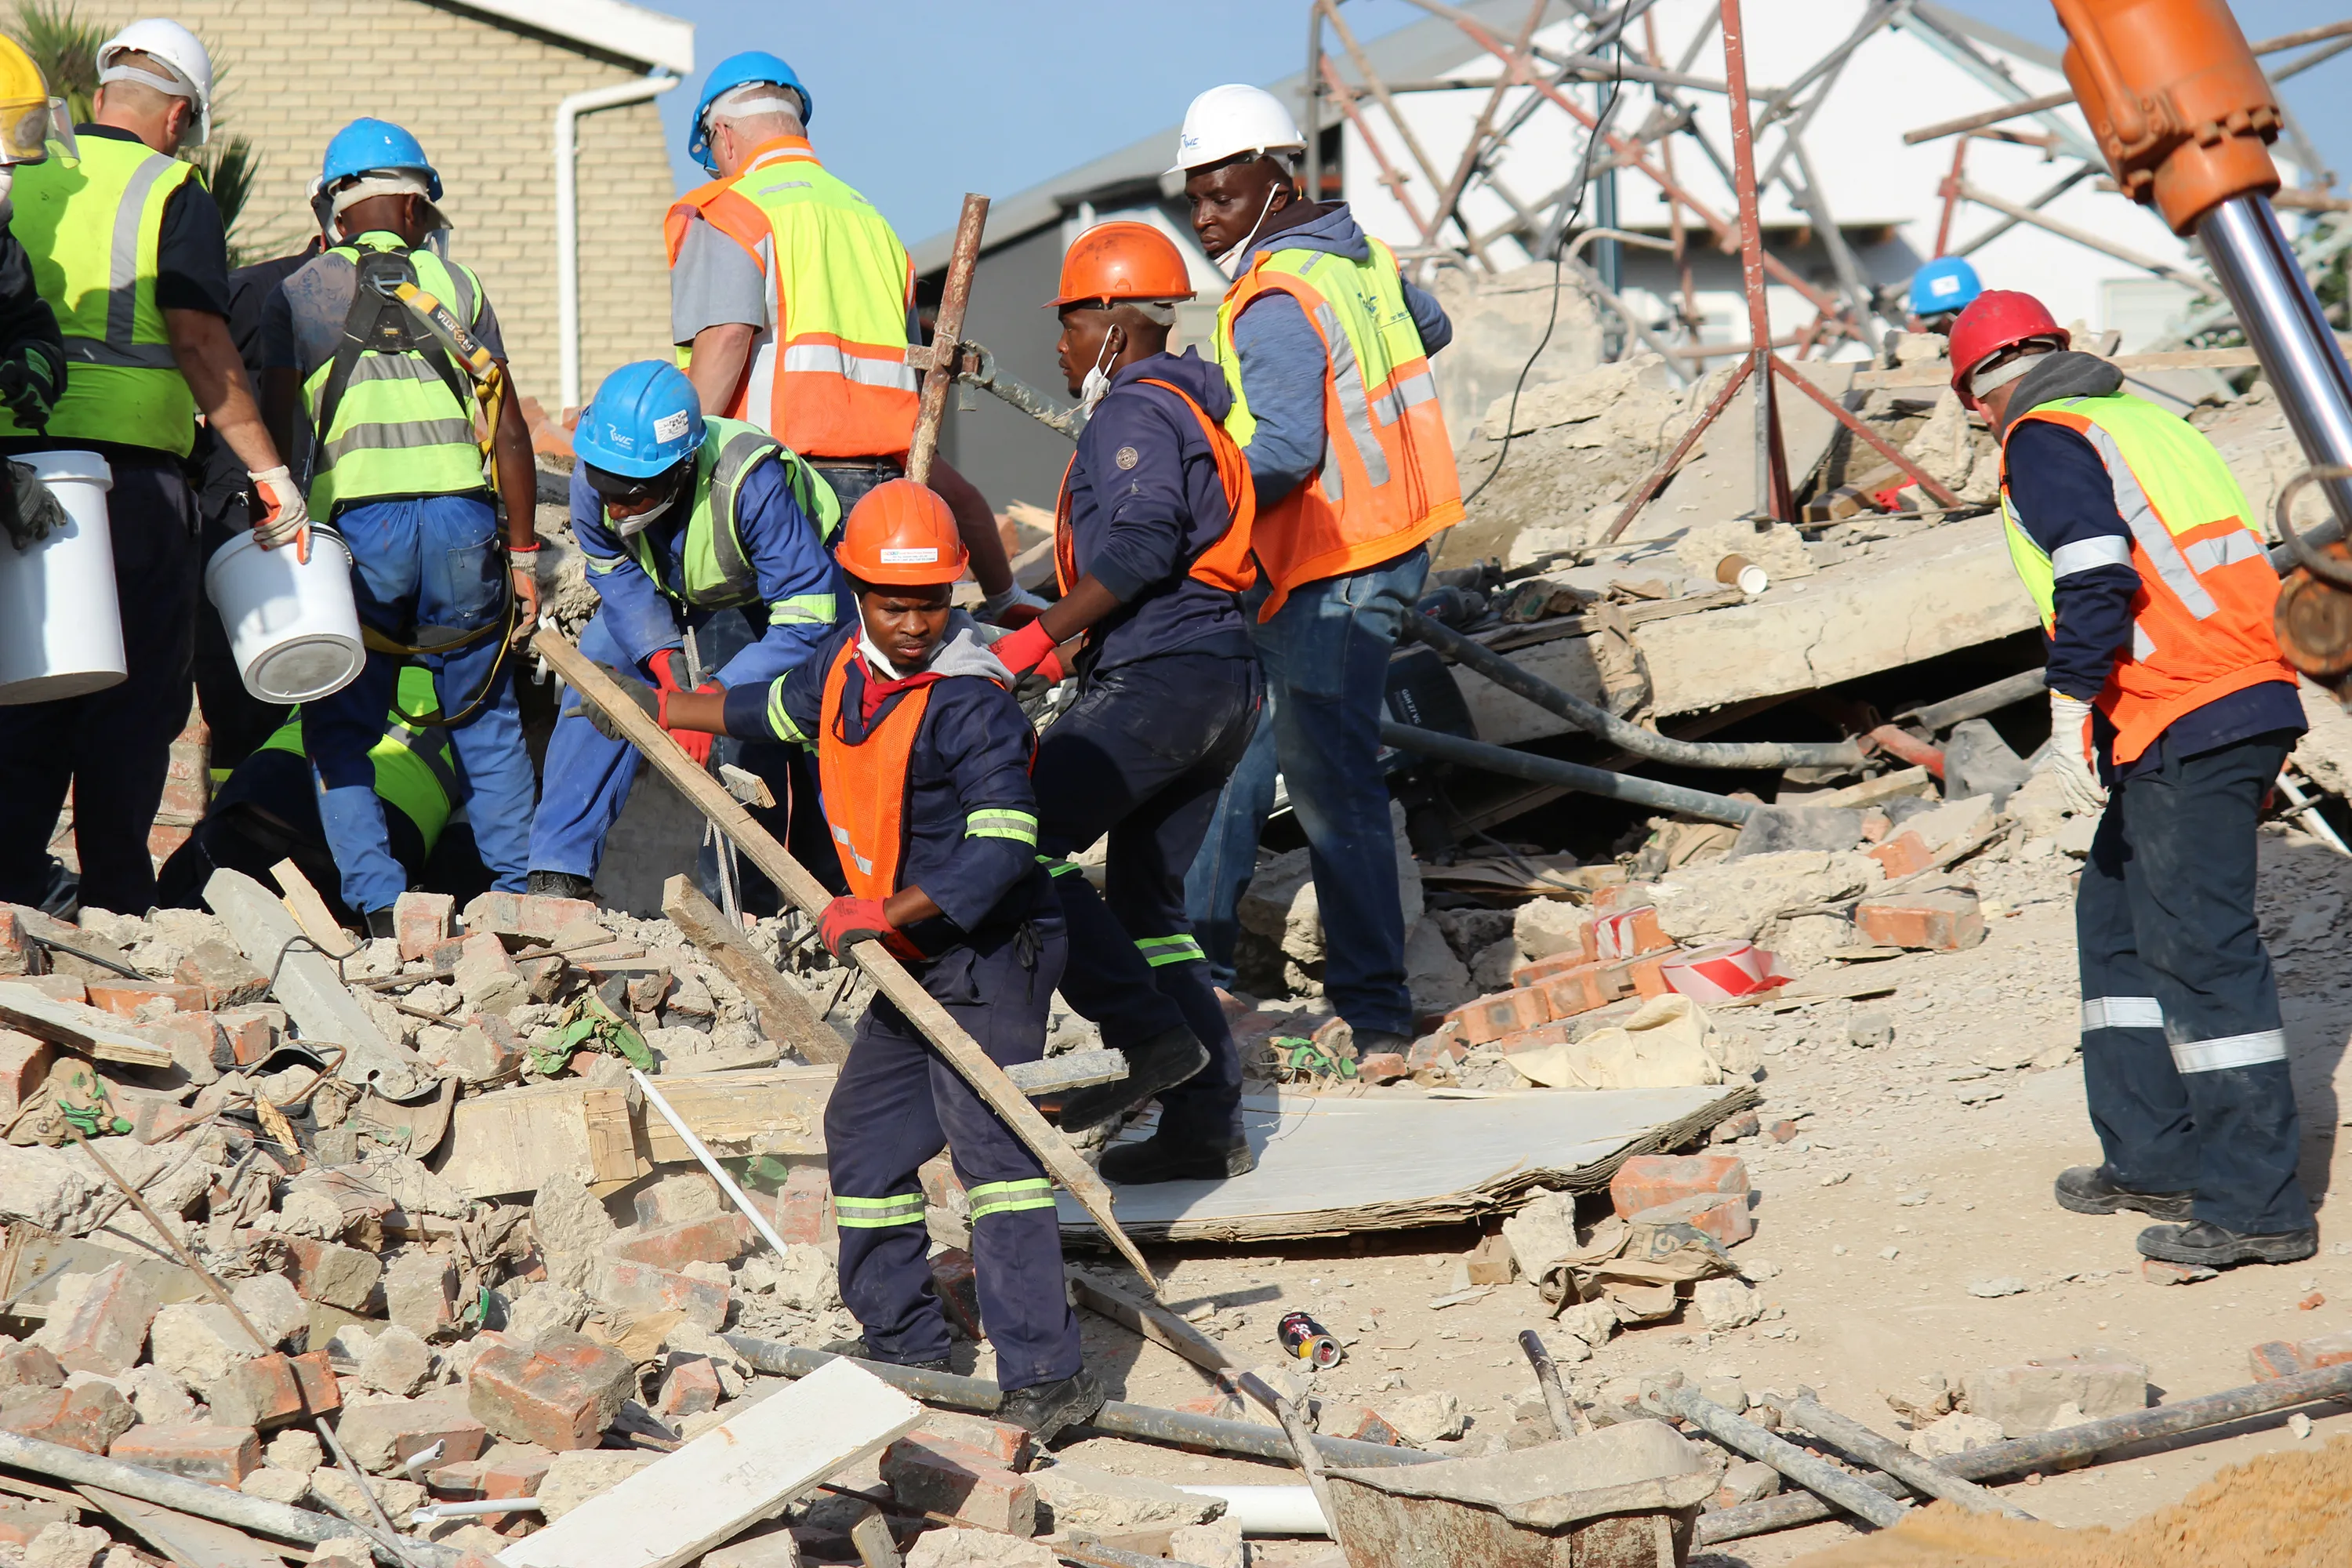
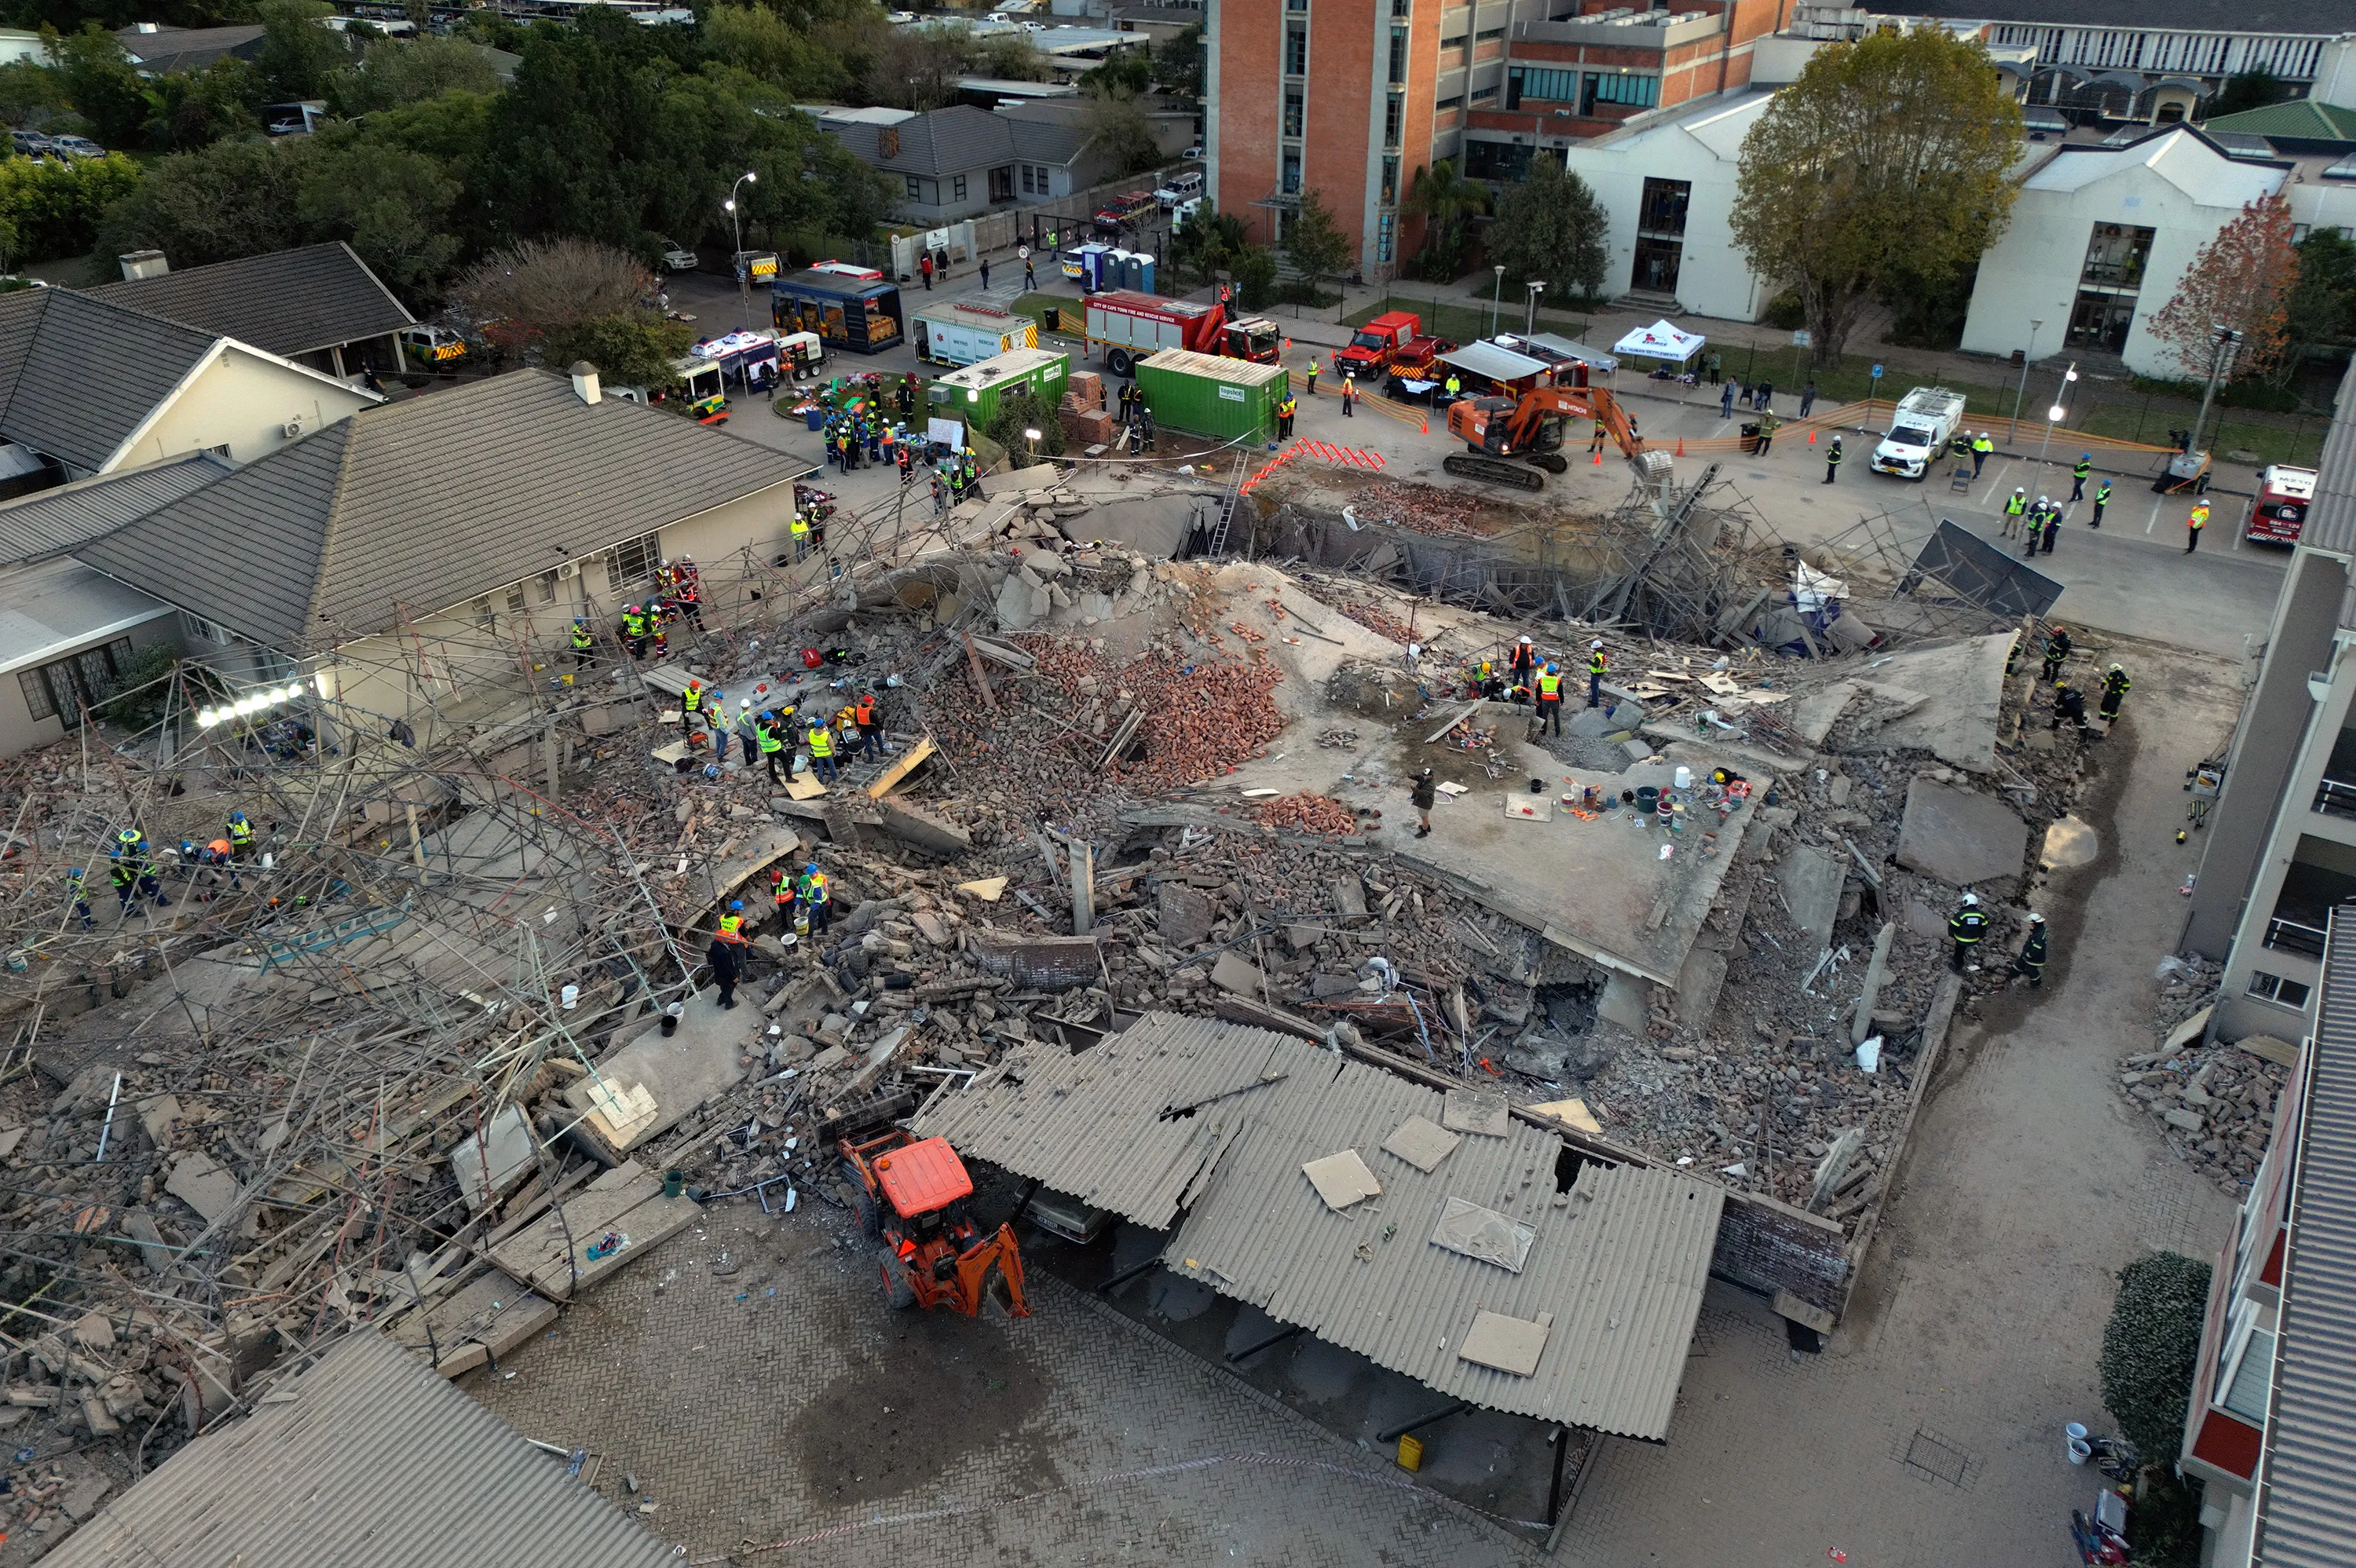
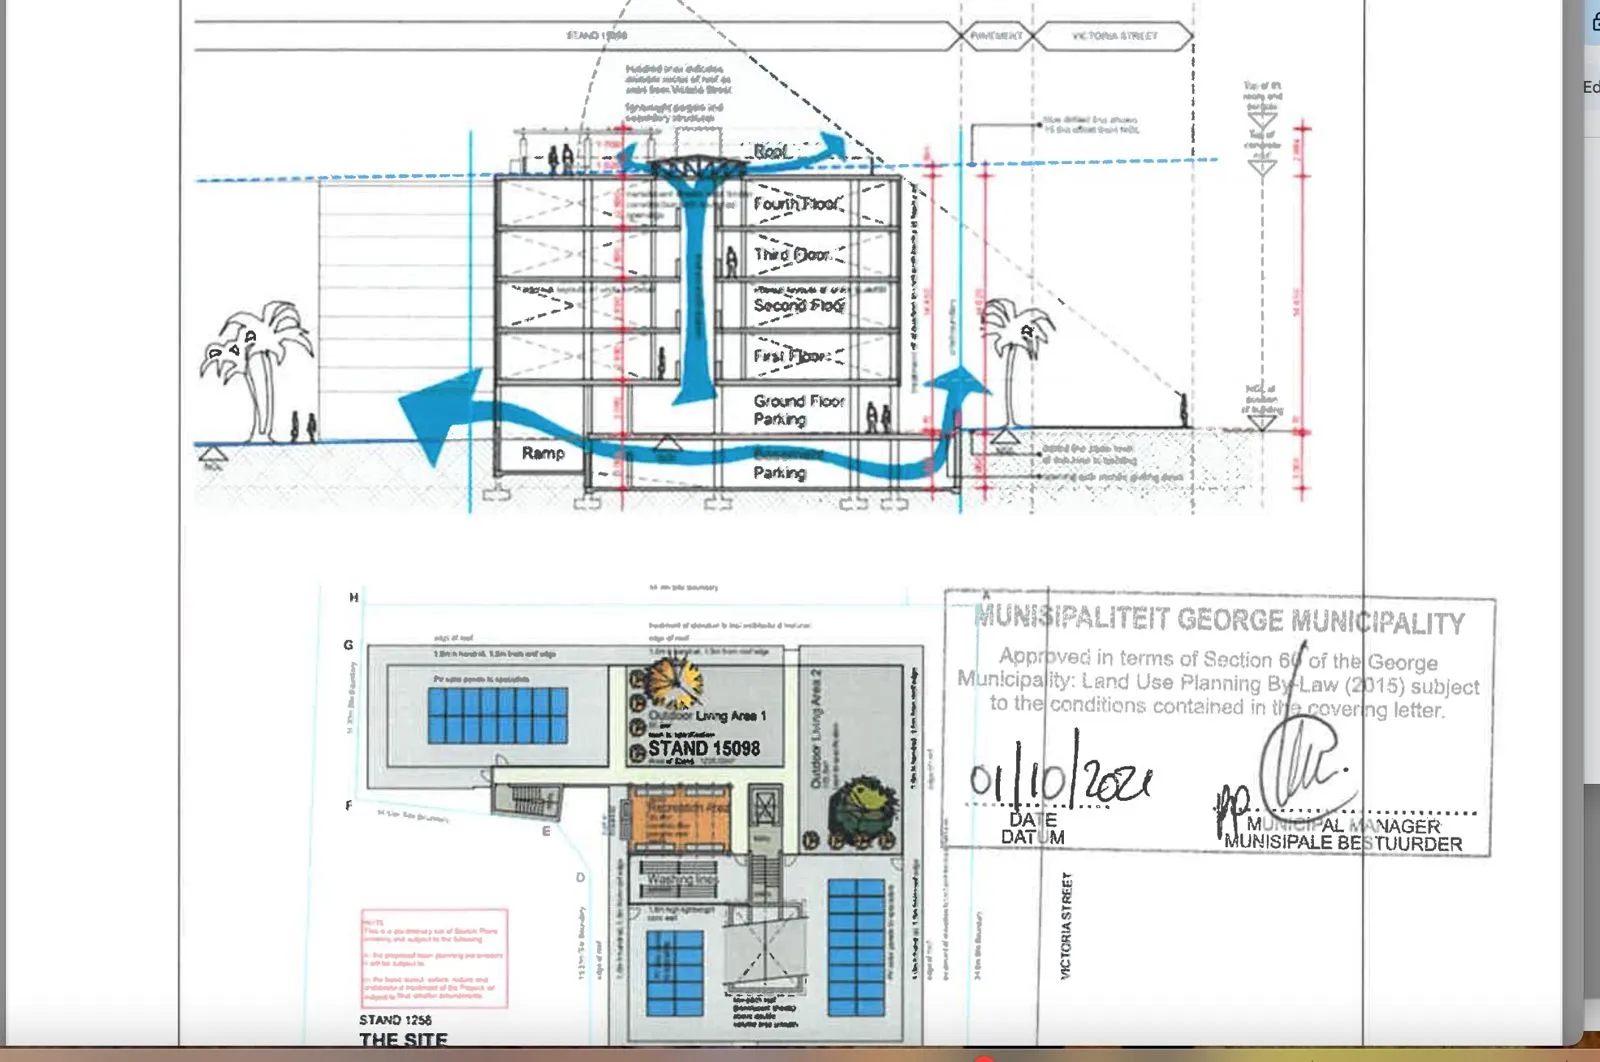
If the building was only designed to be a three storey building and this design was not amended to withstand the load of a 5 storey building – your article does not say whether this was or was not done – then it is not surprising that it collapsed. The first thing the engineers appointed need to do, is check the design. This should take weeks, not months. If the design is correct, then the next possibility could be “did the building contractor adhered to the design and material standards or did they take short cuts”? Was the correct strength of concrete used and was sufficient reinforcing used? The engineers appointed to oversee the construction should be able to answer this question very quickly. It’s not rocket science. It is basic civil engineering practice.
The article is well written but actually says very little. In essence, the article describes every element of a standard municipal application and approval process (within a well-run municipal department). It does not add anything of value regarding the potential reasons for the accident, which is good because any comment would be pure speculation.
Comments to this article guessing about fifth floors, etc. is therefore disingenuous and unfair. When plans are amended, the municipality will still scrutinize the plans before approval. That will include the signing off of any structural designs by a professional engineer.
In short, only the investigation by the professional team will conclude whether there was a design problem or a construction error. Until then there is nothing to add or speculate.
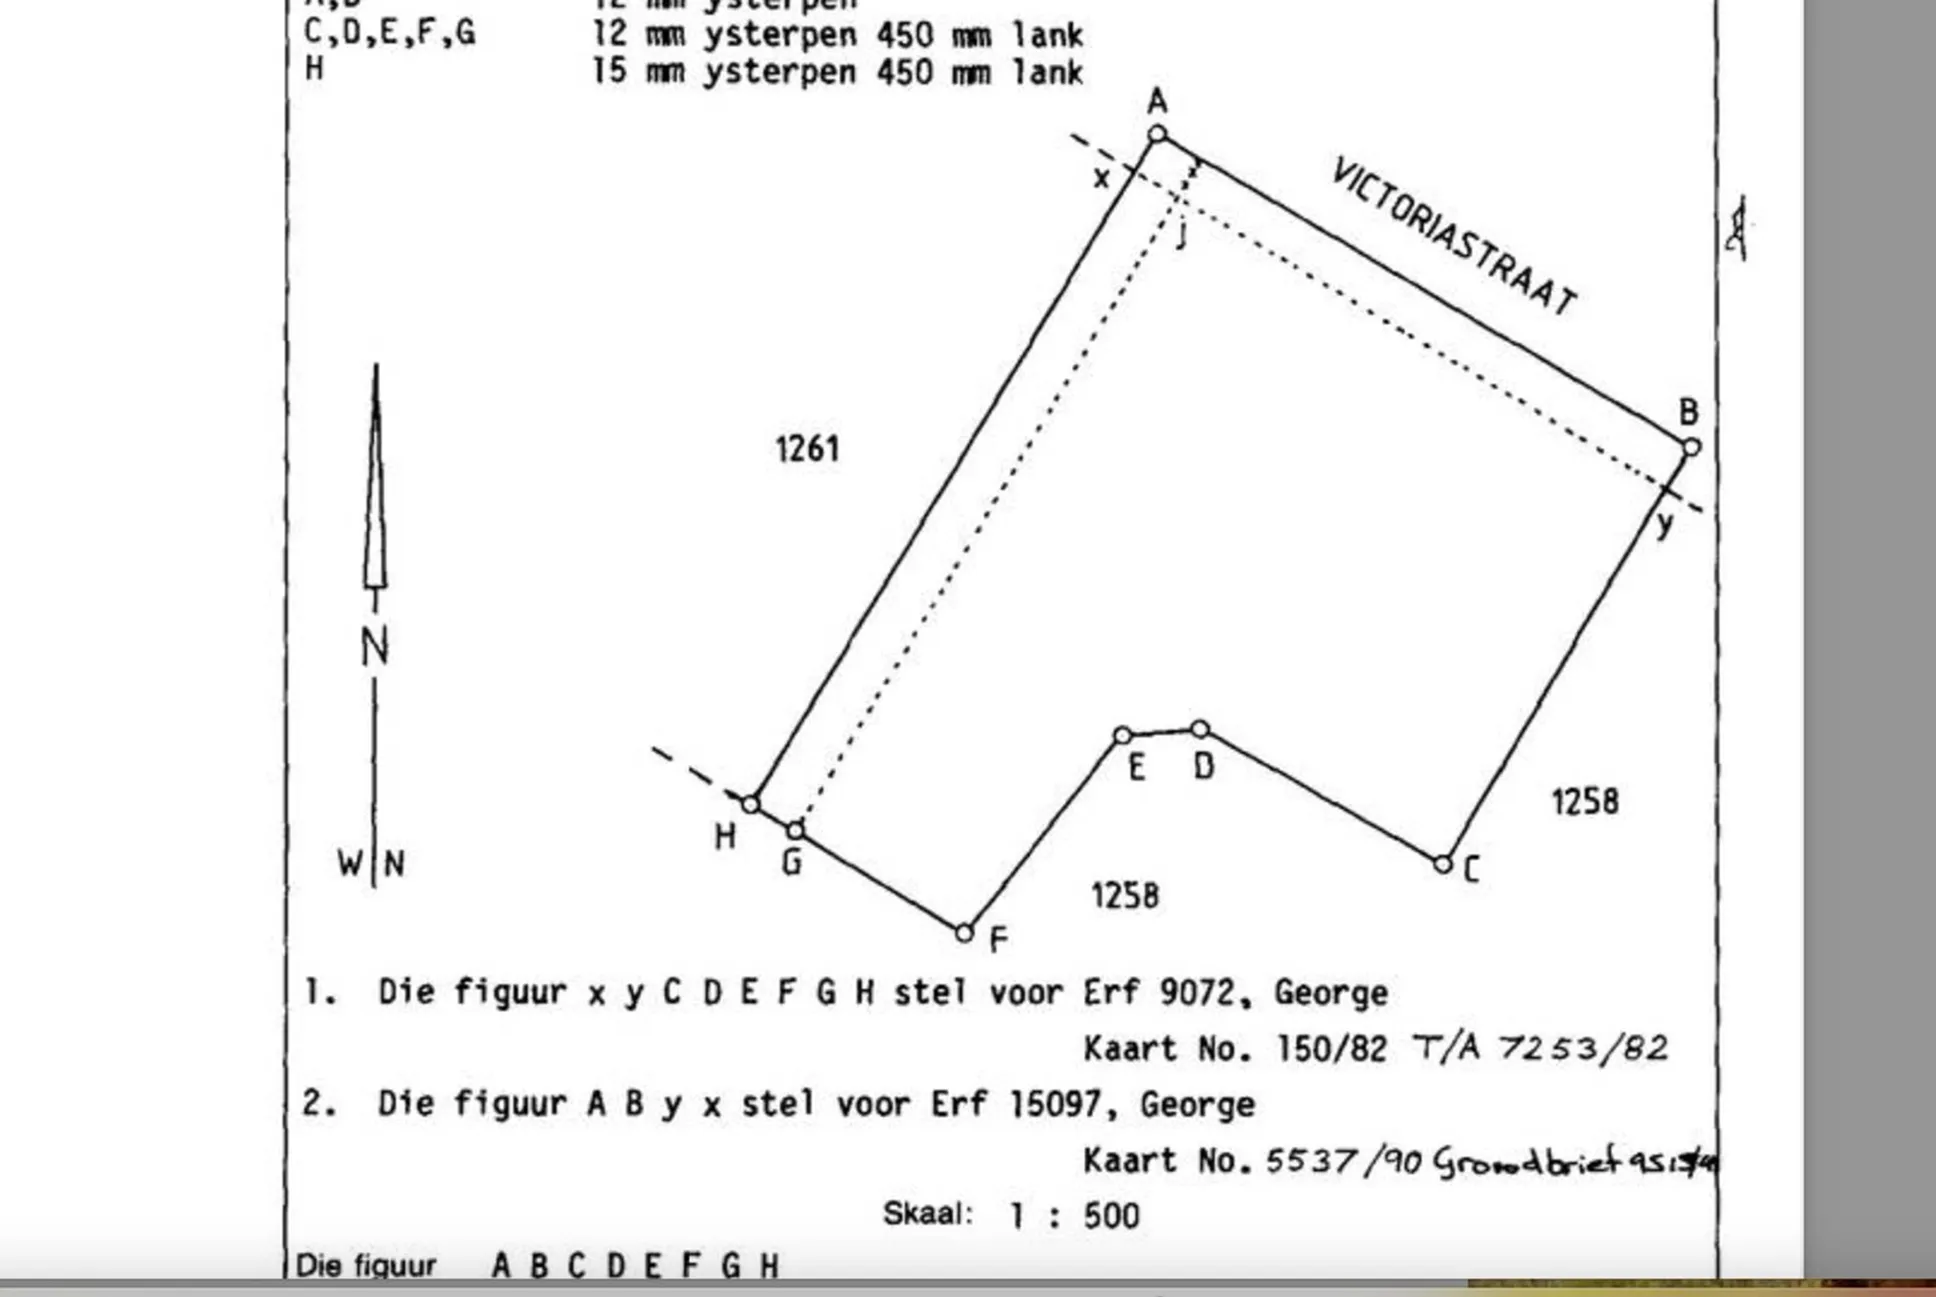
The article mentions everybody except the structural engineer. Seriously the collapse has got nothing to do with spatial planning.
A structural engineer should have signed off on the plans and there should also have been a structural engineer on site. So who were the structural engineers?
Accurate news
The article uses an interesting word – implosion – which means of course, a sudden and violent falling into itself.
Such a sudden inward-flowing collapse, is the kind of result that an expert in demolition of old buildings, most wants to happen; this results from simultaneously exploding, pre-placed explosives, on or at, the most strategic support points. Yet there have been no reports of sounds of an explosion, though if done professionally it might all just come under the noise of the building suddenly collapsing.
Structural collapse, arising from, for example, inadequate steel barring in the cement, or the use of inferior cement, or simply bad design, is highly unlikely to result in such a sudden implosion, and would, in a worst-case scenario be more akin to falling dominoes.
I believe that this case needs to be very carefully examined, but as speedily as possible. We need to know the how and why this building suddenly imploded in our country that is seemingly infested with a construction mafia. Was protection money paid, or demanded, might be an interesting starting position.
They did well to get a sale during Covid and then get it completed in 3 months.
We had to wait almost two years to get a property transfer done during Covid.
No comment
This is just a sad moment for George. I feel for the Families of the workers still stuck under there and a great shout out for all the people who’s working 24/7 to get the workers out !!! I pray that everyone who is still stuck that God will protect them and bring them out save…
It’s quite apparent that this building had no vertical concrete pillars or framework structure, simply a brick slab construction which for this size of development is inappropriate. So, who approved these plans, who was the QS, who was the engineer. So many questions to be asked!
An architect’s view: The time-line here doesn’t suggest a rush to get onto site; the additional floors were part of the town planning submission, before the working drawings would have been produced, so I doubt the engineer’s would have been under time pressure. I think we’ll discover the problem had to do with support (propping) of concrete slabs, where the top floor shuttering was either inadequately support and caved during the concrete pour, or the props were removed too early, before the slab had cured. A slab like that falling 3-4m would quite likely have overloaded the one below, which in turn would create the house-of-cards collapse that seems to have occurred.
Nothing controversial in the plans, only story……. So bad construction clearly, maybe materials, maybe no approved regularly by the building inspectors or ?
This is a major tragedy for construction, our offices had a moment of silence for our floor meeting yesterday. Our line of work does not come without risks, but somewhere someone made a mistake. Not with maliscious intent hopefully and also not gross neglagence. The building plans changing muptiple times in a short period could be the reason behind it, but not due to incompetence, due to stressful work conditions, if a structural engineers team is put under pressure to produce plans due to them changing it could lead to something that is missed, all the blame can not be pointed at the engineer. I hope this was not the case. We’ll wait for the report and all prayers for the families.
I am sure we will learn the truth soon enough and trust the guilty parties will be made to account.
It went from a 3 to a 4 then a 5 story with a basement added…herein lies the answer from a lay perspective.
We keep all families affected this tragedy in our prayers
Two possibilities for the collapse come to mind: firstly, adding the weight of an extra floor was not included in the strength calculations for the concrete supporting structure; secondly, poor quality cement was used in that concrete (and the concrete cube strength tests weren’t done properly). Just thinking, but I obviously totally agree with the comments above as well. How awful for the relatives (and how fantastic the Gift of the Givers prove to be yet again – along with the municipal workers of course).
This is a very sad situation.
Very sad and tragic situation. Each individual and families remain in our Prayers.
This is very sad
The plan for 4 floors was initially submitted and approved, obviously with construction material covering the length and weight of such a building.
Then the plans were amended and approved to add a fifth floor an increase in weight and length.
I am not an engineer.