


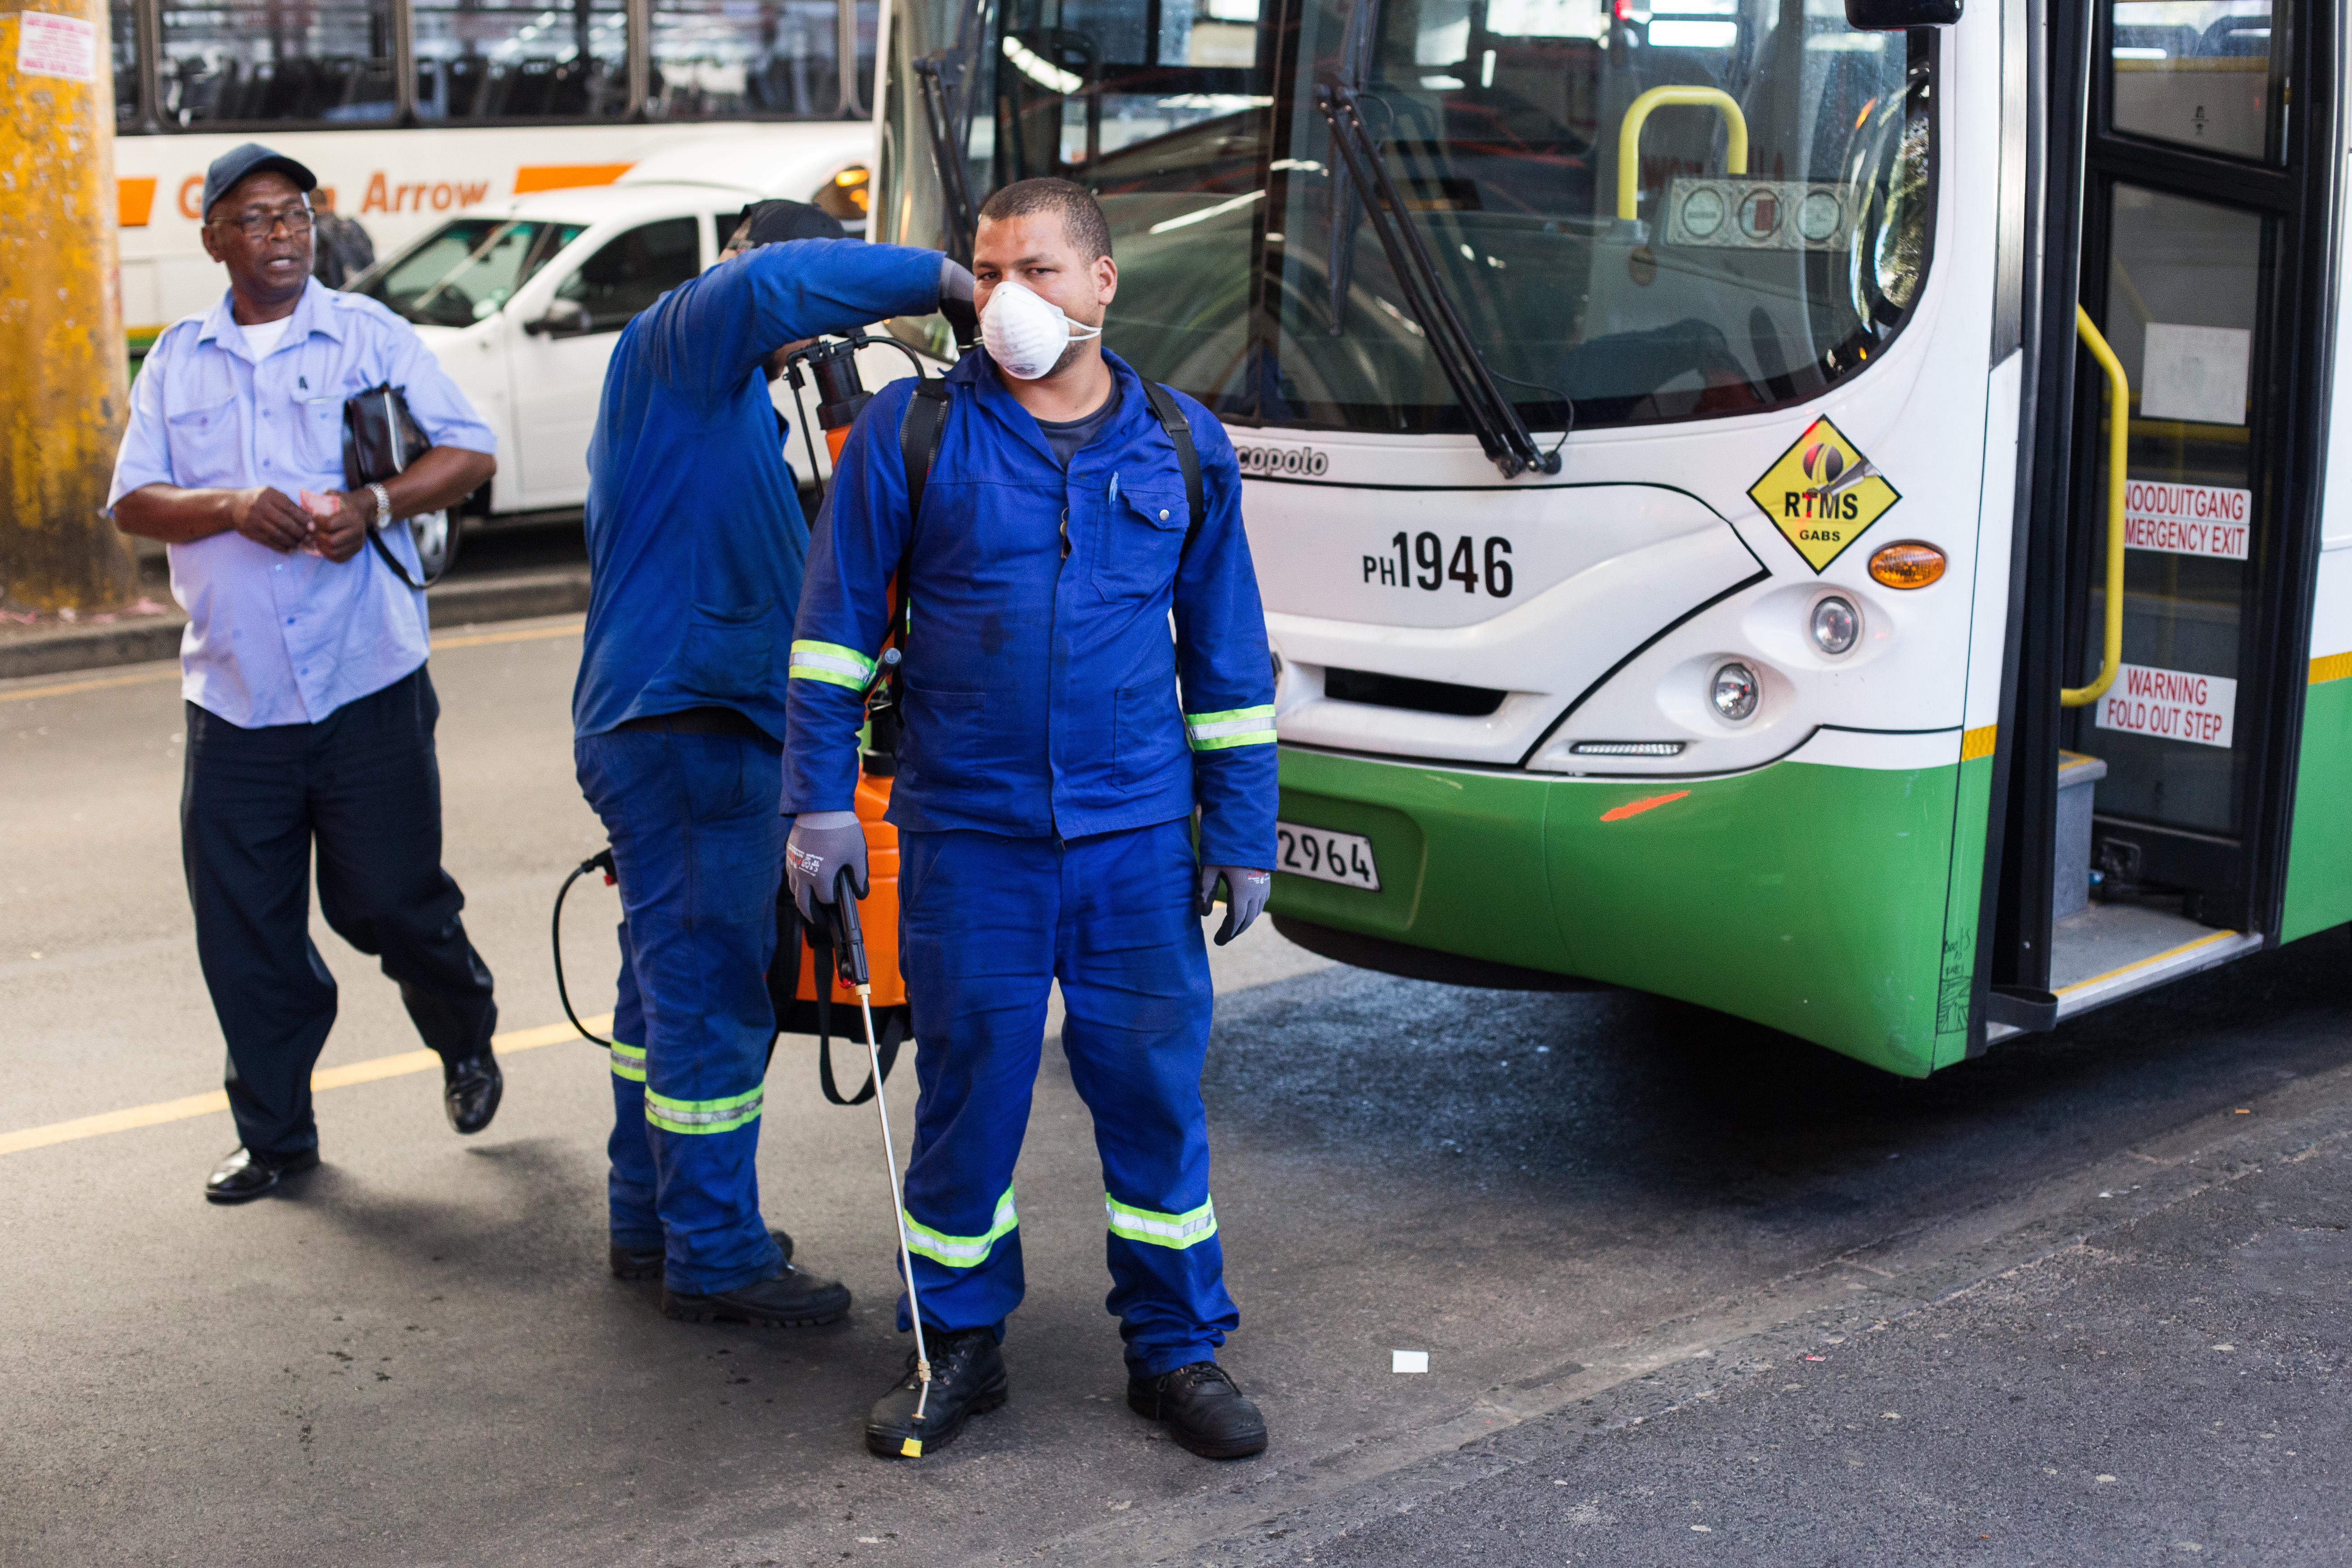
 In the early days of the pandemic, March 2020, buses would be “sanitised”. But as knowledge increased of how SARS-CoV-2, the virus that causes Covid-19, is spread, it was recognised that this was not that useful. (Archive photo: Ashraf Hendricks)
 First published by GroundUp.
Every day millions of people in South Africa have to take a taxi, bus or train to go places. In the midst of the Covid-19 pandemic, how risky is this? No one knows for sure. But we ran some tests that we hope shed light on this.
We used a carbon dioxide (CO2) meter as a proxy to measure how much of each other’s air we’re breathing while we travelled repeatedly on different public transport modes in Cape Town. The science behind this approach is in its infancy. What we did falls far short of a scientific study that could be published in a peer-reviewed journal, but we hope that it’s nevertheless interesting and useful.
A CO2 meter measures the prevalence of carbon dioxide in a given space in parts per million (ppm). Since people exhale CO2, this meter can be used to estimate how much of other people’s air we are breathing. The more of each other’s air we breathe, the more likely we are to catch or transmit viruses that can be transmitted by droplets, such as Covid-19, tuberculosis, influenza and even common colds.
Studies have used these readings to calculate the odds of acquiring tuberculosis on public transport in South Africa. A 2013 study found that “Environmental risk, reflected in the rebreathed fraction of air, was highest in minibus taxis and lowest in trains … Among daily commuters, the annual risk of tuberculosis infection was projected to be 3.5% — 5.0% and was highest among minibus taxi commuters.”
We took readings of CO2 concentration every two minutes and noted the number of windows open, the number of passengers, and other important factors such as whether people were wearing masks, and the weather conditions. We travelled in pairs, and wore two masks at all times, including one KN95 mask.
We took eight taxi trips, two train trips, five Golden Arrow bus rides, and six Amaphela (cockroach) trips.
Outside, in the suburbs of Cape Town, the CO2 meter registers a reading of about 485 ppm. Over 26 minutes, the relatively small GroundUp office (approximately 32m²), with five people wearing masks and three windows open, averaged readings of 559 ppm, with a low of 525 ppm and a high of 593 ppm.
Exactly what a safe level is before you’re breathing in your fellow passengers’ germs in large amounts isn’t precisely known. For one thing, traffic can increase the CO2 substantially and this has no relation to the risk of catching an infectious disease. But, based on discussions with scientists, 800 ppm is a good threshold to try to keep below. Above 1,000 and you’re getting a bit worried. Above 1,500 is bad. Above 2,000 is terrible.
Minibus taxis
We took eight minibus taxis over three days. The first day, 14 June, was unseasonably warm, and we travelled from Rondebosch to town and back. The other two days were colder with some rain.
/file/dailymaverick/wp-content/uploads/2021/06/screenshot_2021-06-28_at_11.47.16.png "A graph showing carbon dioxide levels recorded on minibus taxi trips around Cape Town. (Graph: Provided by GroundUp)")
Our first trips were on a route with a number of stops (the green lines in the graph). On one trip, the taxi had between seven and nine people in it at any one time, and three windows were open. The low reading was 575 ppm, the high was 803 ppm and the average was 751 ppm for a 24-minute journey.
On our way back we waited for the taxi to fill for 16 minutes with the door open. Levels remained low. When we set off there were 22 people in the minibus (yes, dangerous for other reasons) — at this point, the meter read 828 ppm. The low reading was 541 ppm, the high was 989 ppm, and the average reading was 703 ppm across a 48-minute journey.
After a promising start, we faced winter’s reality on 17 June (pink lines). The Cape Town to Gugulethu ride had 16 people inside, and all windows were closed due to the torrential rain. While the readings were low (683 ppm) while passengers were getting on, as soon as the door closed, readings quickly rose above 2,000 ppm, peaking at 2,875 ppm. The average reading for the 16-minute trip was 1,946 ppm. The other trip that day was a brief eight-minute trip between Claremont and Rondebosch with just eight people inside — the average reading was 673 ppm. No windows were open, but this is a ‘short-stop’ route and so the door opens frequently.
On 22 June, we took four more minibus journeys (blue lines).
The ‘best’ trip of the day was between Rondebosch and Cape Town. The average reading on this trip was 673 ppm, with nine people in the minibus. There were windows open for most of the time we were in the taxi, and at 18 minutes into the trip, the meter showed 592 ppm. But at 20 minutes the windows were closed and readings shot up. By the time we finished our 34-minute ride, the meter showed 1,551 ppm.
Our next trip was the worst of this study — Cape Town to Sea Point. There were 18 people in the minibus, and all windows were closed against the rain. As we entered, the meter read 783 ppm — and then went through the roof. Six minutes in, readings peaked at 3,175 ppm. Despite some people leaving, levels remained high — the average for the trip was 2,246 ppm.
The eight-minute trip from Sea Point to Camps Bay had just six people inside. Windows were closed to start (our initial reading was 1,363 ppm), but opened at four minutes. At departure, our meter read 877 ppm.
The final trip of the day was from Camps Bay to Cape Town. There were between seven and nine people in the minibus during this trip, and all windows were closed as the rain persisted. We saw three people not wearing masks, and one of these was sneezing and coughing. Readings rose steadily to above 2,000 ppm during this 22-minute journey, averaging 1,641 ppm.
Trains
As we recently reported, taking a train nowadays is a disheartening experience — low passenger numbers, long waits for trains, sparse security.
But if you’re worried about Covid-19, and live and work on one of the lines that still operates, this may be the safest form of public transport.
On both journeys, windows were open. On the way in, there were only five people in the carriage and readings peaked at 557 ppm; on the return, there were 21 people in our carriage at its fullest, and readings peaked at 646 ppm over the 38-minute journey. Apart from three relatively brief unscheduled stops between stations outside Salt River and Woodstock, the train took just two minutes between stations.
Amaphela
/file/dailymaverick/wp-content/uploads/2021/06/screenshot_2021-06-28_at_11.50.59.png "A graph showing carbon dioxide levels recorded Amaphela trips around Cape Town. (Graph: Provided by GroundUp)")
Amaphela, or cockroaches, are sedan cars typically used for short journeys between townships and shops.
Across our six phela journeys, there were between three and five people in the car. We noted that drivers on three journeys did not wear masks. In general, windows were open. On the trip with the highest measured level (906 ppm), the windows were mostly closed, and the driver had stopped to buy gwinya at the point where the measurements spiked.
Buses
Our first Golden Arrow bus trip was encouraging — it had only eight people in it (a noon journey), and some windows were open. Readings were consistently low — averaging 545 ppm over the 48 minute trip between Gugulethu and Mowbray.
The next two trips were quite a different story. It was a rainy day and upon entry to the 1:20pm Nyanga-Khayelitsha bus, we registered 1,242 ppm. There were forty people on board, windows were closed, and the majority of people were not wearing masks. Four more people joined the bus and we set off. Levels remained above 1,000 ppm for the entire journey (averaging 1,482 ppm), with a peak reading of 1,782 ppm.
/file/dailymaverick/wp-content/uploads/2021/06/screenshot_2021-06-28_at_11.48.47.png "A graph showing carbon dioxide levels recorded on Golden Arrow bus trips around Cape Town. (Graph: Provided by GroundUp)")
The next bus trip that day, from Cape Town to Gugulethu, was worse, with an average reading of 1,831 ppm. At its fullest, there were 60 people on board — at the point where readings went over 2,000 ppm, there were 50 people on the bus. Windows were closed throughout. Many were without masks, chatting freely. This was a 54-minute journey.
The last two bus journeys were fortunately taken in better weather conditions. The Wynberg-Nyanga trip only had 11 people in at most, and windows were open. The readings averaged 643 ppm over a half hour journey with a brief peak of 808 ppm. However, we noted a few people not wearing masks. One of these people was coughing and sneezing.
The Nyanga-Town bus was more full — 25 people at peak, and an average of 21. Just four windows were open as we got on, but more were opened 12 minutes into the journey, as readings hit 800 ppm. The average reading on this trip was 710 ppm.
Comparison
Our results compare reasonably well with the 2013 study, “The lowest carbon dioxide levels were observed in trains (mean = 1,000 ppm); intermediate levels were recorded in buses (mean = 1,150 ppm); and the highest levels were documented in taxis (mean = 1,800 ppm).”
/file/dailymaverick/wp-content/uploads/2021/06/screenshot_2021-06-28_at_10.26.04.png "A graph comparing carbon dioxide levels recorded on taxi, train and Golden Arrow bus trips around Cape Town. (Graph: Provided by GroundUp)")
Our mean taxi reading was 1,236 ppm, and our mean bus reading was 1,042 ppm. However, our mean train reading was just 551 ppm as we took just two trips, and passenger numbers were very low on those journeys. The 2013 study took readings in 2011, while Metrorail was still functional. All the trains that have been denuded of windows are now pandemic assets.
But for buses and taxis, it’s important to note that the rides were highly variable. You could get lucky and ride in a relatively empty vehicle with windows open in the morning, and a few hours later be squeezed like a sardine between two coughing, sneezing people, with the windows closed.
Conclusions
Our study is journalistic, rather than scientific; strict inferences from our data are ill-advised.
We couldn’t say whether CO2 levels in a particular mode were affected by the use of masks, but it certainly made us feel safer when we could see general compliance. Also, we can only make tentative guesses about the effect of exhaust fumes on our readings.
Nevertheless, it’s clear that so much depends on the weather. The trips that recorded high levels of carbon dioxide concentrations were all when there was rain. Understandably, very few people will tolerate being rained on for a 54 minute-long bus ride.
When people open windows, carbon dioxide concentrations drop rapidly, usually to acceptable bounds. “Open windows, all the time” needs to be our golden rule on public transport, no matter what the weather. (They probably don’t need to be completely open.) Perhaps the windows on buses and taxis could be fitted with devices that keep the rain from coming in when the windows are open.
After completing these trips, these reporters watched the EFF’s march on Sahpra (we were on journeys during Magashule’s protest). The massed crowds and suspicious demands on an independent regulator didn’t trouble us nearly as much as the footage of the many dozens of busses carrying supporters in — and nary a mask in sight. We don’t need a carbon dioxide meter to know the high risk of transmission. DM
Thanks to Dr Gareth Kantor and Prof Robin Wood for advising us, as well as the people with Greenflag Association. Thanks to Dr Greg Kew for lending us his CO2 meter. We were inspired to do this by Kantor’s article in the Daily Maverick describing an aeroplane journey.