


Unemployment in South Africa is a wicked problem in every sense of the word, including that it gets abused and misrepresented for the purposes of political point-scoring. In this hazy, noise-filled discourse, current data on and proper analysis of employment in SA are quite scarce and are therefore very welcome when they turn up.
A solid source of longitudinal data is the Spatial Tax Panel data set that was recently (June 2023) made available by National Treasury and the Human Sciences Research Council. What makes this data set so solid is that it comes from the SA Revenue Service (Sars) where it is meticulously verified by law: it covers the entire formal economy rather than being a mere sample thereof, and it includes spatial variables at provincial and municipal levels, which gives it a useful degree of granularity.
According to this data, the SA formal economy accounted for 10.4 million full-time equivalent (FTE) jobs that were registered with Sars in 2021/22. This number is clearly far too low in a country with a population of 60 million.
The formal economy is important for job growth and should be pursued together with support for the informal economy. It is not a matter of one or the other — it is both in tandem. Indeed, an important aim of supporting the informal economy is to facilitate progression into the formal economy where jobs are more stable and well-paid.
The Spatial Tax Panel data helps us understand what we can learn about formal employment patterns in our provinces and metros. Where are the formal jobs located? Where were these jobs added and where were they shed? What happened to jobs over time? What effect did Covid have?
The data set aggregates formal employment numbers from 2014 to 2022 along multiple dimensions. However, the focus of this article is on the fluctuations in formal employment from 2019/20 to 2021/22 in our provinces and metros.
A comparative analysis of these fluctuations is illuminating and will be useful to provincial and metro governments, as well as provincial legislatures and metro councils.
Provincial analysis
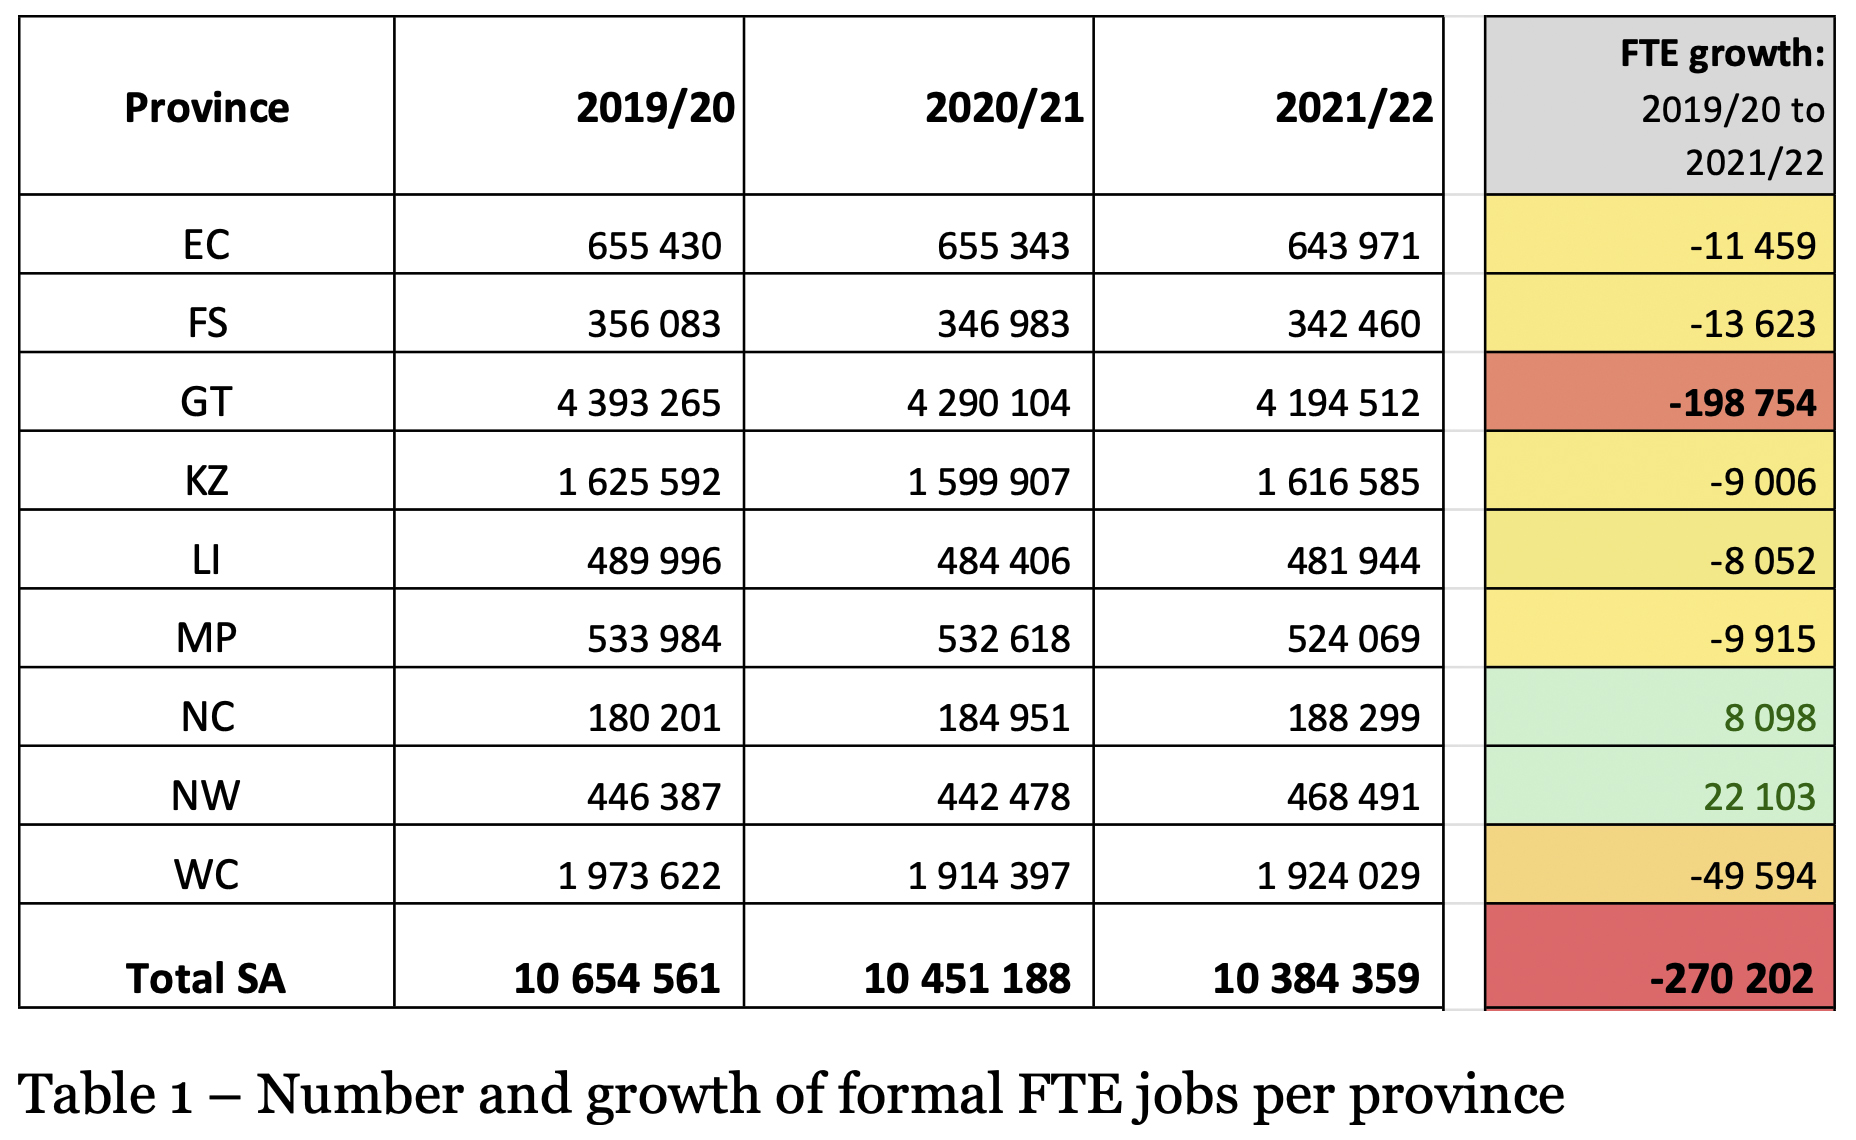
Table 1, below, sets out the quantum of formal jobs in existence per province. Overall, the formal economy shed over 270,000 jobs over the years under consideration.
The North West (NW) and the Northern Cape (NC) were the star performers where the number of jobs increased, albeit off low bases.
Gauteng and the Western Cape, the two largest provincial economies, shed the most jobs over this period — combined, they lost almost 200,000 jobs over the three years.
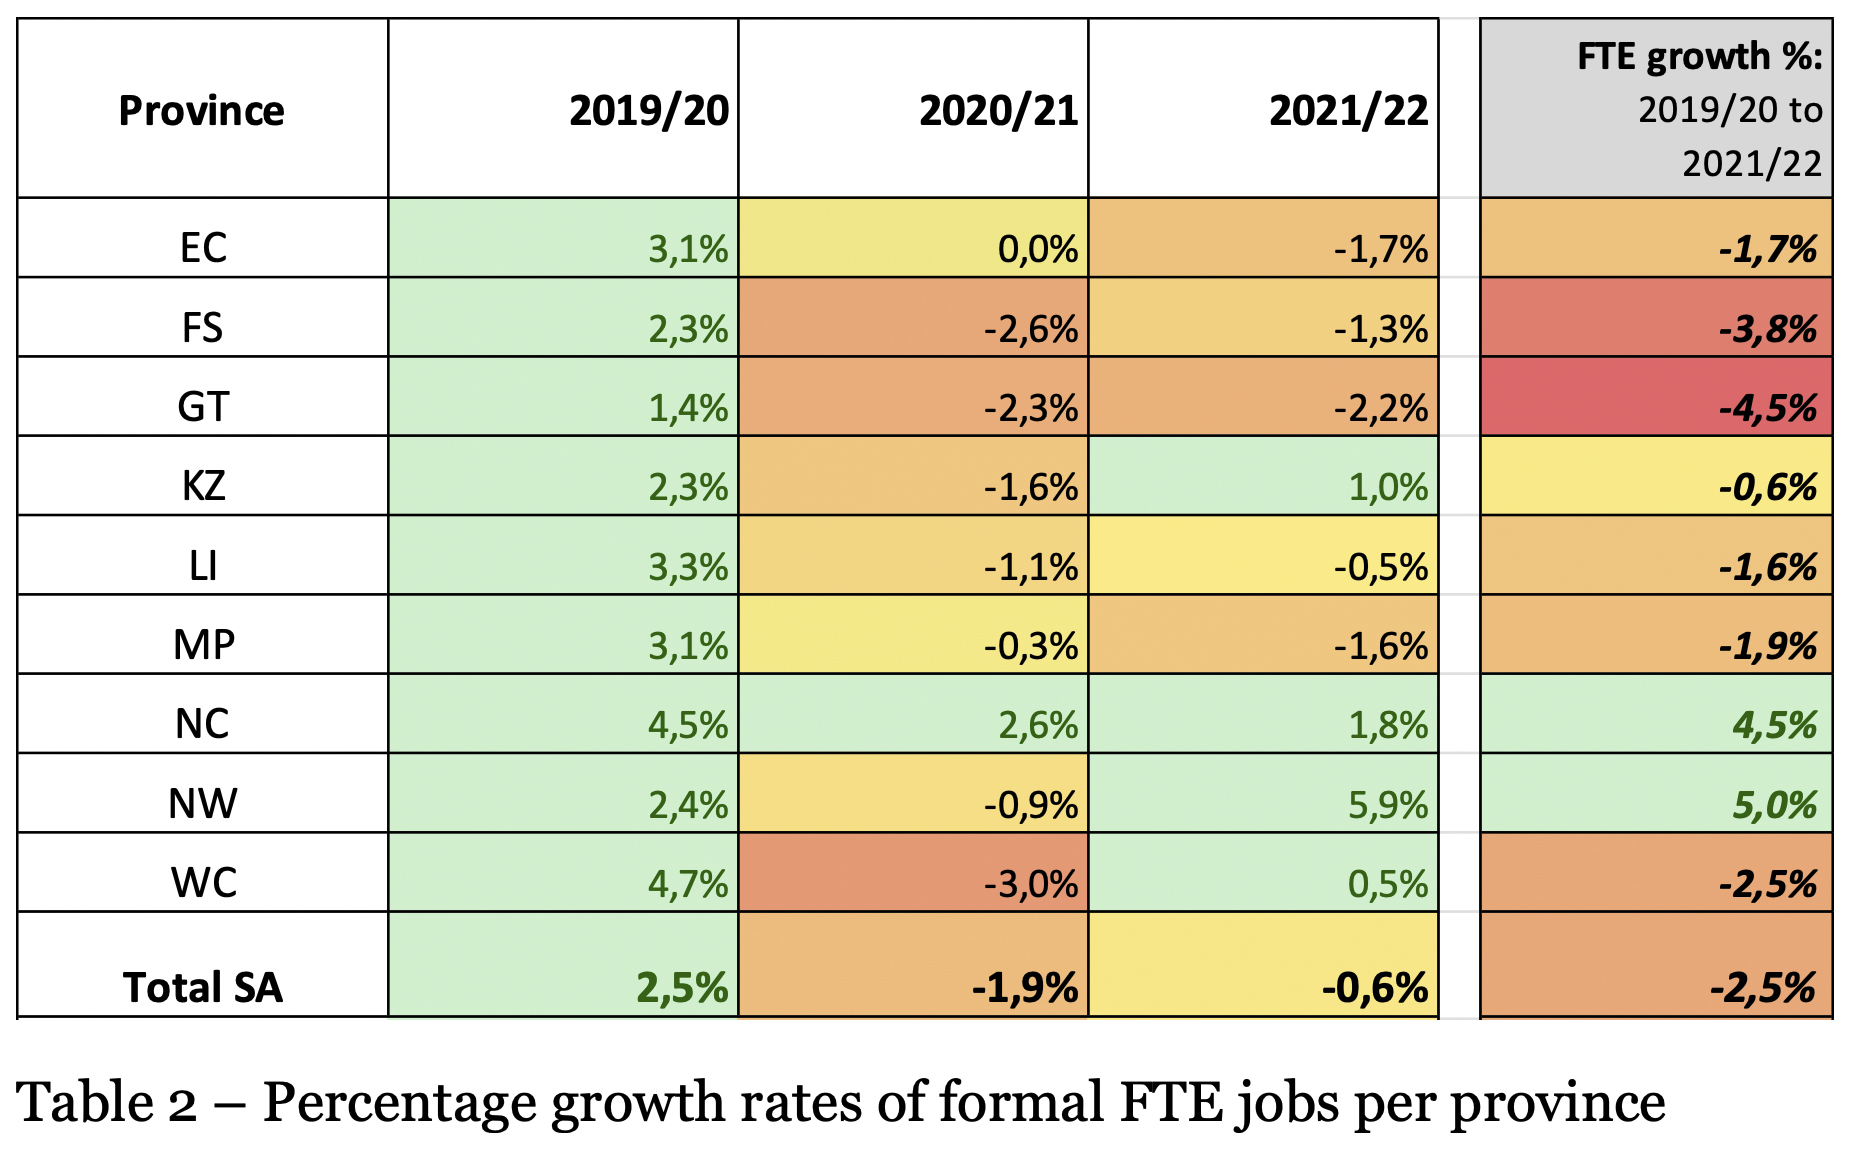
In Table 2 below, we get a clearer picture of employment growth rates in the provinces by looking at the percentage increases and decreases in recent years.
The second year of the Ramaphosa presidency, 2019/20, was a bumper year for job growth. However, this was largely reversed in 2020/21, the first Covid annus horribilis.
Here we see the pronounced impact of the pandemic in 2020/21 when over 200,000 jobs were lost that year and a further 70,000 were shed in 2021/22.
Based on the growth trajectory (+2,5% growth in 2019/20), the full impact of Covid was in the region of about 800,000 FTE job opportunities that were either lost or did not materialise in 2020/21 and 2021/22.
Metro analysis
The metros are the engine rooms of the formal economy and accounted for 6.7m or 65% of formal jobs in SA in 2022.
Table 3 below sets out the number of FTE jobs over the three years in each of the metros. This table tells a sorry tale of uniform job losses in our cities, with over 275,000 jobs lost between 2019/20 and 2021/22.
Our cities have thus been sites of sustained job destruction in recent years.
The worst performers were Joburg (JHB), Cape Town (CPT) and Ekurhuleni (EKU), followed by Tshwane (TSH), which together shed about 240,000 jobs.
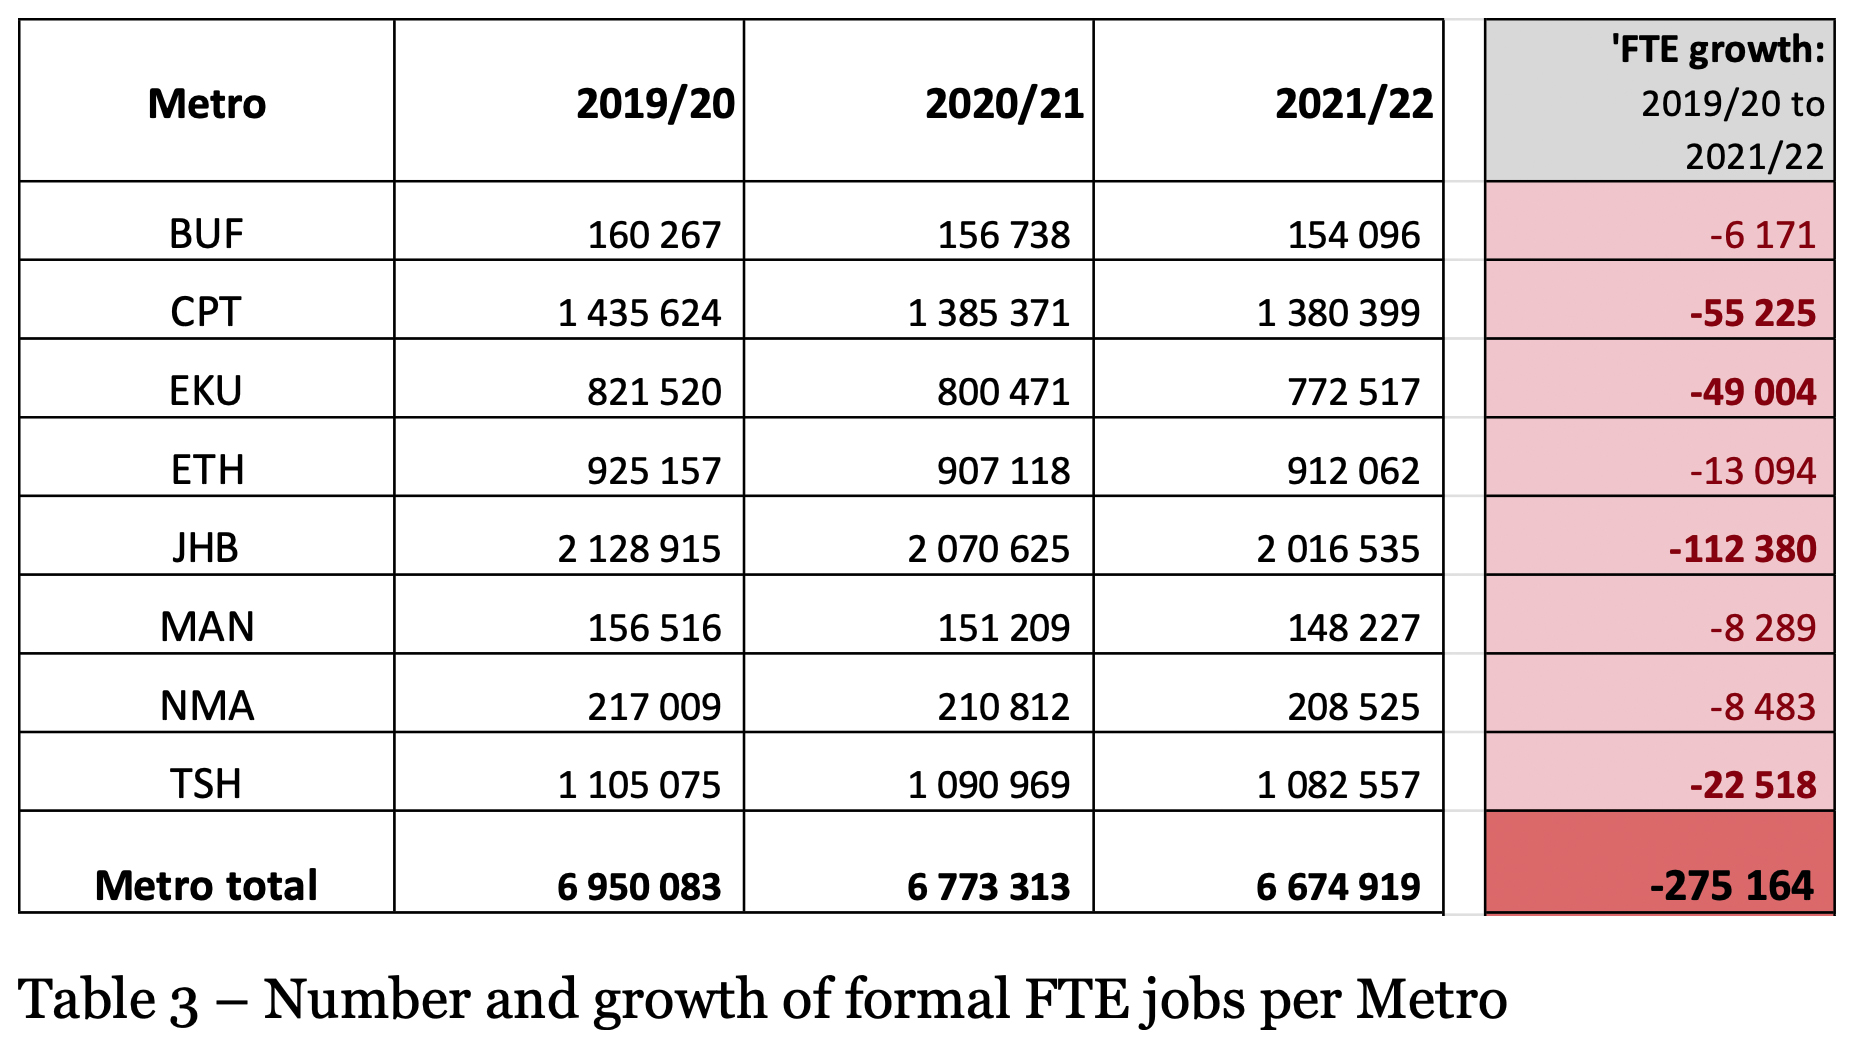
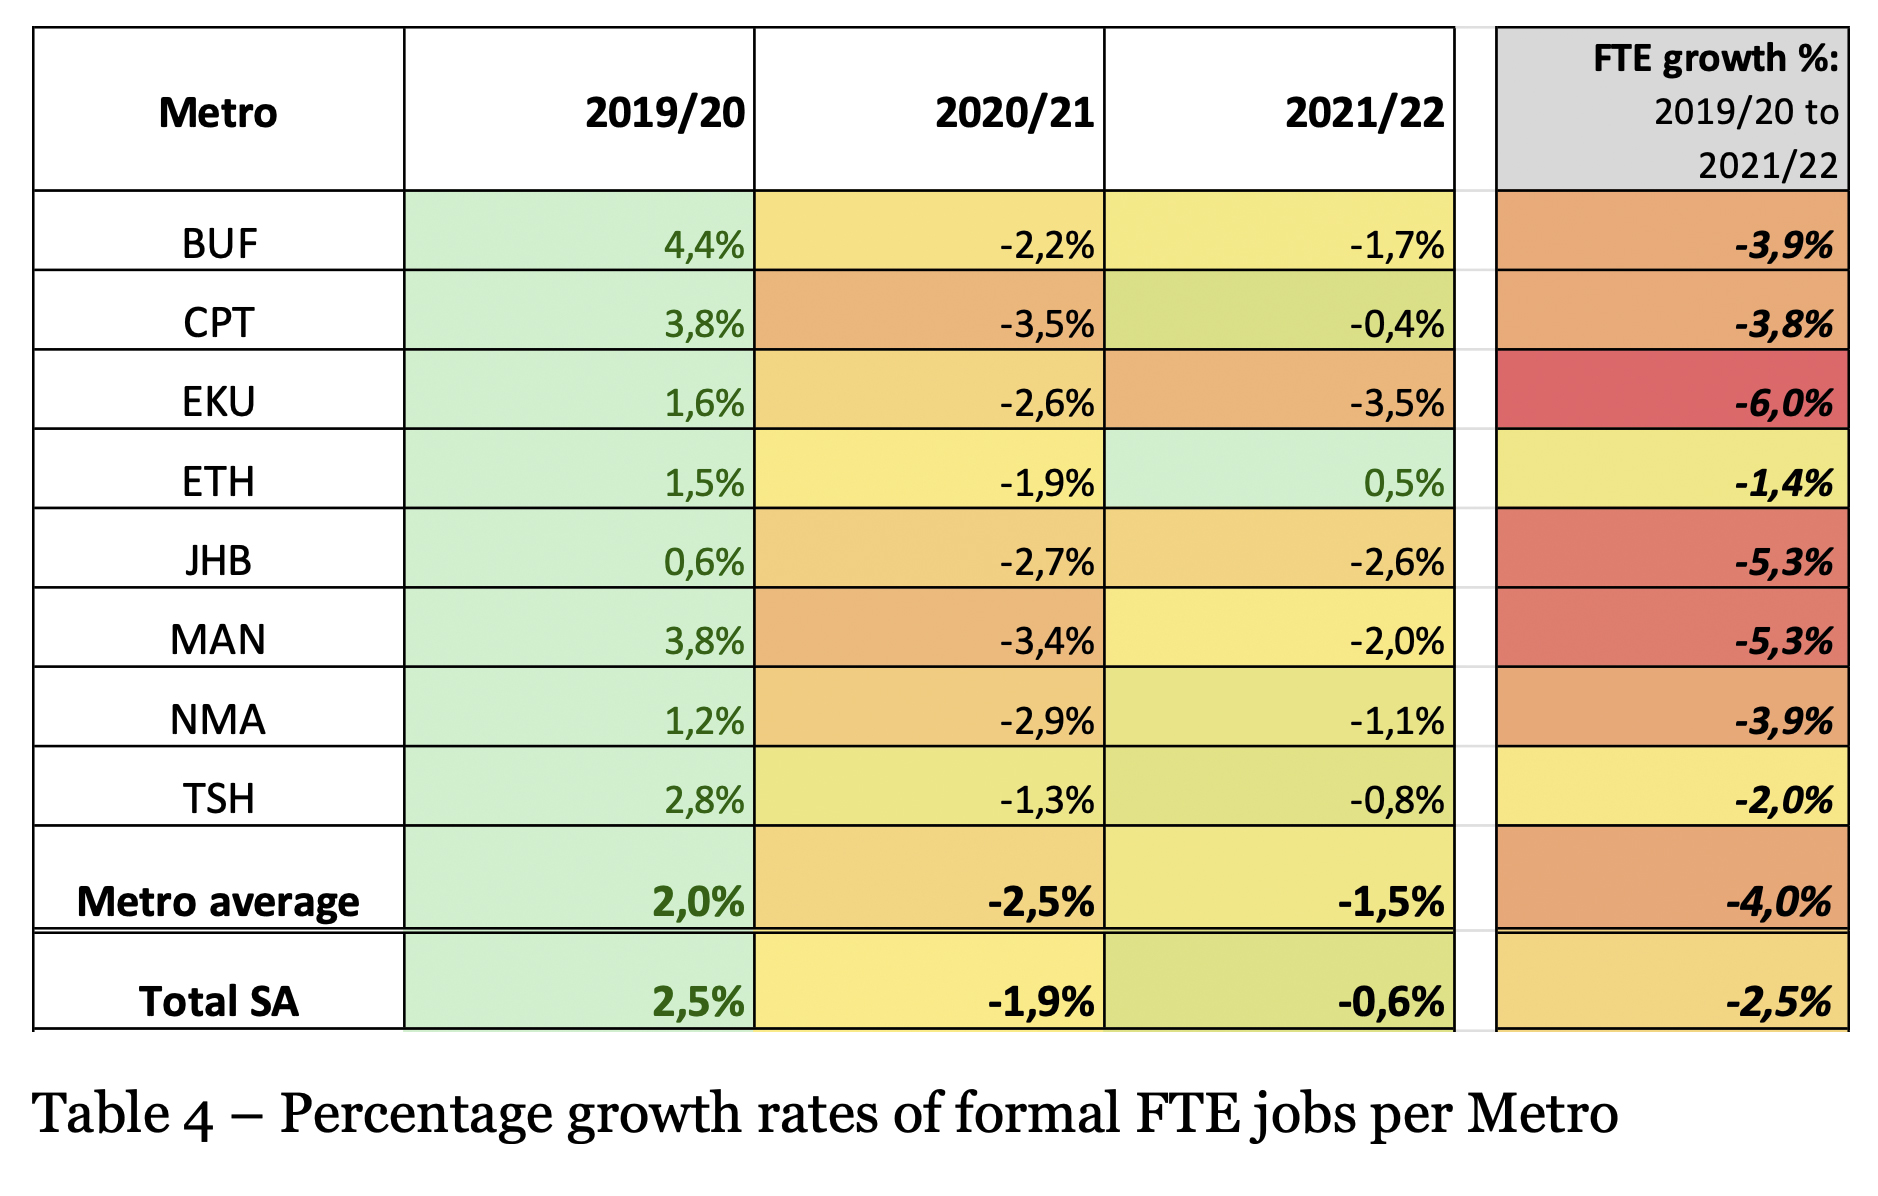
Table 4 below provides a picture of job growth and declines in the metros in percentage terms.
All of the metros grew jobs in 2019/20 (the pre-Covid year) but shed jobs in both years thereafter. Over the three years, metro jobs declined by 4%, which was substantially worse than the decline of 2.5% for the SA formal economy as a whole.
It was the metros that bore the brunt of the Covid hit on jobs.
The spatial analyses above paint a mixed picture of what has happened with formal employment in the recent past. However, as we look ahead, there are important positive conclusions that can be drawn from these analyses.
First, the across-the-board positive growth rates in 2019/20 prove that it is indeed possible to achieve employment growth of 2.5% per annum in the formal economy. It also provides hard evidence that the Ramaphosa presidency was effective in ramping up formal job growth in the pre-Covid years. If this trajectory had not been stymied by the pandemic, formal employment could have reached 11.2m FTE jobs in 2022.
Second, there was a deceleration of job losses in 2021/22 as the Covid impact waned, and this shows that the formal economy is resilient and still has the potential to create jobs. Because of this, job growth in the 2022/23 year will likely return to positive territory. The challenge is to create the conditions for these trends to continue.
Third, and most importantly, it shows how formal employment growth is a long-term endeavour that depends on stable year-by-year growth in the metros and provinces of South Africa. This, in turn, depends to a large extent on the political will of our governments in those metros, municipalities and provinces. DM