


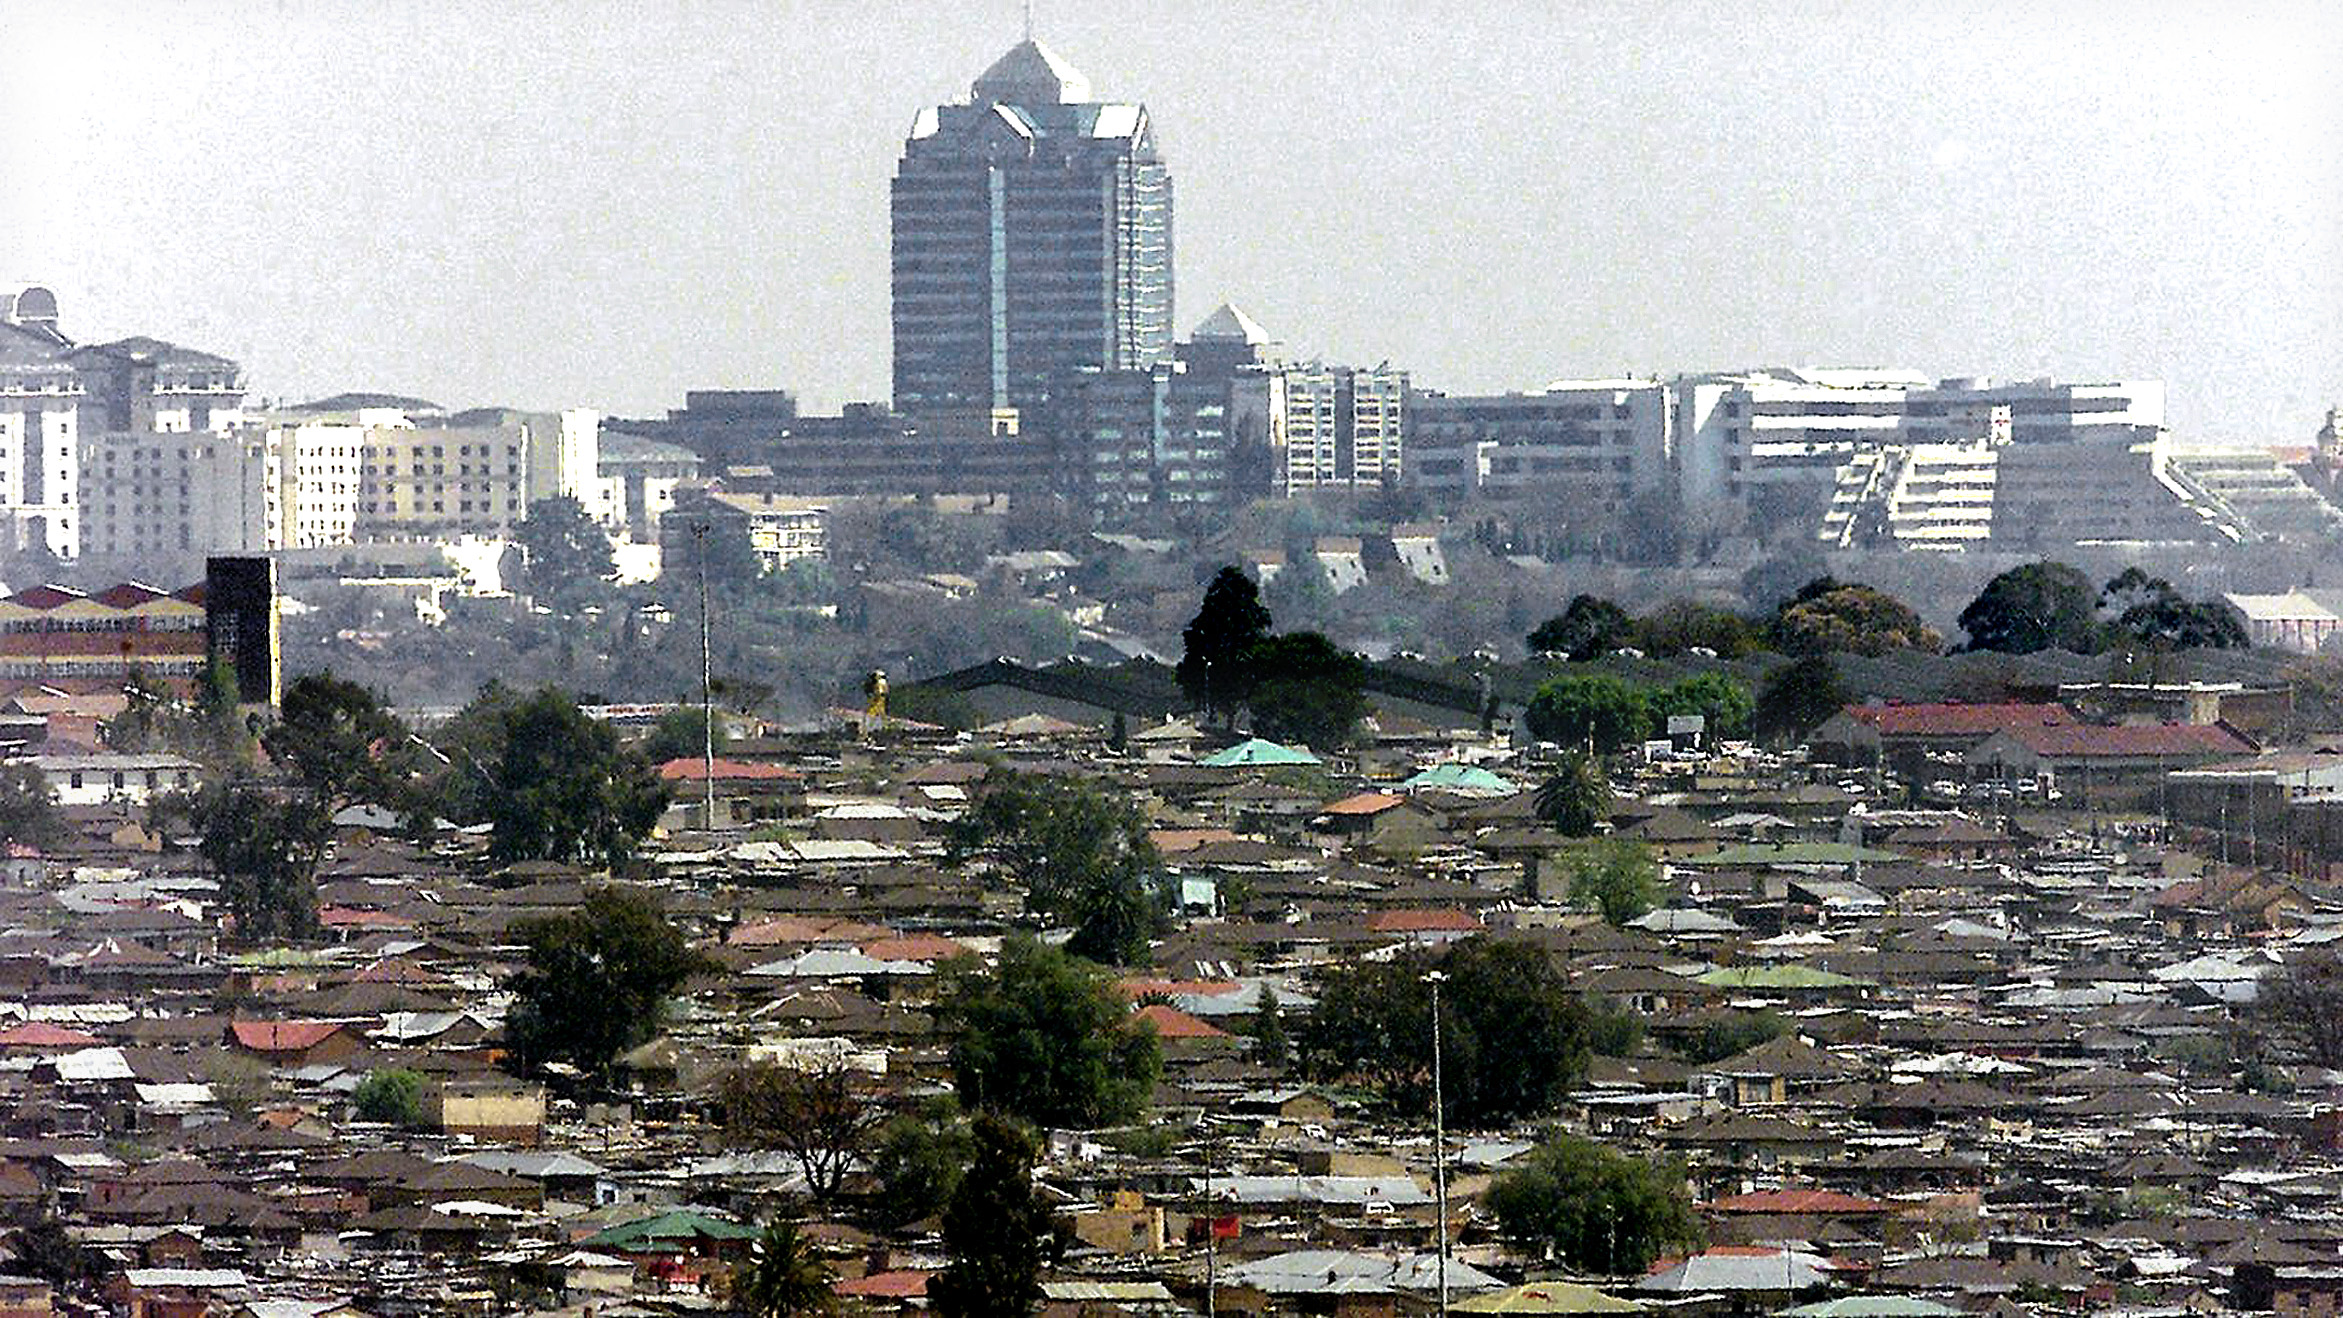
 Alexandra township and Sandton — a dichotomy of poverty and wealth.
(Photo: Quartz Africa)
Alexandra township and Sandton — a dichotomy of poverty and wealth.
(Photo: Quartz Africa) Mention the word township in South Africa and it immediately sparks mental images similar to the photograph above, of the dichotomy of poverty in close proximity to wealth. It is a term that often invokes images of underdeveloped and racially segregated areas.
While this is still very much the truth, the township economies of the country will have to be a key focus of economic development going forward.
According to Asad Alam, the World Bank Group country director for South Africa, “addressing the spatial inequalities in the country reflected in the townships is essential to improving the lives of people”. After the Covid-19 lockdown, the revival of township economies will be essential if South Africa is to avoid massive unemployment, increased levels of poverty, food insecurity and the potential for social unrest and upheaval.
There is also much discussion about economic transformation, inclusive growth and competitiveness, but when it comes to understanding township economies, most policymakers in government and decision-makers in the private sector flounder due to lack of information and accurate data.
There are many national and local government initiatives to stimulate township economies, but they are muted or less than successful because of a limited understanding of the township realities in both public and private sectors. Real opportunities will only be taken advantage of if clearly identified. It is the author’s experience that a multitude of “in-township” and “out-of-township” opportunities are missed because of a lack of understanding of the market realities.
The Covid-19 pandemic has highlighted the need for policymakers and service providers to sharpen their understanding of the realities faced by township residents and, in particular, township traders.
Government economic strategies for townships
In her budget speech to the National Council of Provinces on 28 July 2020, Minister Khumbudzo Ntshavheni of the Department of Small Business Development gave some indication of how the government will focus on trying to revive the township economy from a formal and informal, small and medium business perspective. Other government departments have their own focus on improving the economy and wellbeing of township communities.
The department will prioritise the Township and Rural Entrepreneurship Programme (TREP) that will focus on strengthening informal businesses, creating markets for small, medium and micro enterprises (SMME) and promoting localisation and industrialisation.
As part of TREP’s five-year programme, there will be a focus on supporting businesses in the automotive industry, such as motor mechanics, panel beaters, auto fitness centres and auto spare shops. The government will also be focusing on the viable development of businesses in the bakery and confectionary as well as butchery industries.
To be able to accomplish this requires access to information within an appropriate framework which would look at the demand side of the market from a demographic and consumer perspective. It would also need to look at the market from a supply perspective in relation to what is already in existence and where the potential gaps are. In order to identify these gaps, it is critically important that proper accessibility studies be done to determine the optimum number and location of these businesses in townships and rural areas.
This is a crucial factor, because research has shown that SMME owners identify the location of their businesses as one of the most important areas where they need help. Poorly located SMMEs generally have a lower turnover and a poorer profit margin, research has shown. Without an understanding of the consumer behaviour of people living in townships and rural areas, the viability of businesses to be supported by the government may be compromised.
A key issue is the number of townships in South Africa and their locations. Currently, there are 513 across the country. What people tend to forget is that townships in South Africa developed as a consequence of apartheid laws which saw black, coloured and Indian people being segregated, and forced to live in the townships that constitute a key aspect of the country’s landscape.
These townships have been mapped and their boundaries defined. Many datasets associated with each of them have been created. Figure 1 below shows the spread of townships across the country and their clustering, especially around larger cities and towns.
/file/dailymaverick/wp-content/uploads/MC-Bob-townships_2.jpg "Figure 1: Location of South African townships")
A township opportunity atlas
After studying the townships of South Africa for many years and developing the first township atlas, the development of a township opportunity atlas for the country was conceived. It was recognised that many national and local government initiatives existed to stimulate township economies, but there was limited understanding of the township realities on the part of the public and private sectors.
 It was also realised that there were large amounts of data available for townships, but not from a single source or with an analytical platform. Without this information, it is difficult to bring about radical economic transformation, especially for women and youth in the townships.
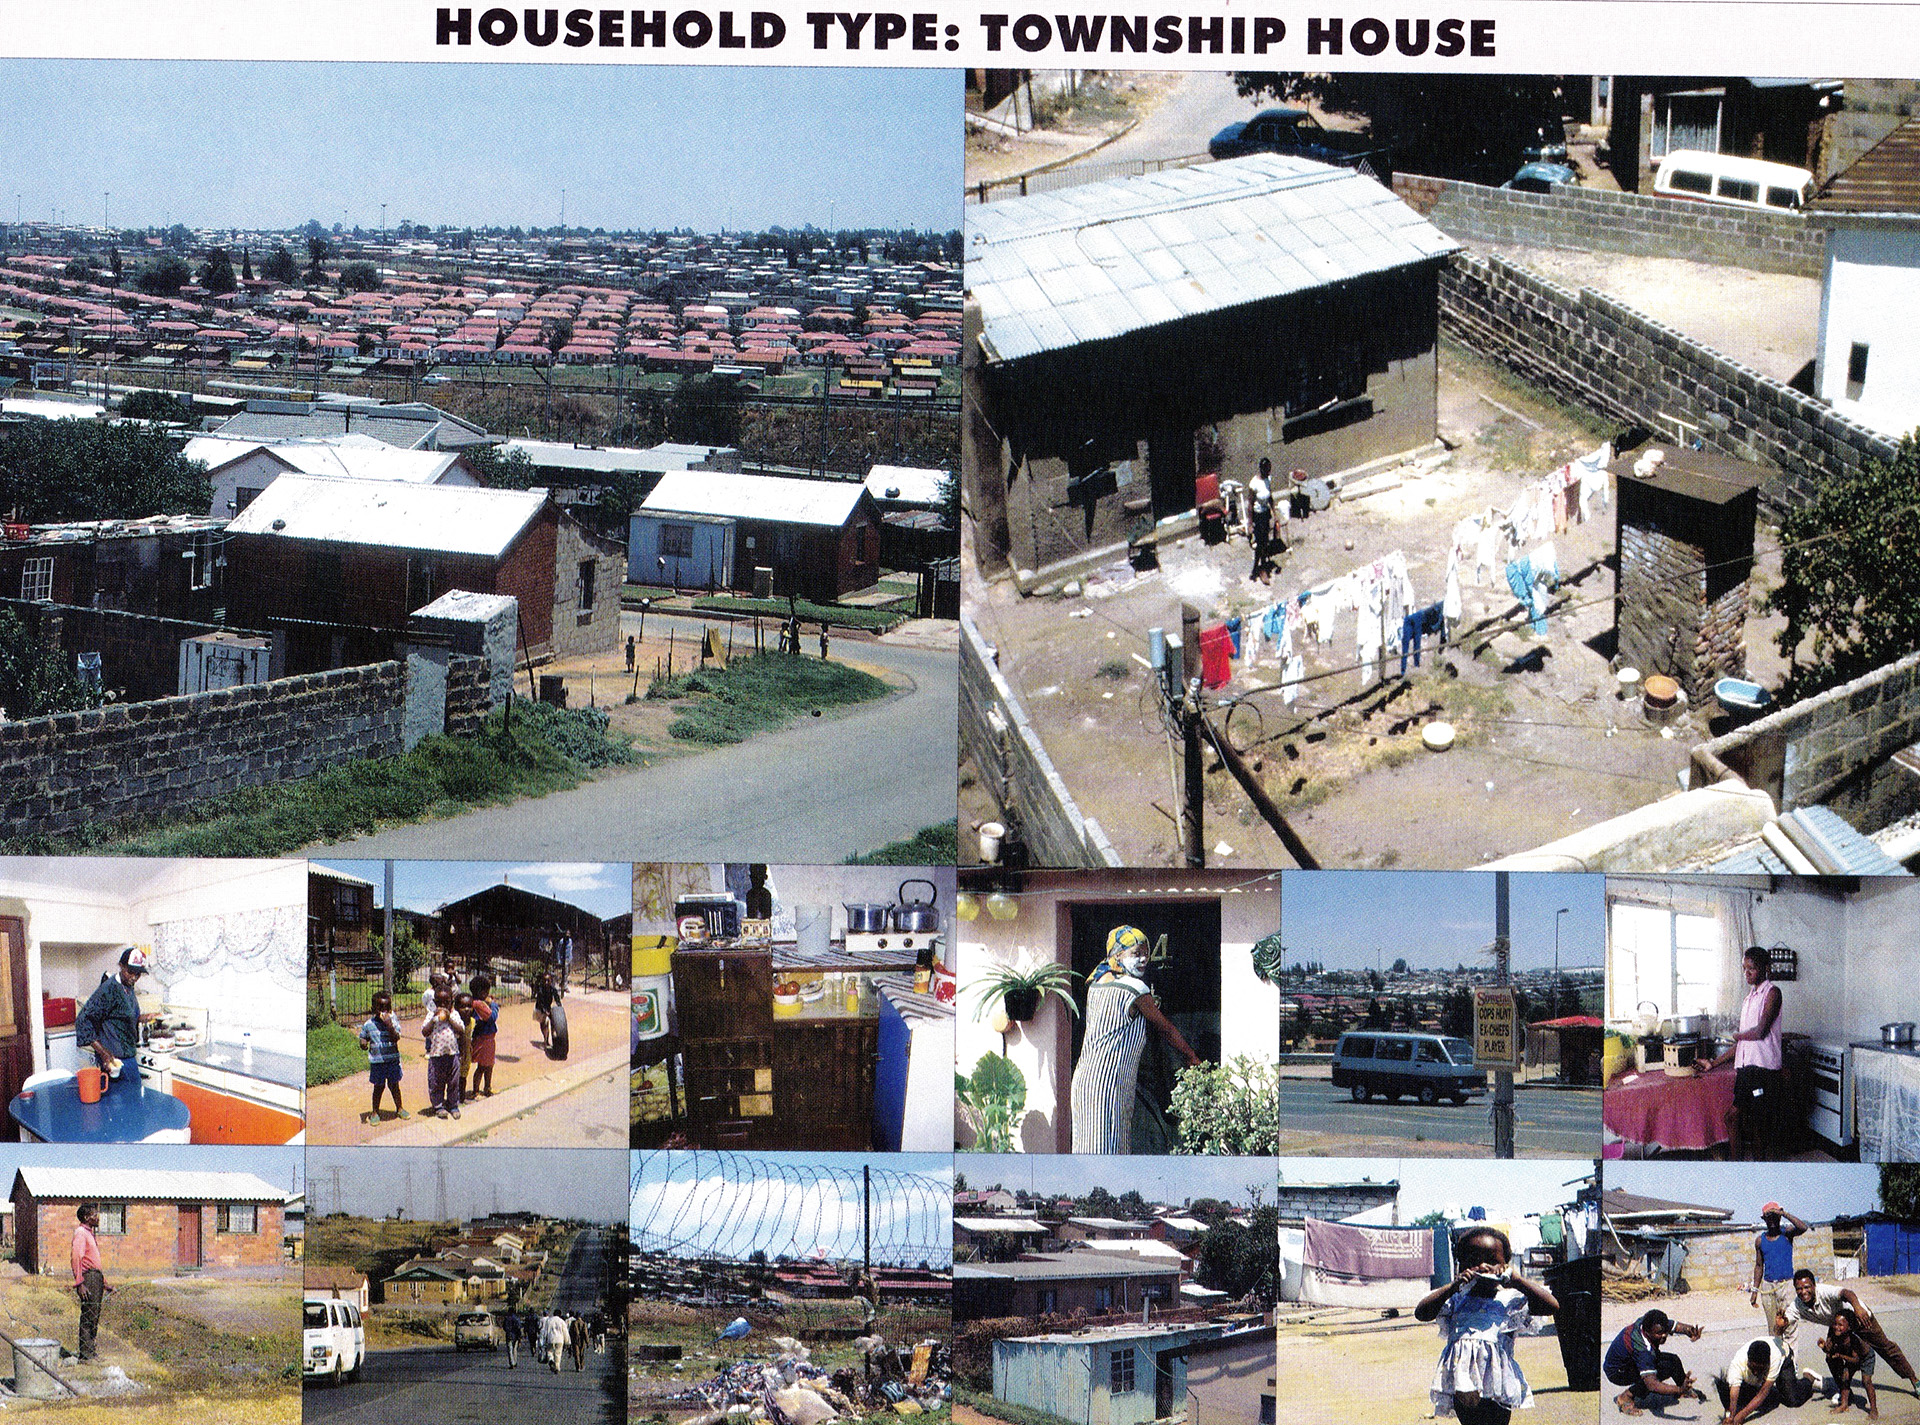
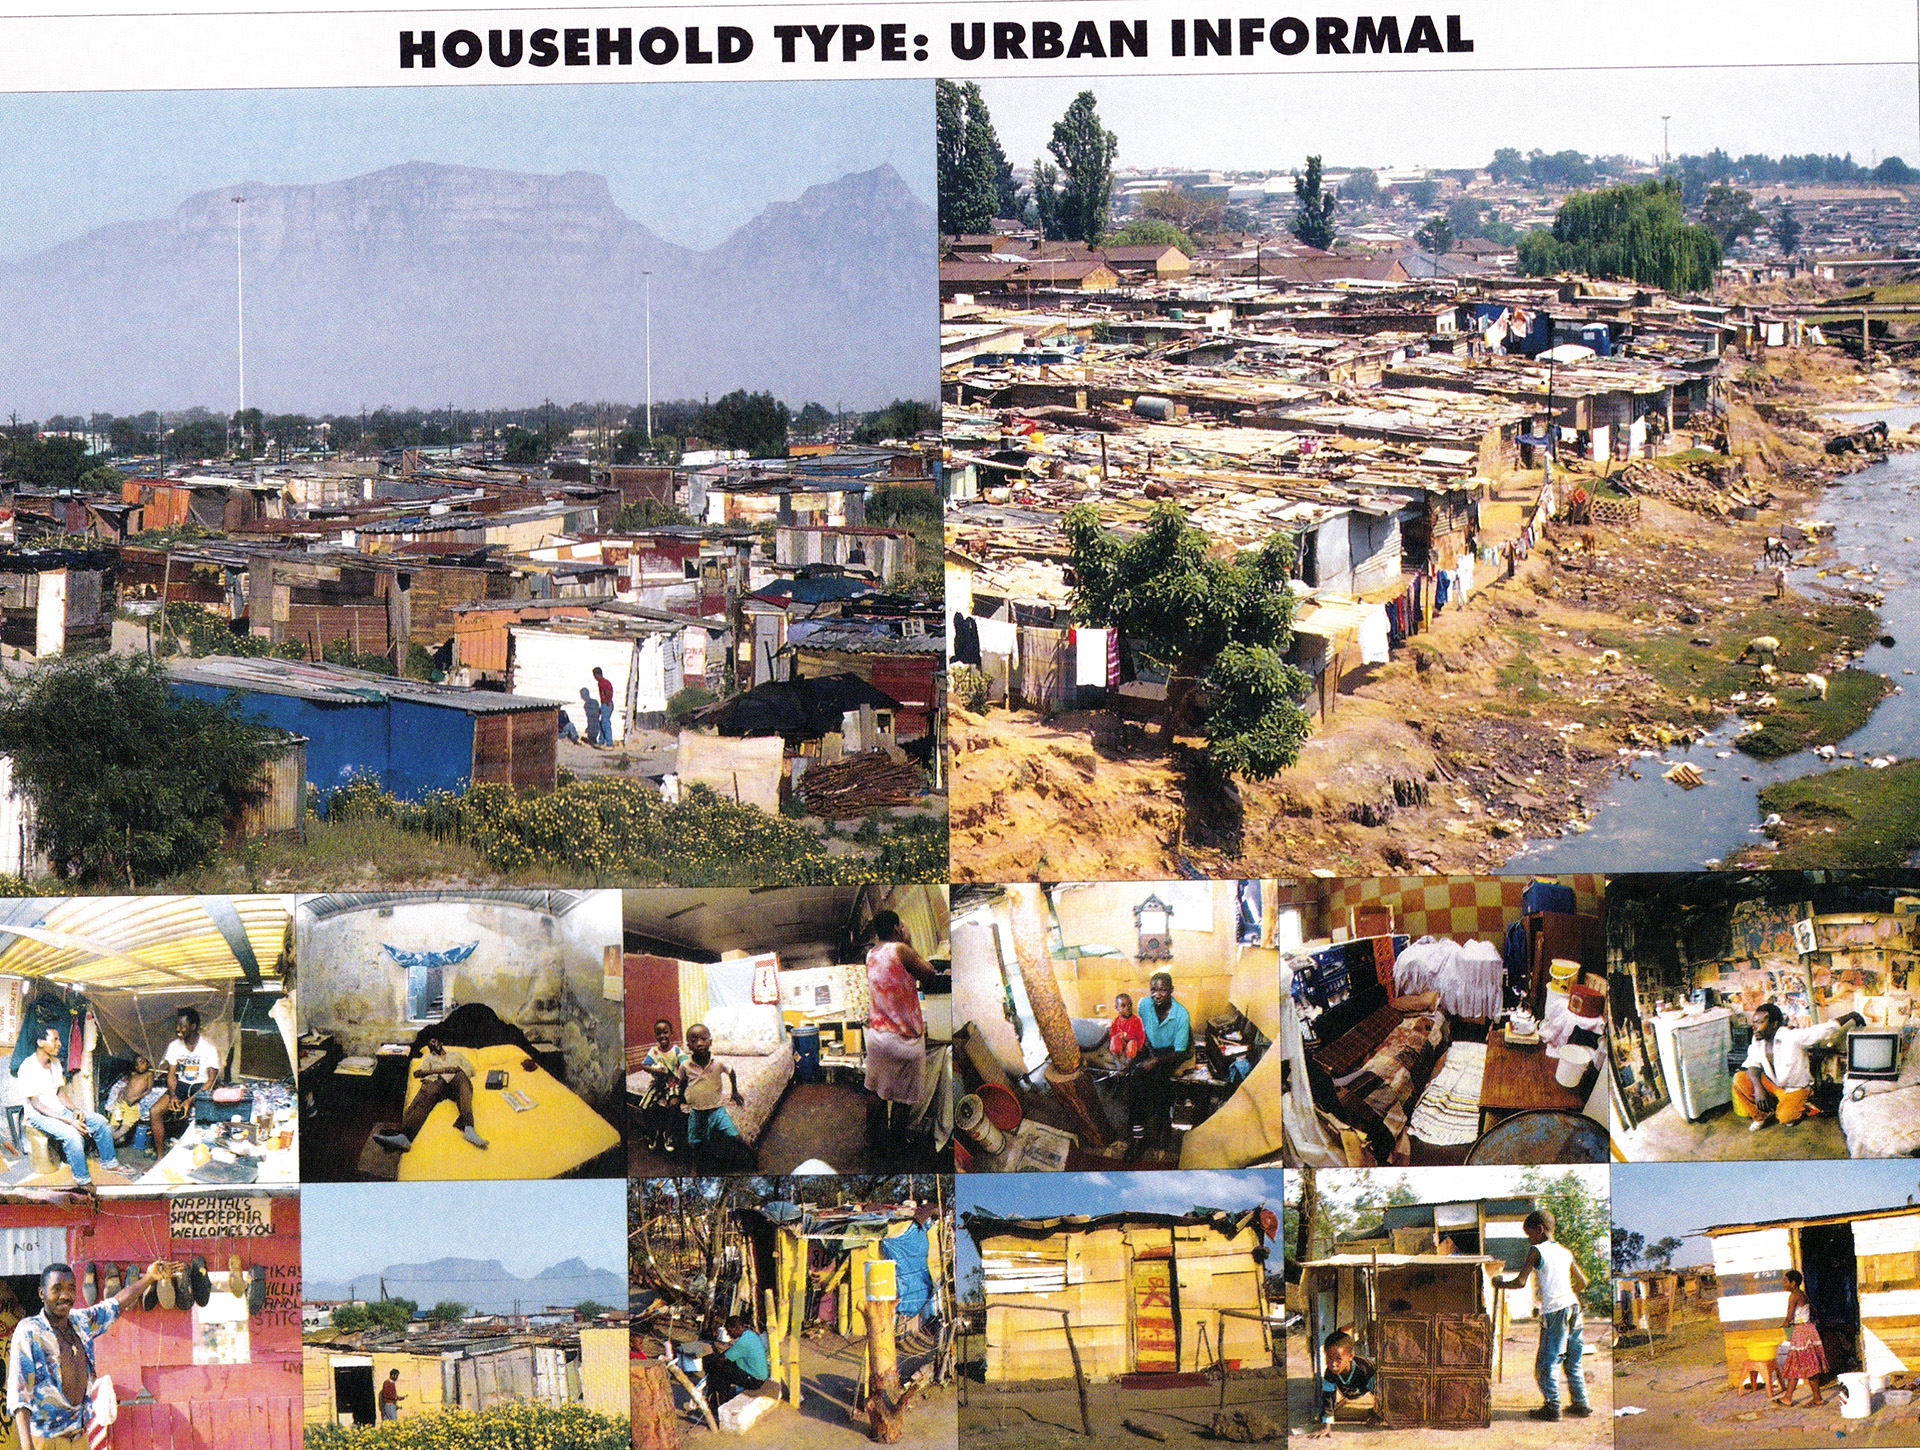
The characteristics of townships must be understood from a number of different perspectives. This includes the demographic and socioeconomic profiles of different communities within townships, as well as the type of housing that people live in. Figures 2 provides a picture of the diversity of communities and housing types that are often found within townships.
 Having an accurate estimate of the size of the population is vital to the success of developing townships. To compile accurate demographics, population demographics from the 2011 national census have been updated to 2019 values, using statistical estimates and satellite imagery. The township opportunity atlas is the only tool in the country that provides access to these updated statistics in a geospatial format.
The same applies to understanding poverty and unemployment. Again, carefully updated statistics on the level of unemployment and poverty are available.
Along with these estimates goes the understanding of the gross geographic product (GGP) of the individual townships so that economic sectors are easily identified.
Equally important is the understanding of financial inclusion in the townships. The living standards measure (LSM) has been mapped down to the enumeration area level for each of the townships in the country. This enables marketers and policymakers to better understand the quality of life of all people living within township boundaries.
 Structure counts in townships across the country show that there has been significant growth not only in the number of formal houses, but also in the number of backyard structures, which
 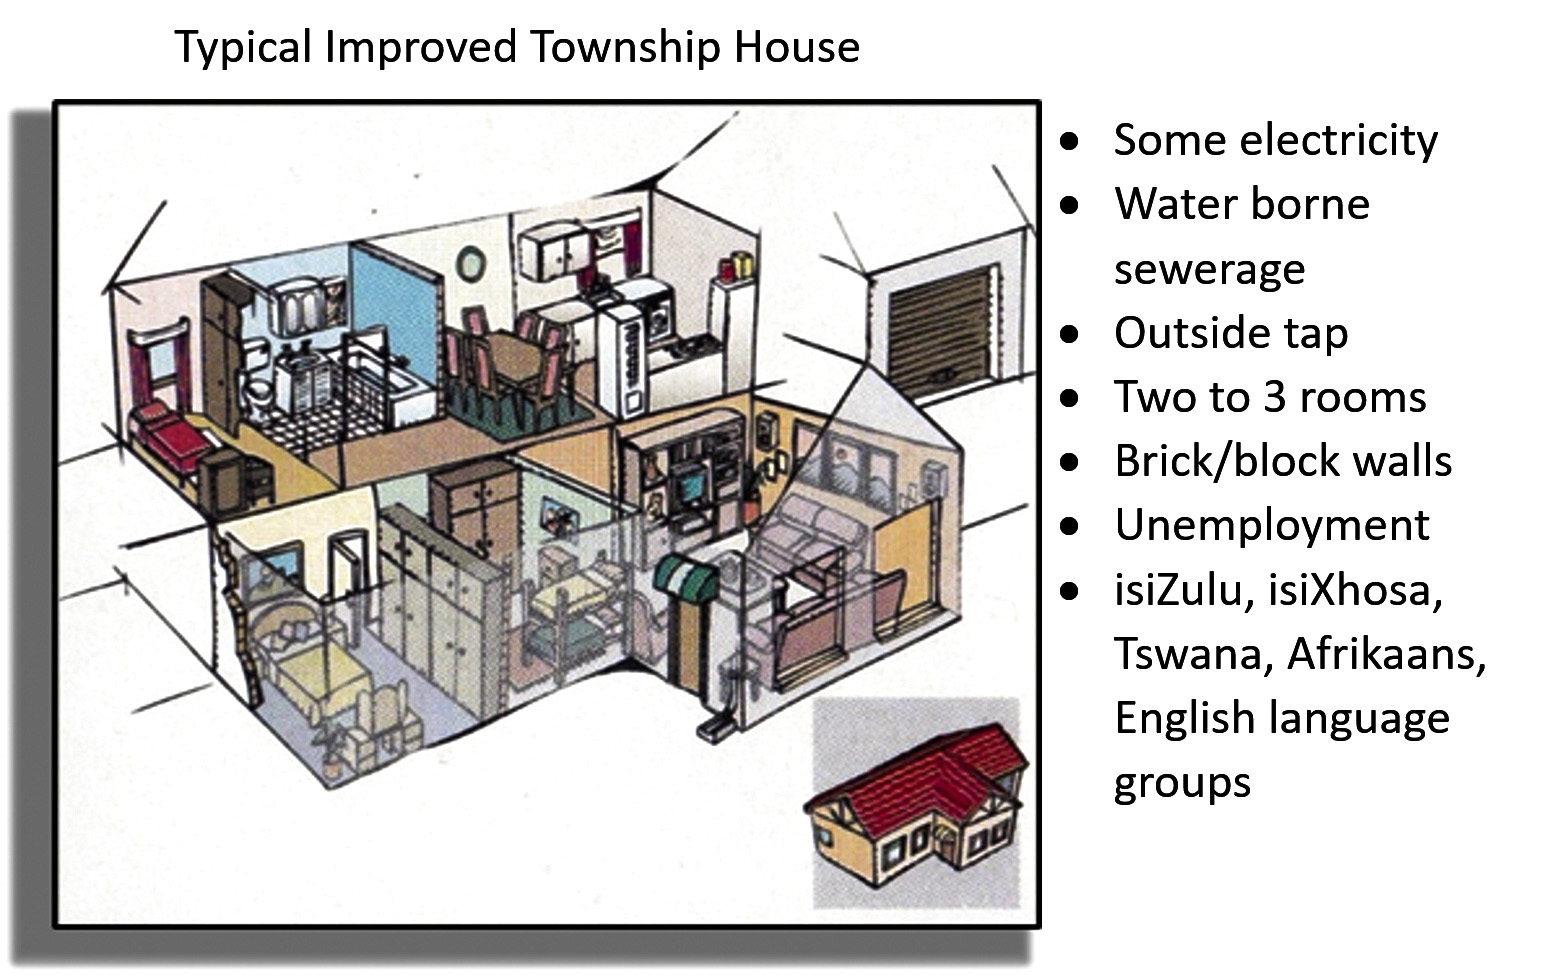 have mushroomed. By mapping townships, it is possible to show how the townships promulgated under apartheid laws have densified and expanded, with
 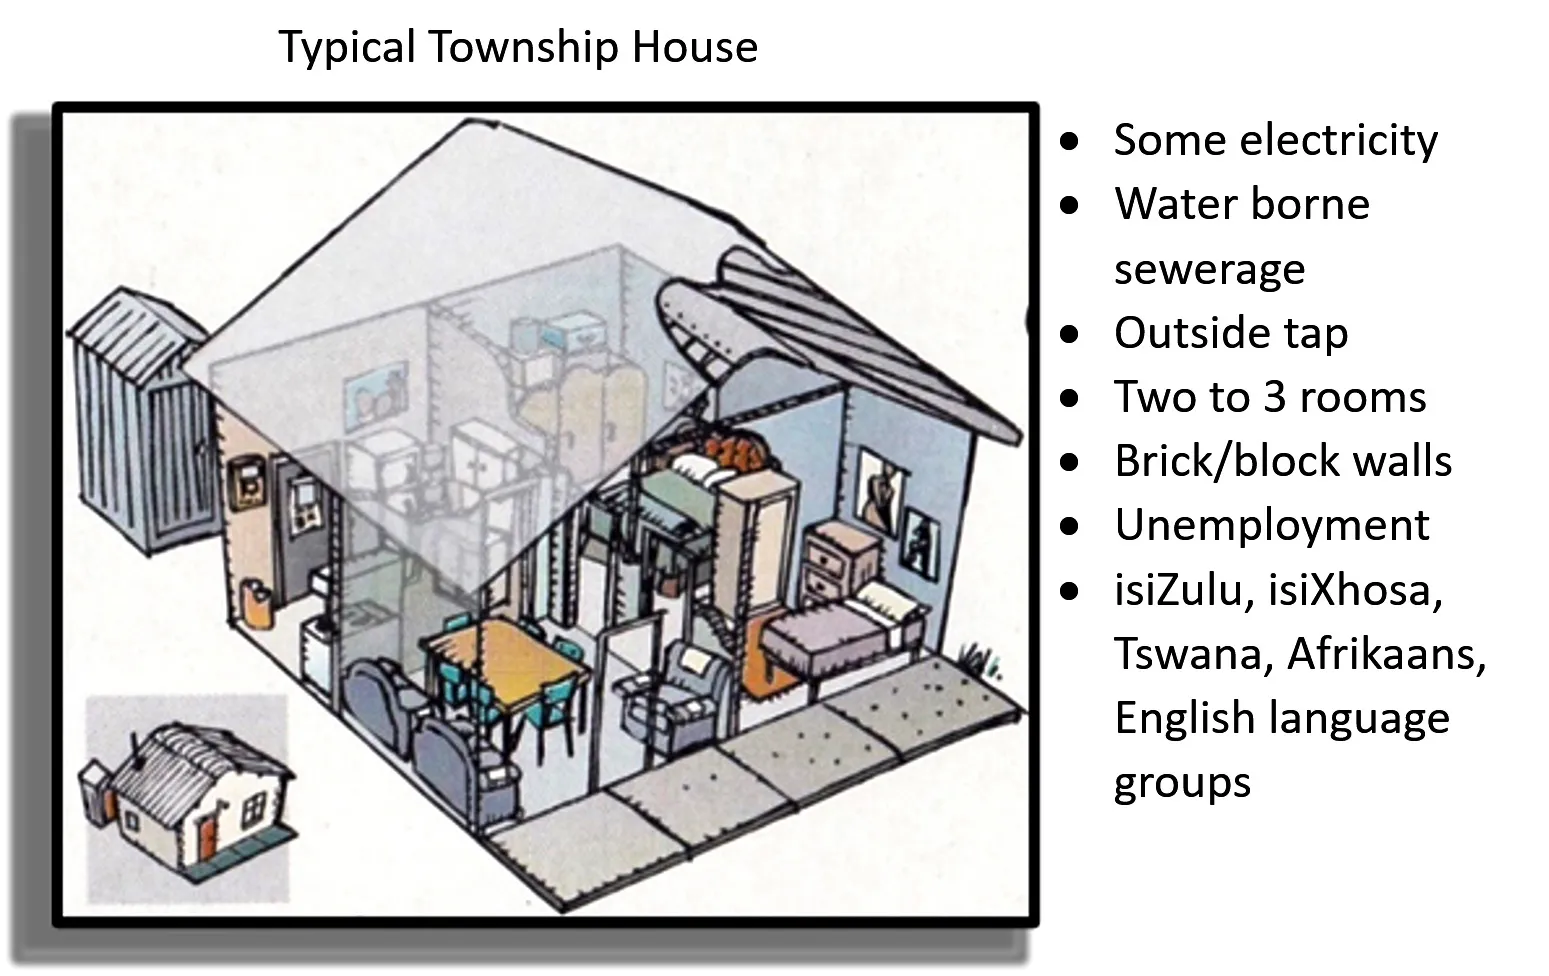 new sections added to some of them.
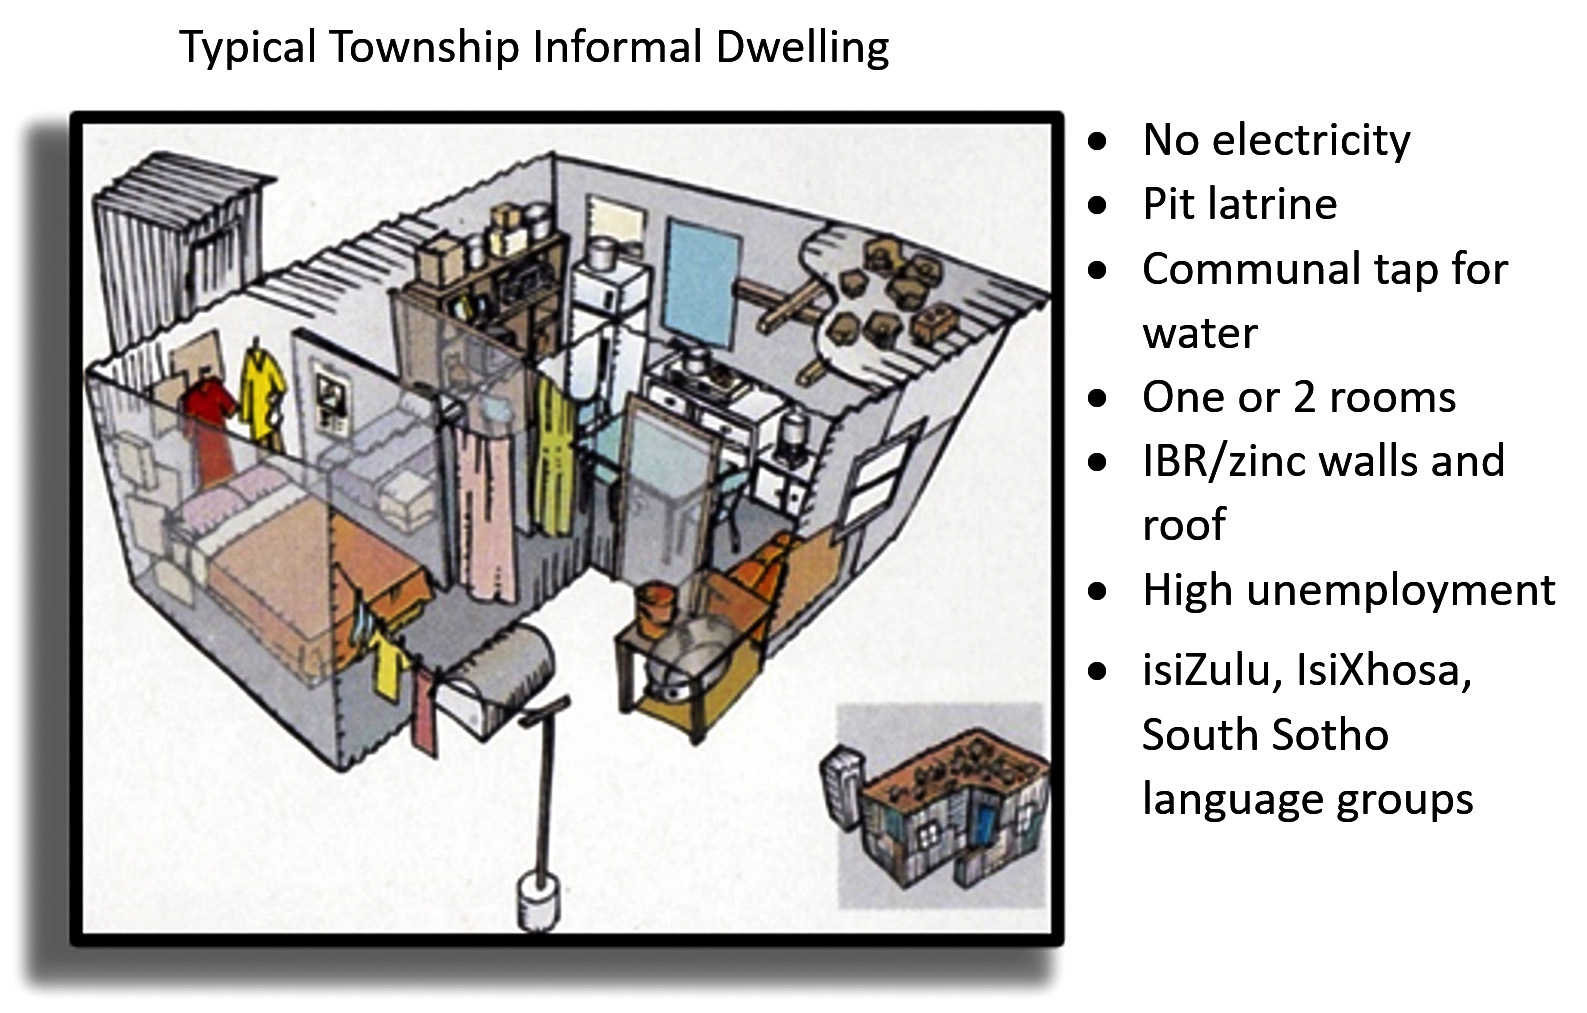
The adjacent schematic illustration in Figure 3 shows characteristics of the housing that has historically been present in townships and remains to this day. The dichotomy of impoverished and well-to-do households existing in the same space is found even within township areas.
Many of the townships are showing a significant increase in the number of upgraded houses and luxury residences. In addition to an understanding of the different types of houses, there is a need to understand the phenomenon of backyard dwellings. The development and evolution of the backyard dwelling phenomenon has had a far-reaching impact on the socioeconomic realities of townships.
The vast majority of backyard structures are on land on which formal houses have been built. Although there are financial as well as security benefits for homeowners to having tenants living in backyard dwellings on their properties, the relationship between the landlord and the tenant can sometimes be quite adversarial. This was discovered in a study of the backyard dwelling landscape in the Royal Bafokeng Nation near Rustenburg in North West.
This growth in backyard structures is common in many townships and not unique to Gauteng. Further analysis was conducted across the country and similar patterns emerged in many townships. However, there are townships and sections within townships where the construction of backyard structures has not occurred.
These findings have significant impact on policy formulation and service delivery, while the backyard dwelling phenomenon has a profound impact on the dynamics of the township itself as well.
Rebuilding supply chains
Both the public and private sectors have a desperate need for information on townships in order to develop policies relating to service delivery and improved planning, as well as for service providers and marketing companies to better understand the needs and aspirations of the population.
With the advent of digital geospatial software solutions and the variety of data available, it is possible to gather data and disseminate it efficiently. The first web-based township opportunity atlas provides a truly comprehensive picture of townships in South Africa.
As the country moves through the stages of lockdown, the effects on the economy are becoming clearer. But as the lockdown slowly eases, there are still many risks lining the path to full recovery, of which a full view is not available at this stage. We are facing a number of “what ifs”. This period marks a critical point for businesses to take proactive steps to assess their supply chains, manage risks, structure an appropriate recovery and innovate with the purpose of ensuring a competitive future.
“One thing that this pandemic has shown us is the central role that well-functioning supply chains play in our society and the benefits of ensuring that they remain [as] intact … as possible,” says Vusi Fele, chief procurement officer at Absa.
To provide service providers with the necessary tools to better understand the distribution of informal traders across the townships of South Africa (also available for other countries in Africa), a web mapping portal displaying the locations of 150,000 fast-moving consumer goods (FMCG) retail outlets across metro and urban areas in South Africa has been developed.
The graph shows the distribution and “hotspot” concentration of the more than 3,000 FMCG retail outlets in the township of Tembisa, on Gauteng’s East Rand, as part of the conceptual product.
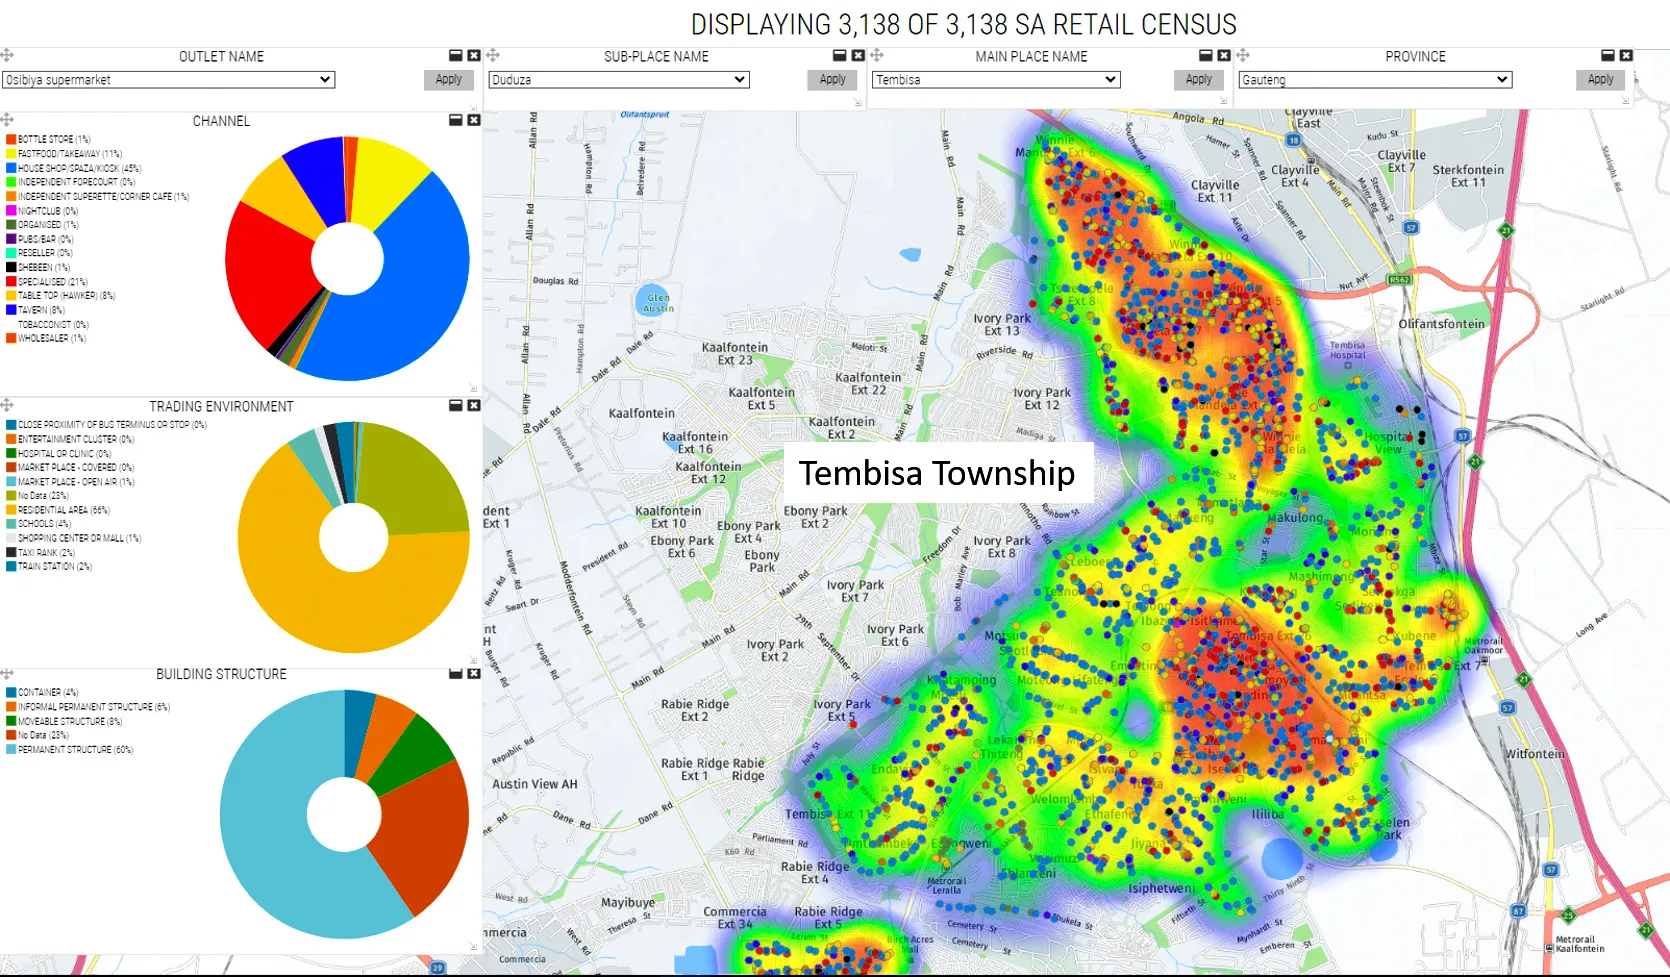 Easy access to this web mapping tool allows multiple datasets and thematic maps to be viewed. Dashboard charts allow summary statistics of specific data on channel type, trading environment, access to services, credit access, banking and product types to be viewed or filtered for easy analysis of the data.
This shows that 45% of the retail outlets in Tembisa are house shops/spazas/kiosks situated in residential areas and with a permanent structure. When it comes to services, 80% have no internet access and 70% have electricity, while 79% are not offered credit by suppliers, 76% are not insured and 42% of the FMCG retail outlets do not bank their revenue.
Using web-based mapping technologies, coupled with powerful datasets, assists in making informed evidence-based decisions for the development of strategies to assist township dwellers. What makes the web-based technology different from what is currently available in the market is that it provides a holistic, integrated and simple solution that is honed to market requirements.
It does not require extensive training, is cost effective and provides a superior user experience, tailored for a wider audience, including government ministry officials, retail planners, property developers, market analysts, planning and consultancy professionals, and business owners of small and medium enterprises.
A qualitative method of visualising survey data, pioneered by AfricaScope and known as circle point thematic maps, allows household survey data sets to be quickly and easily viewed. Using Statistics South Africa’s 2017 survey of employers and self-employed (SESE), a qualitative analysis of characteristics associated with informal businesses across the country at a local level has been done.
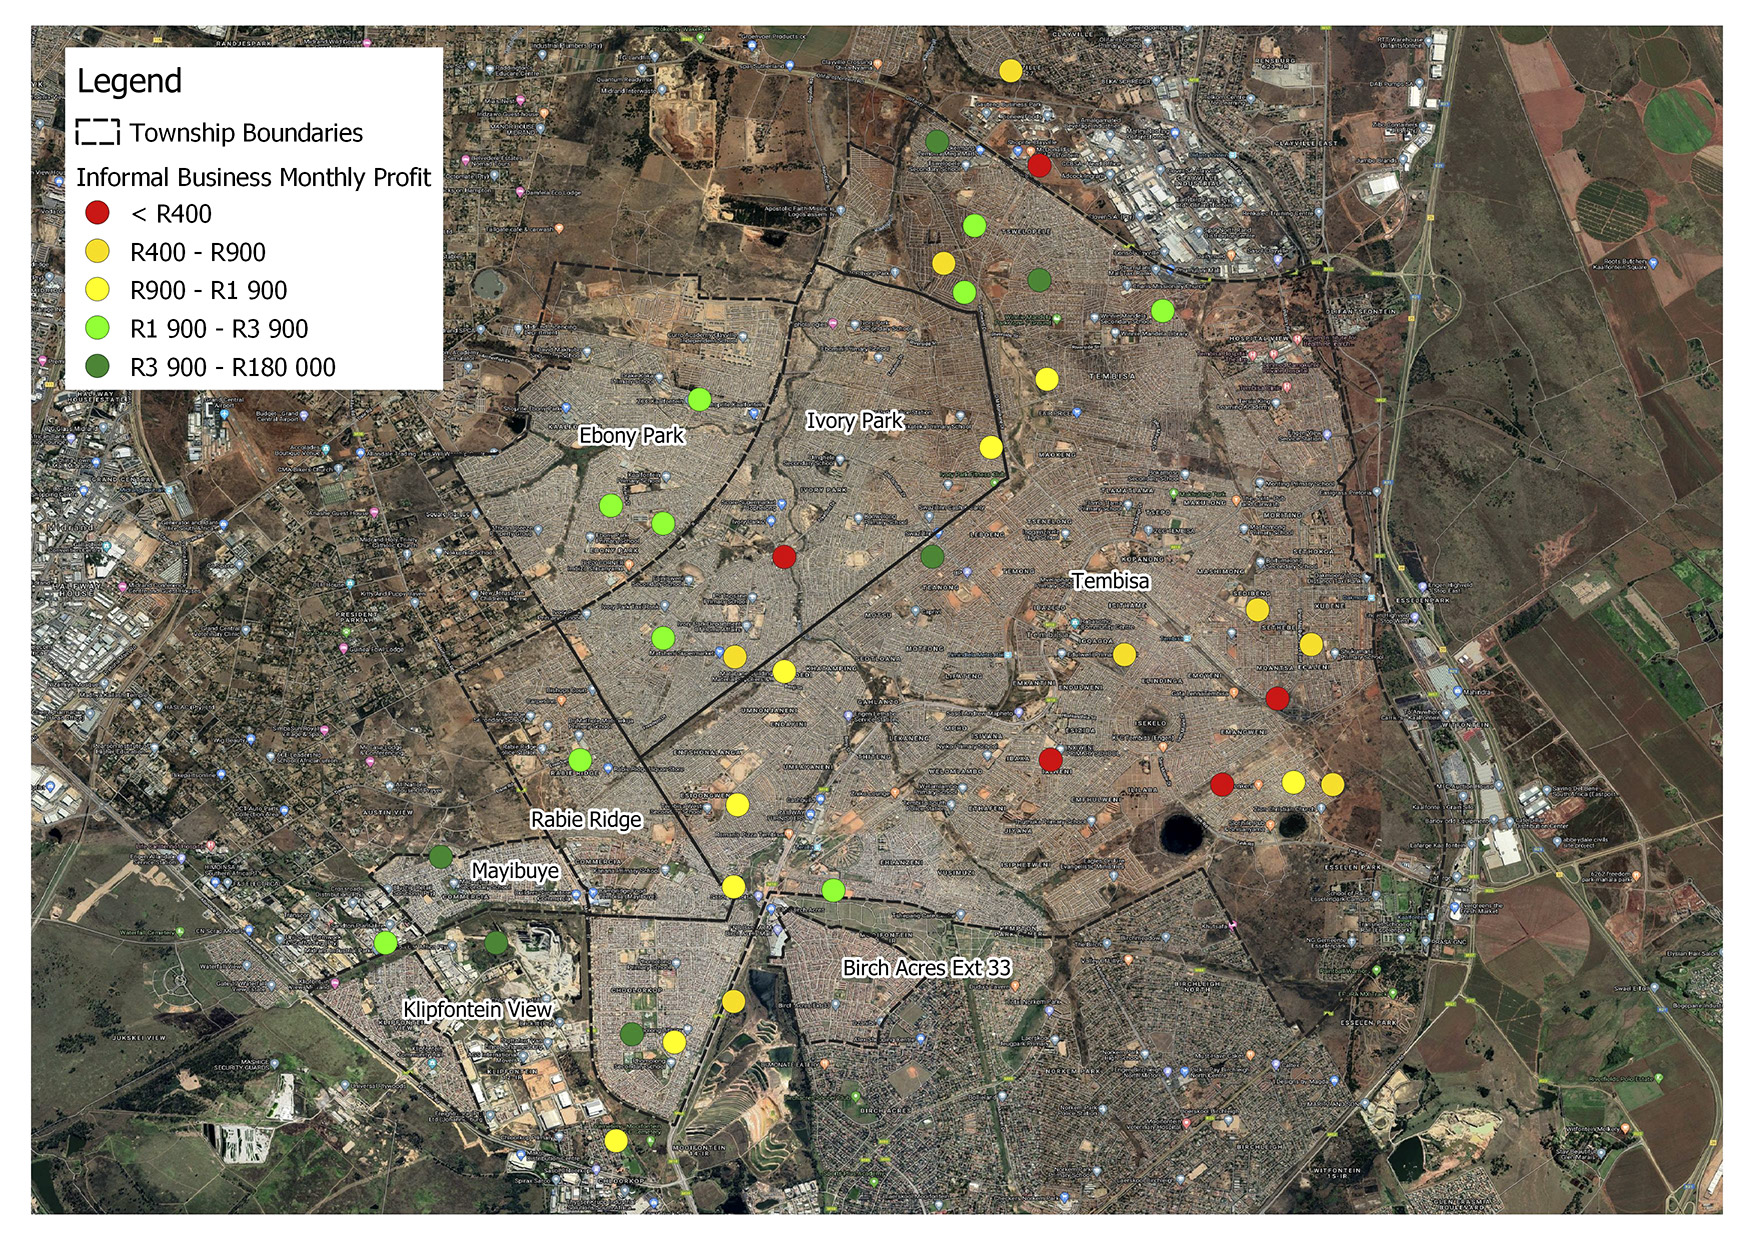
The map below which is an example of a circle point thematic map, shows the locations of informal businesses in townships surrounding Tembisa, whose owners were interviewed. Additional datasets can be overlaid for an integrated analysis and, where necessary, stakeholders can add their own proprietary datasets.
Of the 36 informal businesses in Tembisa whose owners were interviewed, most of those located on the eastern half generated less than R900 profit per month.
Informal businesses located in the central, more developed and established areas of townships, whether in Tembisa, Khayelitsha or Umlazi, generally can generate a higher profit margin. This is the situation in Tembisa with informal businesses located in the central areas having a profit margin of between R900 and R1,900 per month.
It is interesting to note that informal businesses in Ebony Park, Ivory Park, Rabie Ridge and Klipfontein View generate a higher profit margin of between R1,900 and R3,900 per month.
The informal businesses earning a profit of more than R3,900 have an actual profit range of between R4,000 and R22,000 per month. They are often well located in terms of accessibility, are in close proximity to key centres (malls, sports stadiums, commercial and industrial areas), or densely populated residential areas. The top three profit earners are located in the northern part of Tembisa with the highest density of people. They are in the construction, motor vehicle repair and retail trade industries.
Information – the critical tool
There is no doubt that townships will be a critical focus from a social policy perspective and the development of new markets for the private sector in the immediate future. Much has been written about the lack of granular data for townships, but this is now something of the past with the development of the township opportunity atlas. Previous publications have talked about a comparison of South Africa’s townships from a “fastest-growing” and “richest” perspective.
When one understands the history of townships in South Africa, especially in relation to their socioeconomic needs, providing the necessary information for their sustainable development should be the focus, rather than quick profit. Making the necessary information available will also ensure that the potential of townships can be identified to encourage private sector investment in shopping malls, retail outlets, property developments, health facilities and schools.
The atlas provides a holistic view of all 513 townships in the country from a supply, demand, accessibility and consumer perspective. These geospatial datasets have been developed using the most sophisticated neural network and machine learning methods to model, and map the data from social surveys to a local level.
Many of these geospatial datasets are sourced through partnerships with other South African organisations, such as Frontline Market Research, that have completed the FMCG retail censuses for South Africa and many countries in southern Africa.
The Marketing Research Foundation of South Africa (MRFSA) is presently implementing the Media and Product Survey (MAPS) that will for the first time provide the most detailed geospatial data on consumer behaviour in South Africa at a local level and in townships.
Through these geospatial datasets and web technologies in partnership with South African companies and research specialists, the most insightful understanding of townships in the country is possible. DM/MC
Bob Currin is CEO of AfricaScope, an economist and research professional with many years of experience with grassroots policy development. He has studied the townships of South Africa in great depth, has many years of experience in financial inclusion and development, and was part of the team that put together the first township atlas for the country.