Media
‘Data journalism’ draws the line between the quick and the dead
As global newspaper audiences decline, some media organisations are latching onto emerging tools and open-source technologies to make news more relevant, personalised, and 'hyper-local'. Investigative journalism is being reinvented and reporters are doing their jobs in unimagined ways. 'Data journalism' is becoming the competitive differentiator for global news. By MANDY DE WAAL.
When Gordon Patterson released the latest Audit Bureau of Circulation data, there was bad news and more bad news for most newspapers. Patterson expects 2012 to be the toughest year yet. Readerships are declining and fragmenting and, with disposable income levels plummeting in South Africa, consumer decision making was becoming illusive. As if that wasn’t enough to put the owners of Avusa, Napers’ Media24 and Independent in the doldrums, ABC’s circulation data showed more misery for the daily and weekend press.
The aggregated data showed circulation for daily newspapers dropped by 5.1% for the third quarter of 2011, when compared with the second quarter. The bloodletting was slowing marginally, but none-the-less figures were still headed downwards. Except for The Citizen, the worst pain was felt by English dailies, while Afrikaans dailies remained stable and vernacular press showed moderate growth.
Weekend newspapers like Rapport (down 7.33%), City Press (down 6.02%) and Sunday World (down 9.37) didn’t fare much better. Sunday Times also dropped, but at 0.4% this decline was negligible. isiZulu Ilanga Langesonto showed good growth with a circulation increase of 6.45%.
Weekly newspapers, on the other hand, were smiling. Mai l &Guardian continued its growth trend and reported a pleasing 2.56% increase in circulation. Ilanga, the isiZulu weekly published by Independent, spiked by a massive 31.81%, underscoring the rich success of vernacular press.
As the likes of The Star, Sunday World and Sowetan face dwindling readerships, they could be asking themselves: “What are those other newspapers doing right that are we doing wrong?” The obvious answer in a sector where news has become a commodity is there’s little distinction between competitive papers and most of these media brands have lost relevance. As these newspapers flail, there’s a sea of emerging open-source technology freely available to media owners which could help hone content, increase relevance and add value to investigative reporting skills.
But most of the press aren’t even dipping their toes in that water, despite the great interest across the continent in tech tools that enable better journalism, particularly investigative and data journalism. Ghana recently wrapped up an open data and data journalism conference which was welcomed by the state which appealed to reporters to use data to hold public officials more accountable – even as South Africa stares into the barrel of the Secrecy Bill which would do precisely the opposite.
The rest of Africa’s interest in “technology for journalism” is, in part, being stimulated by Justin Arenstein, contracted by Google to help media owners build more robust business models and diversified revenue streams. Arenstein’s helping media improve the quality of content and by showing publishers how better to engage audiences using new technologies.

Justin Arenstein (courtesy of Justin Arenstein)
“A lot of what I’m doing with Google is based on the lessons learnt from the collapse of audiences and the advertising model in the US and Europe. Africa escaped much of that disruption three years ago because of our dismal Internet penetration stats. We are, however, now starting to see some of the same seismic changes in Africa’s mature media markets in SA, Kenya, and Nigeria. The causes are different, driven by mobile and not Internet usage, but the trends and results are the same,” says Arenstein.
Interestingly enough Arenstein was fired from his first media management job at a local newspaper, because he insisted on equal pay for black and white journalists. The former reporter has won awards, set up Mpumalanga’s first commercial radio station and helped establish a number of organisations to support investigative work on the continent. He also built African Eye News Service from the ground up to become southern Africa’s largest independent newswire service and the first rural-based wire agency on the sub-continent.
Recently Arenstein took a year off to explore “data journalism”, “civic engagement media” and “augmented reality” as a Knight Fellow at Stanford University. The sabbatical led to his gig with Google, which sees him earning more than his fair share of frequent-flyer miles.
“There’s a huge range of brilliant open-source and non-Google tools out there just waiting to be used, and we actively help people find them,” he says.
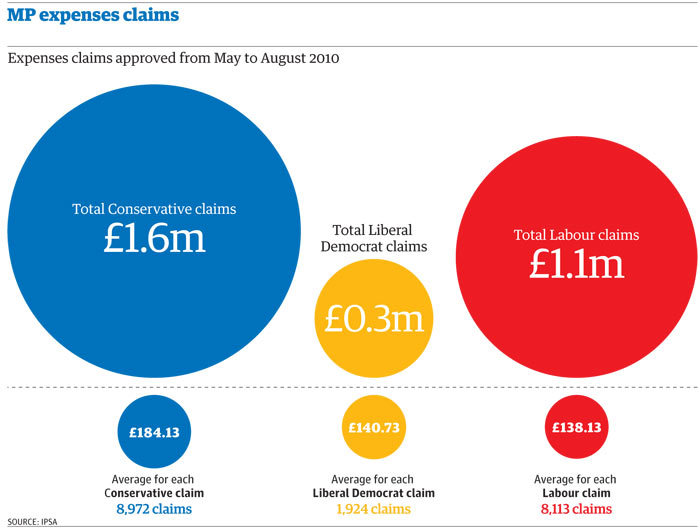
“When the scandal broke about dodgy expense claims by members of the UK parliament, journalists were swamped by almost 500,000 pages of evidence and receipts. Instead of being overwhelmed, The Guardian recruited – or crowdsourced – thousands of volunteers to help their journalists comb through and verify the evidence. Then, they used the new tools for data analysis and visualisation to extract examples, identify trends and to identify conflicts of interest in the data,” says Arenstein.

The Guardian – Data visualisation that illustrates where tax pounds are spent
An astounding 28,800 readers helped review almost 225,000 documents. By involving readers in the investigative phase of the story, and by granting access to the raw evidence, The Guardian built widespread public interest and momentum for a story that has run for well over a year. The media’s focus on the corruption resulted in dismissals, repayments, and a reform of financial management systems in the British parliament.
“But, these new tools are not just great for mobilising readers. They also help journalists do the kind of forensic analysis that we would previously have had to use consultants for. The Guardian’s use of demographic data and mapping to compare the recent public rioting in British cities with poverty data is a good example. The results have helped move the public debate beyond recriminations, to a more informed discussion. Why aren’t we seeing South African media doing something similar with census and other data, to analyse the ongoing service delivery protests?” he asks.
Arenstein concedes there are pitfalls. “Journalists need to be very clear about why they’re using any new tool. Does it add real, tangible value?” he says.
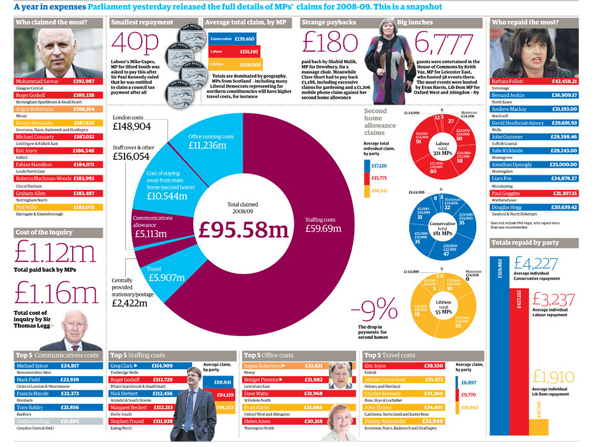
The Guardian – Infographic of MP Expense Claim Scandal which explains how data was visualised
The real challenge is in making information relevant by augmenting narrative reporting with “utility news” tools. With the help of these readers can calibrate decisions on personal issues like where they live to who they vote for. “Every year, the South Africa media devote massive resources and coverage to the national budget, but 99% of the reportage is boring, impenetrable or just plain irrelevant to ordinary citizens,” he says.
The knee-jerk reaction from local journalists, he adds, is often that the data doesn’t exist yet in Africa for this kind of journalism. Or that the technology is too expensive, or that audiences aren’t ready. “This simply isn’t true. South African journalists are sitting on a goldmine of census and other socio-economic data going back decades. We could easily be using property, education, and health information to build things like SinCountyRankings to help people compare lifestyle standards in their cities or neighbourhoods,” Arenstein responds. “Even when the data isn’t perfect, there are free and easy-to-use tools like ScraperWiki and Google Refine to scrape and crunch data, and scores of tools to then visualise or analyse connections between different sets of data.”
A few exceptions aside, South African news media are ignoring the wealth and depth of information available to them because they don’t know how to analyse the data, and aren’t au fait with the tools. Mail & Guardian’s amaBhugane and Andrew Trench’s team at Media24 investigations are among the few local “data journalism” pioneers, and the results are telling. Late last year Trench, together with Jacques Pauw and Julian Rademeyer, broke the news of the ANC’s mining rights grab through its investment front, Chancellor House.
In an environment where so much news that embarrasses the ANC comes from informants, the City Press exposé on the party’s mine grab was a direct result of putting data mining tools to good use. “A couple of months back the department of mineral resources published records of all mining and prospecting right applications in South Africa over the last couple of years,” Trench writes on his blog “Notes from the revolution”.
“As is the habit of SA government departments, the records were published in PDF format which makes them pretty useless for any useful intensive examination of the data.” Fortunately Trench had taught himself Python, a relatively easy, but incredibly powerful programming language. Trench downloaded all the PDF files and created a Python script to enable rapid searches of the documents. Once relevant information was extracted the investigative journalist and his team could start getting a better handle on what was really going on.
When Trench and his team broke the story they reported that Chancellor House, through its Chancellor House Mineral Resources subsidiary, had scored prospecting rights to 560 sites in Northern Cape, North West and Mpumalanga. The lesson here is that the Secrecy Bill’s intention to intimidate whistle-blowers will collapse in on itself as “data journalism” becomes increasingly important to expose hidden connections or connect the dots in a way that’s not immediately evident. Data tools can become an important source for stories if informants start clamming up.
“The building blocks are in place. All it takes is one data journalism project to go viral, and we could see a quantum shift in a very short period. The trick, of course, will be to build business models to support the new approach,” says Arenstein. All the tools are there. Most of them are free. Now what’s required is the will to use them. DM

Read more:
- Andrew Rashbass: ‘The biggest reason we’re successful is that we are lucky’ in The Guardian;
- Alastair Dant on how tech, data and narrative come together at The Guardian at the O’Reilly Radar;
- Data journalism at the Guardian: what is it and how do we do it? At The Guardian’s DataBlog.
Main Image: The Guardian – Infographic of MP Expense Claim Scandal