SPONSORED CONTENT
Inflation, and the importance of investing for growth

Many of us intuitively think that our personal inflation rate is higher than the Stats SA calculated inflation rate. But is it? Paul Hutchinson, Sales Manager at Ninety One, explores the implications.
A colleague of mine came across a clipping from The Citizen newspaper of 1986, which allowed him to investigate price changes in this basket of household goods. While it does not allow for a robust study of inflation (as is the case for the much-quoted Big Mac Index) and is not a representative basket of goods, it does provide some interesting insights and important financial planning lessons.
Figure 1: Product price list from 1986
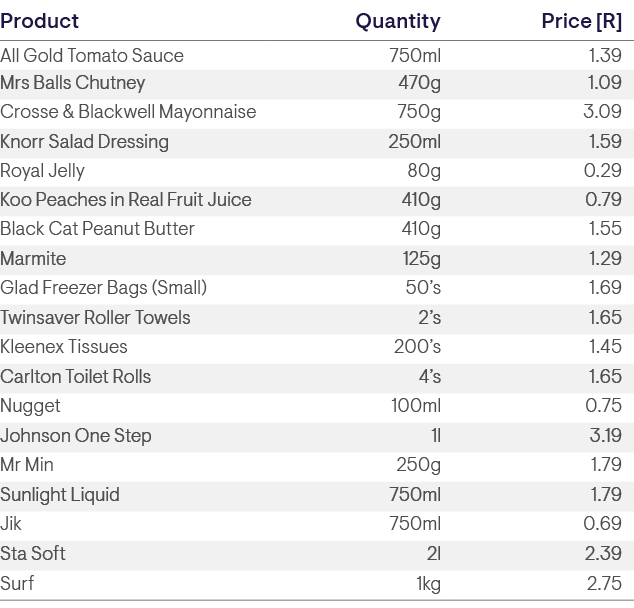
Source: Citizen newspaper, 1986
Many of these items are Tiger Brands’ products, which have not been substantially value-engineered since then. For example, Crosse & Blackwell Mayonnaise still uses the same recipe, and it still comes in a glass bottle. This makes them good products to analyse over time.
To begin with, we charted South Africa’s official inflation rate, indexed to 100 in 1986 (be afraid, very afraid). The following chart shows just how insidious and corrosive inflation is over time. In short, if you were earning R10 000 a year in 1986, just to keep up with this official inflation rate, you would need to be earning R150 000 today!
Figure 2: South African inflation rate – 1986 to date
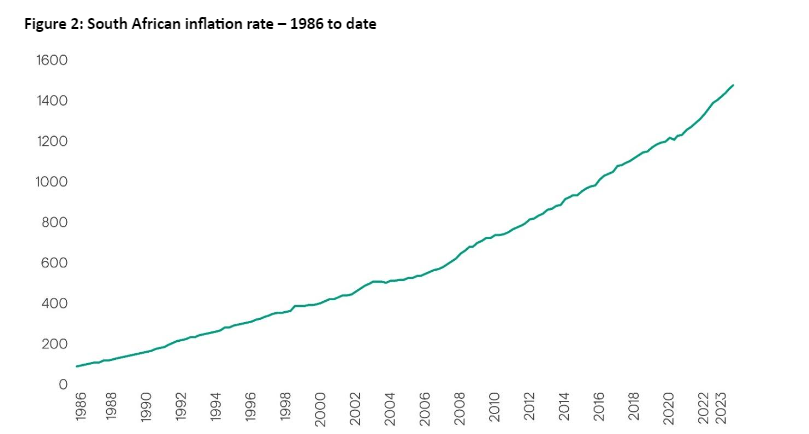
Source: Stats SA and Ninety One calculations.
Inflation averaged approximately 7.5% per annum over this period. So how then does the change in the prices in the clipping above compare?
In the following table, we compared the respective product price from 1986 to the current price, and then calculated the annual compound change from 1986 to current: In short, the average annual increase of 9.1% of this household goods’ basket is above the official annual inflation rate of 7.5% over this period. So, our intuition that our personal inflation rate is higher than what the official Stats SA inflation rate would suggest does not appear to be so far off the mark.
Figure 3: Change in price of a selection of household products – 1986 to current
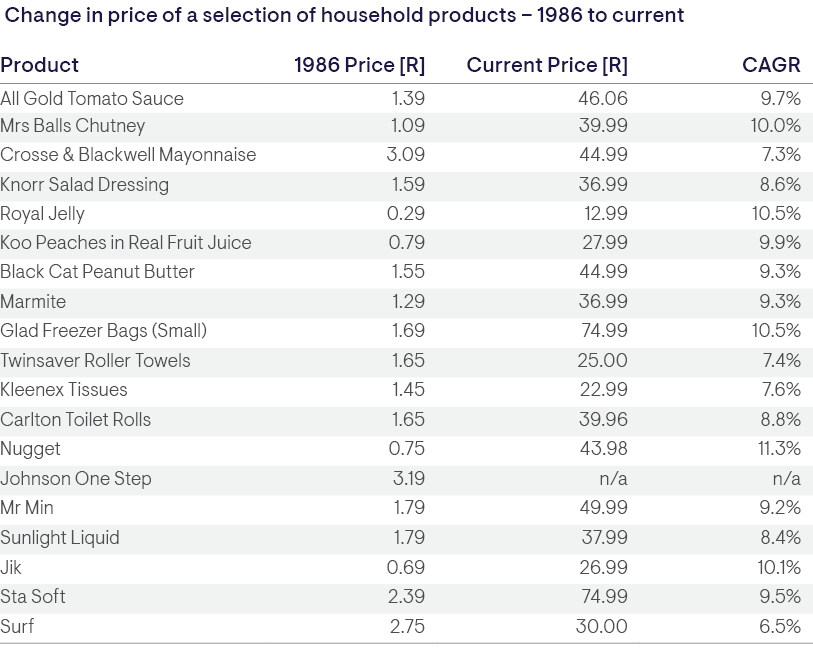
Source: Citizen newspaper, 1986 and Ninety One calculations.
Critically, this difference is material over the long term, as illustrated in the following chart. The chart shows that just to keep up with the increase in the household goods’ basket you need to now be earning around R260 000, not R150 000 as you might have initially thought (be more afraid)!
Figure 4: South African inflation rate versus that of a basket of household goods; 1986 to date
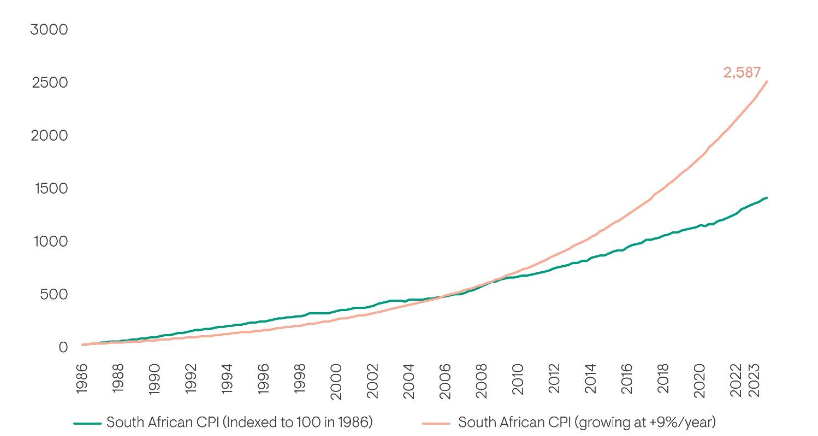
Source: Stats SA and Ninety One calculations.
However, whether your personal inflation rate is lower than, similar to, or above the official rate is not as material as investing for growth.
What then does this mean for investors?
The above analysis reinforces the key insight that hiding in cash or cash plus / enhanced cash / income-yielding investment solutions is not a sustainable long-term investment strategy (in fact, I have seen this referred to as ‘reckless conservatism’).
This is a critical observation, given that investors underestimate for how long they will be invested. Simply, if you consider someone entering the workforce today, it is reasonable to assume that they have a 70- to 75-year investment time horizon (40+ years’ of investing for retirement and then 30 years’ of living off their accumulated investments in retirement).
While this is an extreme example, even someone mid-way through their working career realistically has a 40- to 50-year remaining investment time horizon. And unfortunately, underestimating your investment time horizon often results in investors being too risk-averse about what should be viewed as long-term investments.
At the same time, investors need to target material outperformance of inflation, noting that all CPI+ benchmarked funds are benchmarked to the Stats SA-calculated inflation rate, not our intuitive inflation rate. Therefore, a growth-oriented investment solution is best suited for investors looking to ensure a comfortable and sustainable retirement. This is because it is through investing in growth assets that you can confidently generate attractive real returns over the long term after tax and inflation. An example of this performance is illustrated in the following graph of the track record of the Ninety One Opportunity Fund, which targets a return of inflation plus 6% per annum over rolling 5 years, and no negative returns over rolling 24 months.
Figure 5: Cumulative performance of the Ninety One Opportunity Fund
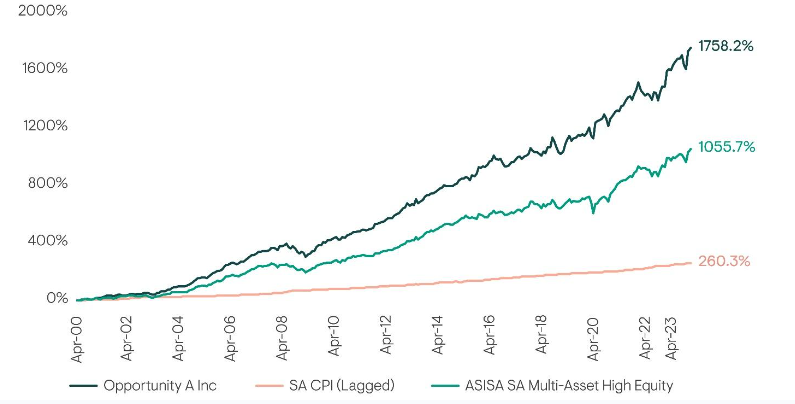
Source: Morningstar, dates to 31 December 2023*
We are confident that investors will be rewarded for taking on risk, particularly from high-quality global equities and select South African equities that generate the bulk of their earnings offshore, and therefore are not reliant on domestic economic drivers. At Ninety One, we maintain a balance of exposures that blends the best of growth assets with the income on offer from defensive assets, while generating inflation-beating returns over the medium to long term.
*Past performance is not a reliable indicator of future results, losses may be made.
These performance figures above are based on lump sum investment, NAV based, inclusive of all annual management fees, gross income reinvested. Initial charges are not applicable to this fund. Fees are not applicable to market indices, where funds have an international allocation, this is subject to dividend withholding tax, in South African Rand.
Inception date 28 April 2000.
Annualised performance is the average return per year over the period. Individual investor’s performance may vary depending on actual investment dates. Highest and Lowest returns are those achieved during any rolling 12 months over the period specified. Since inception*: Jul-05 43.8% and Feb-09 -15.7%
The Fund is actively managed. Any index is shown for illustrative purposes only. DM/BM