


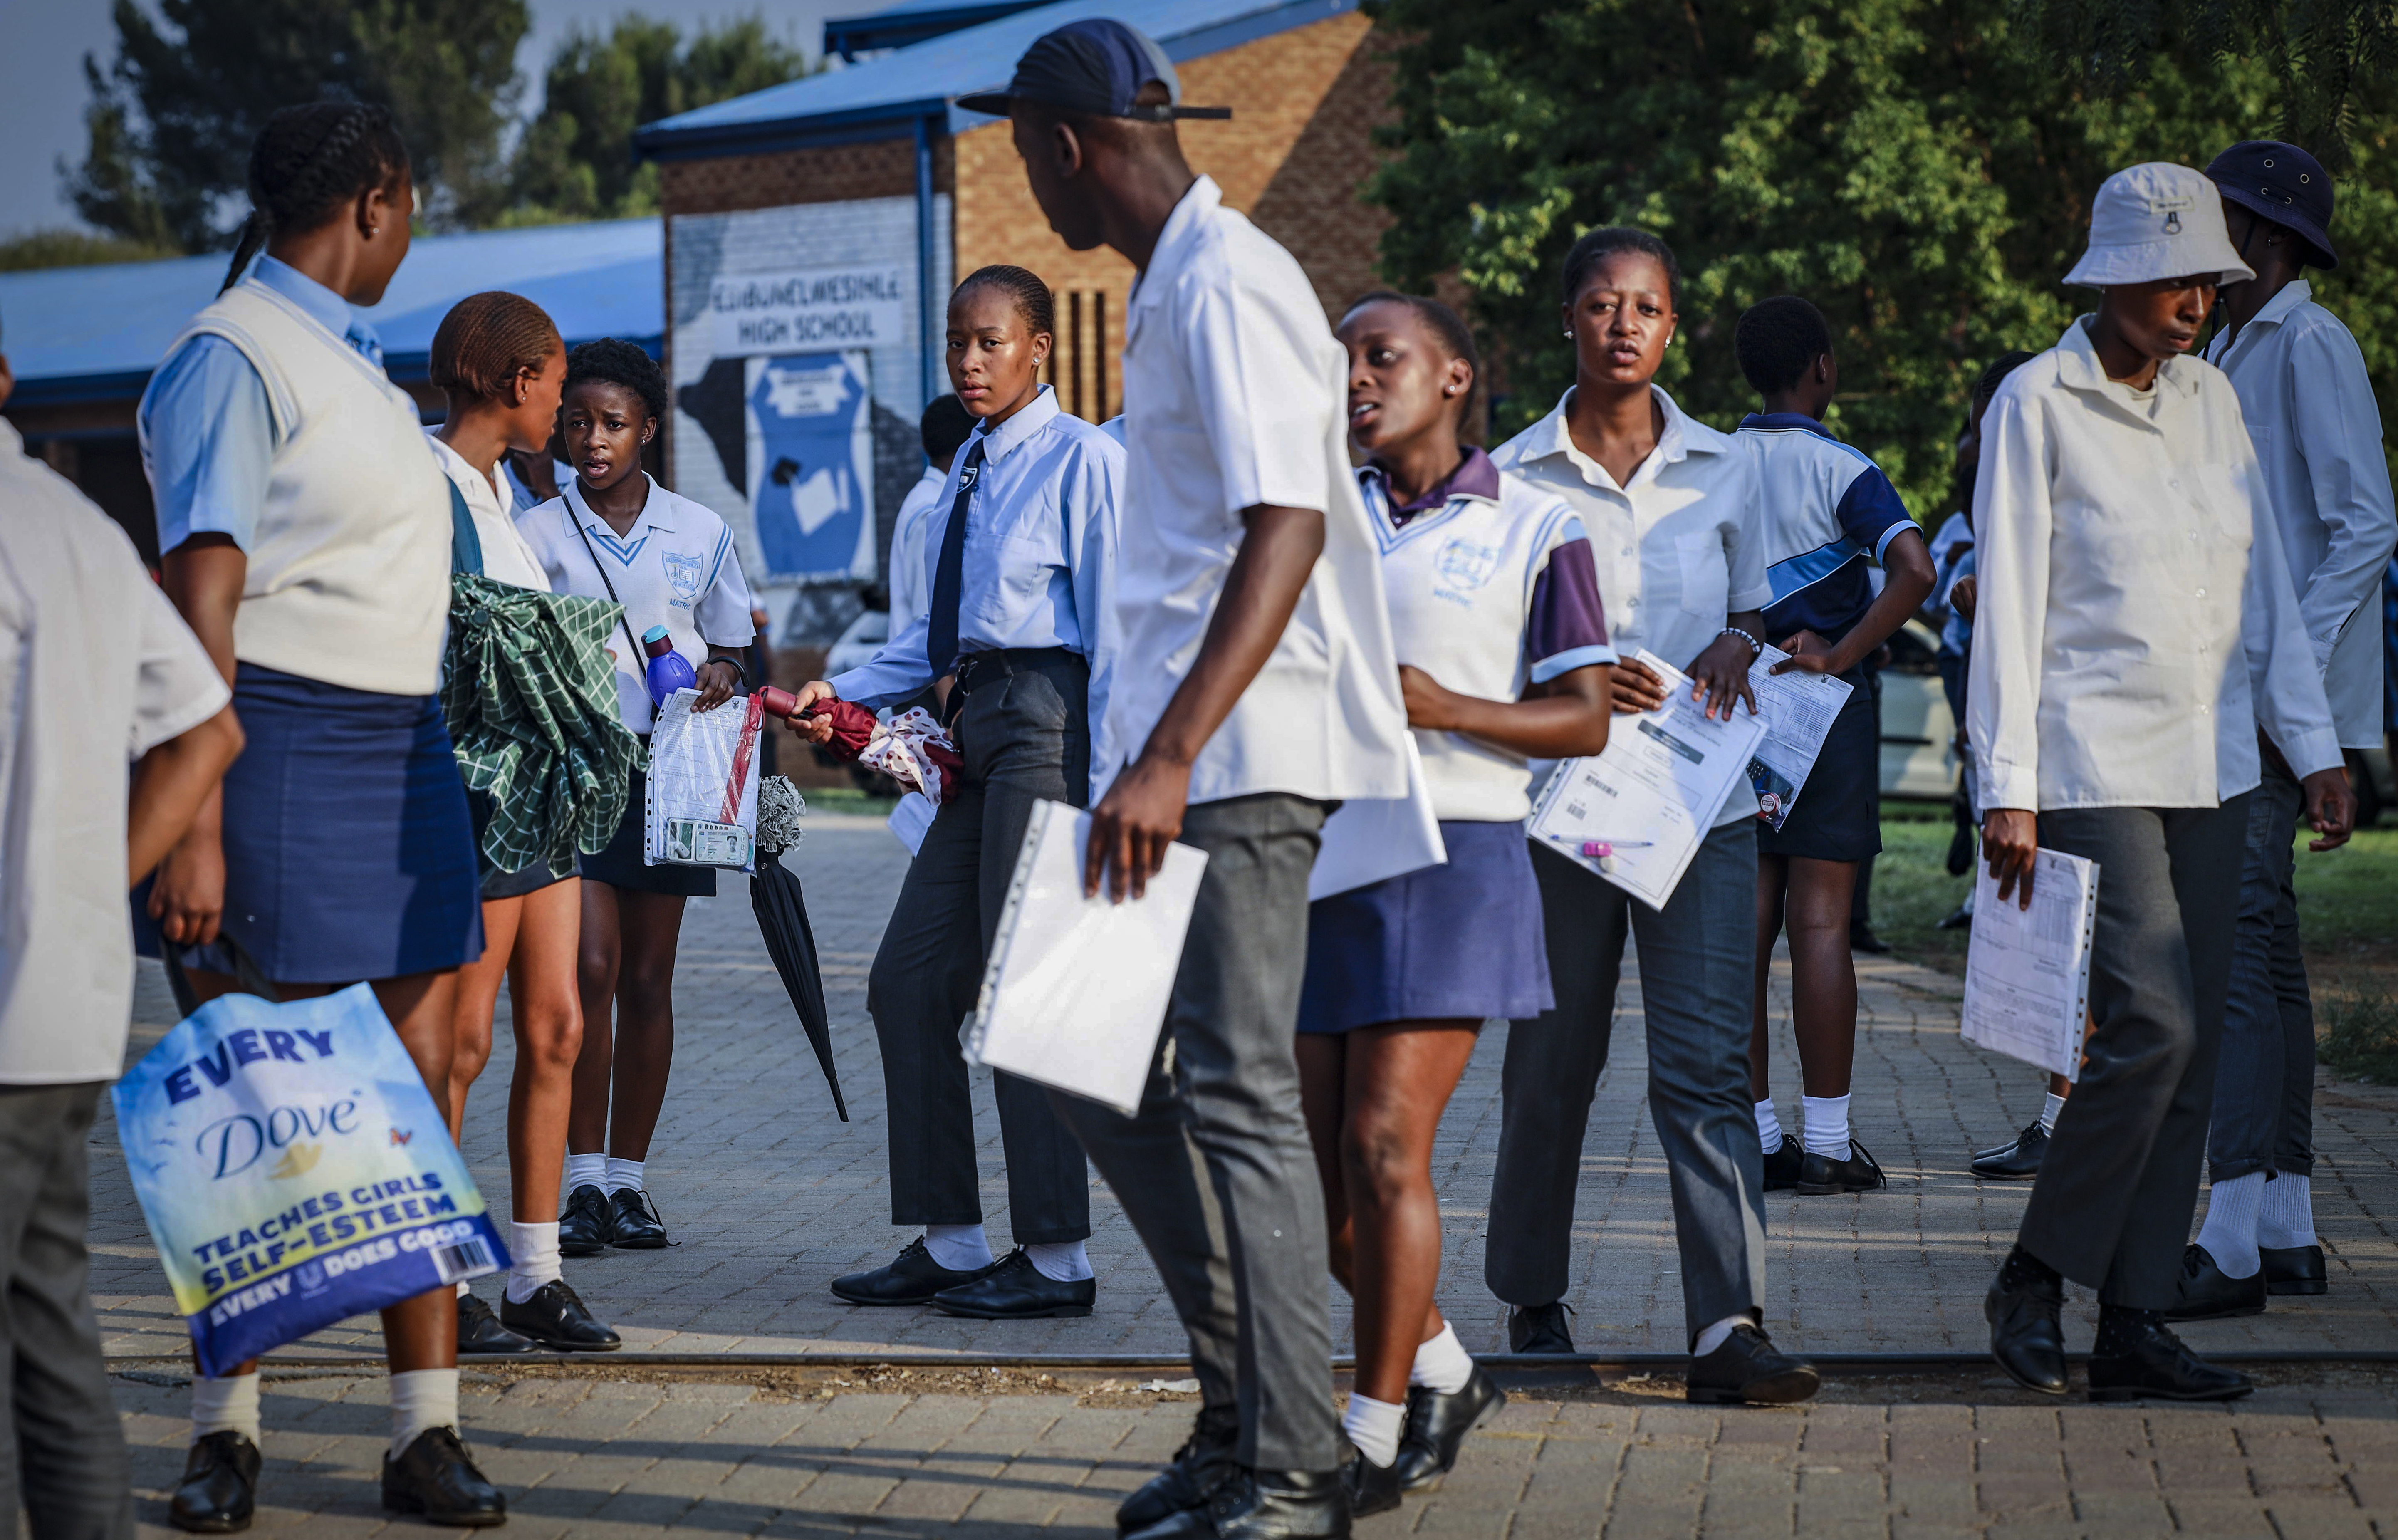
 Matric pupils after writing the English Paper Two exam at Esibonelwesihle High School in Duduza on the East Rand on 23 November 2023. (Photo: Gallo Images / OJ Koloti)
 In Part 1 we outlined what is new about the Class of 2023 matric results. We explained that there is now a basket of indicators that the Department of Basic Education (DBE) now uses to report on matric.
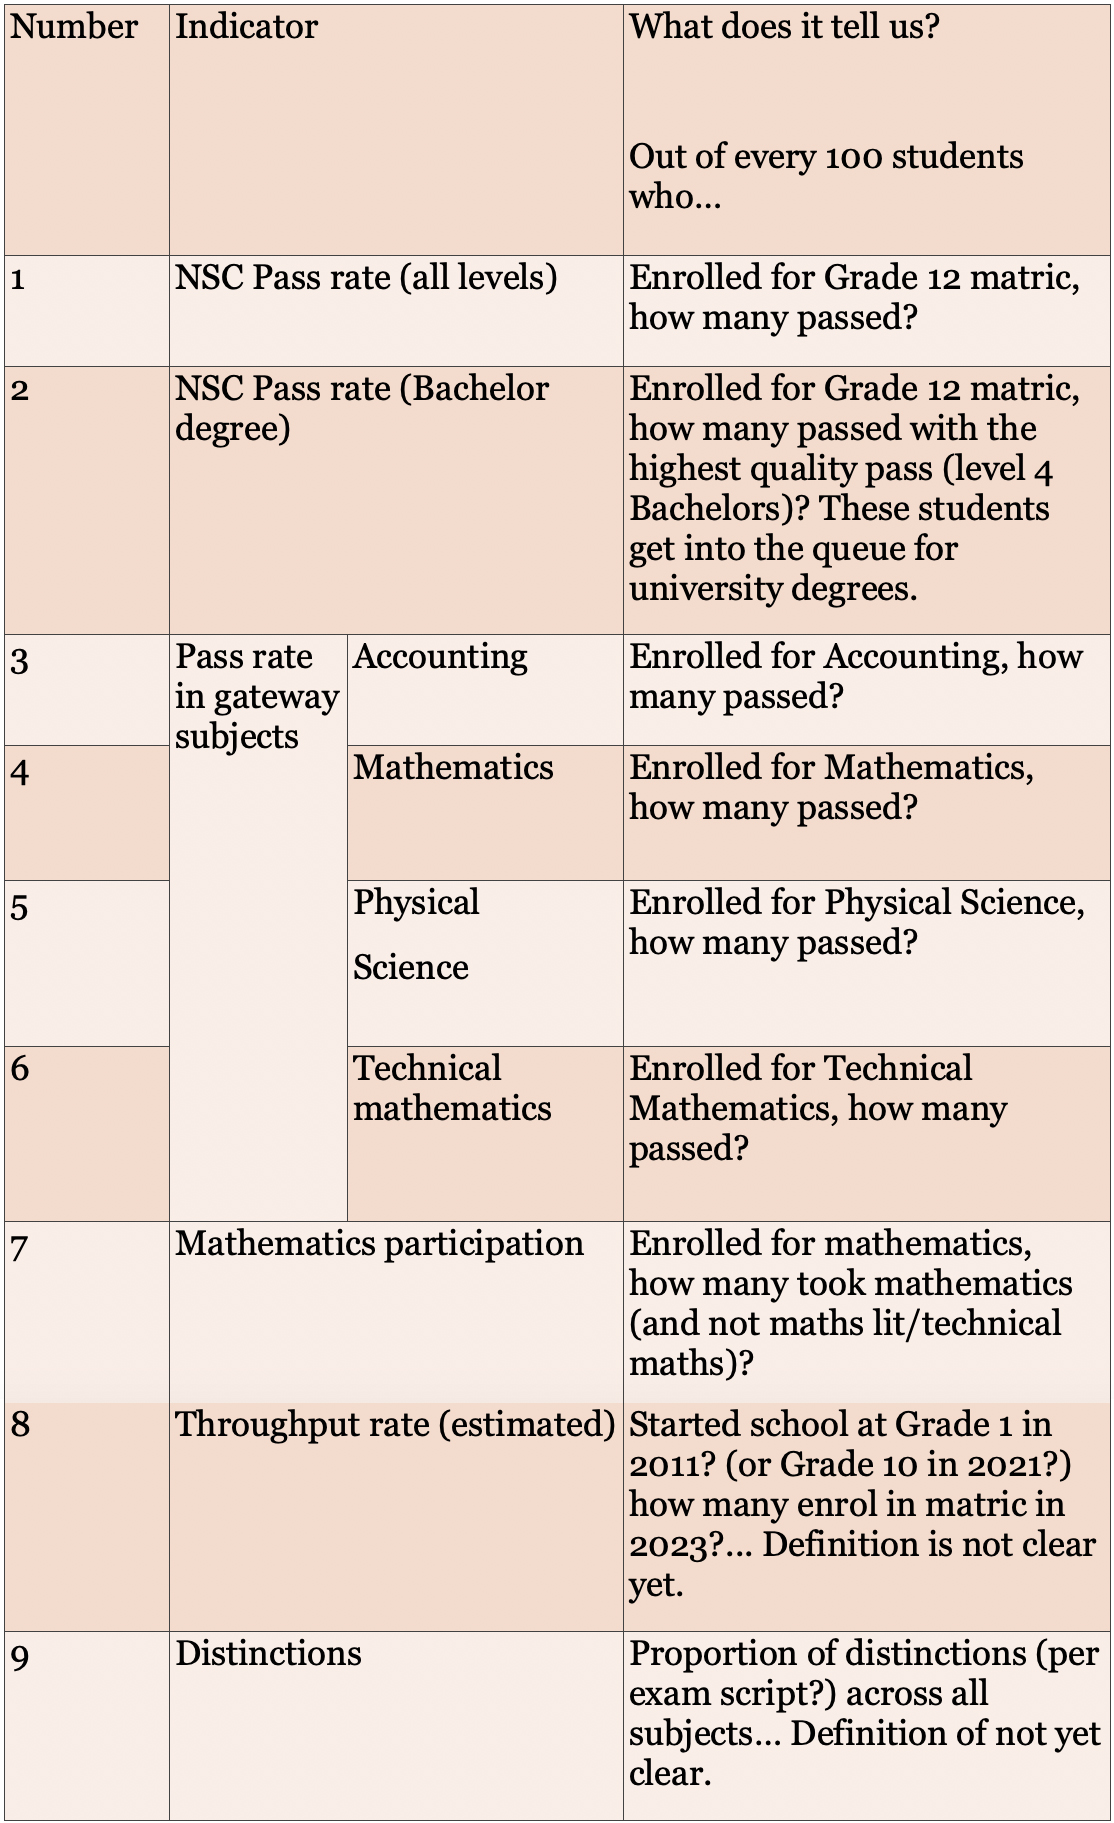
We add in two additional indicators which we think are important.
We report on the proportion of pupils passing (10) mathematics and (11) physical science at the 50%-and-above level. This indicator is important for measuring quality passes in critical skills areas, and relates to access to STEM careers at university level. The DBE has reported on the numbers of pupils obtaining 60% and above in these two subjects.
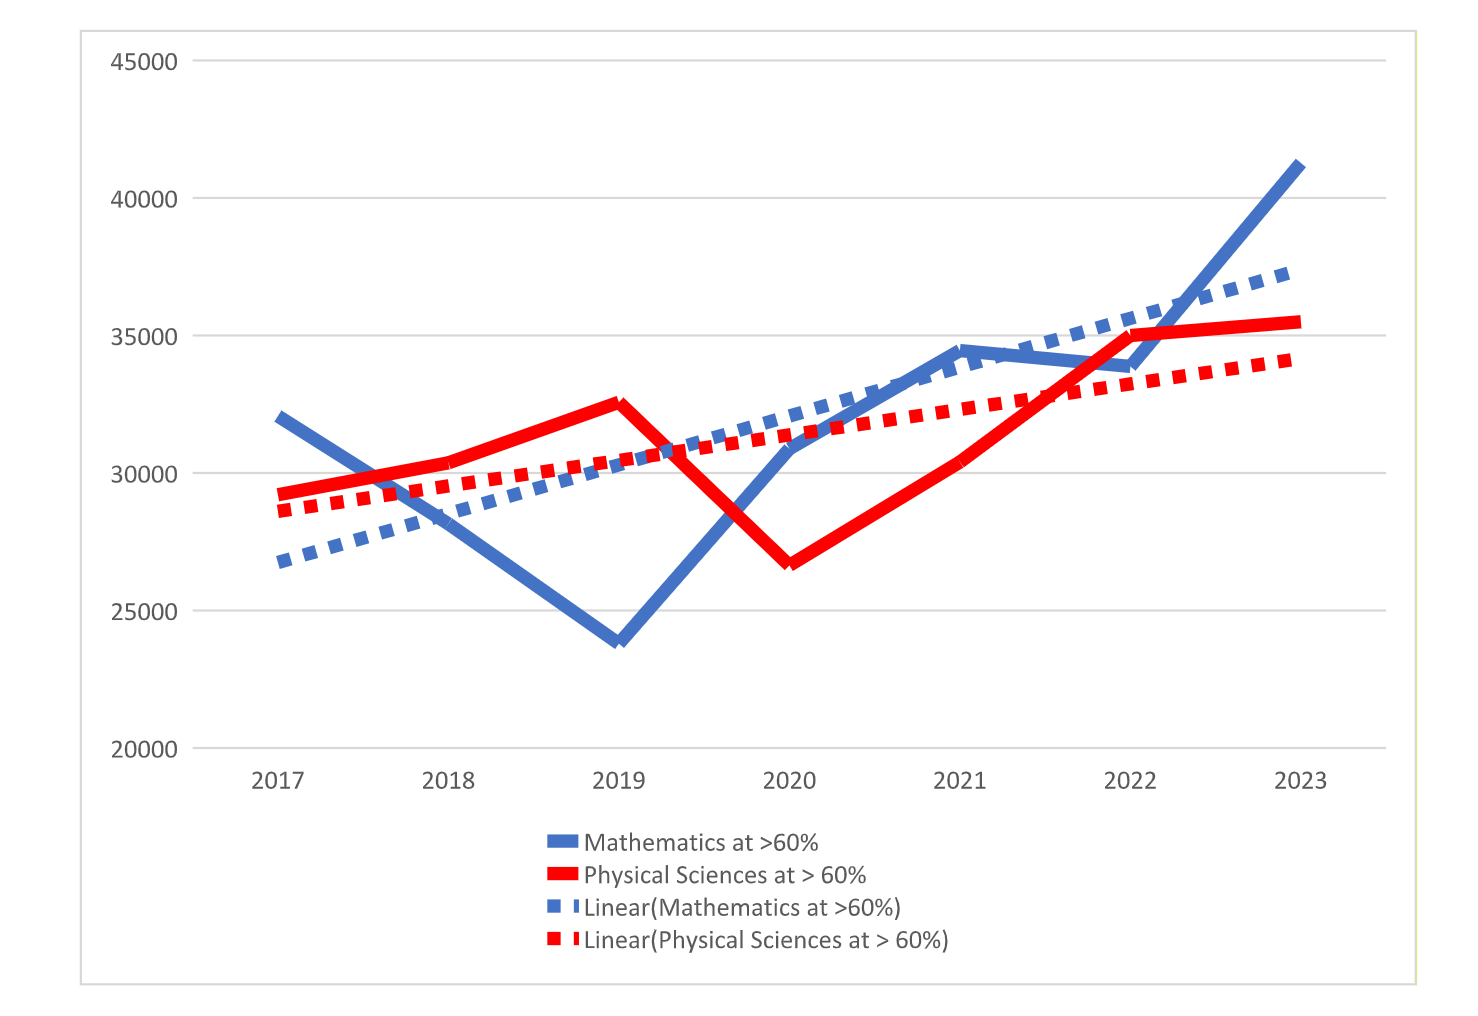
We can see an improvement trajectory from 2017 to 2023 for both subjects. In addition, the DBE has indicated that in future the proportions at 60%, 70% and 80% will also be reported on, since these thresholds inform university entry requirements. Even the annual targets have changed! We welcome this move.
Finally, we report on (11) the proportion of quality passes (bachelor’s degree level) which come from no-fee schools. This shows us whether schools in poorer communities are getting the support they need to contribute meaningfully to the overall education outcomes. This is a key indicator of equity and redress.
Because at least 60% of schools are no-fee schools, we would expect to see the majority of quality passes (at bachelor’s level) coming from these schools. Where this is not the case, there are serious concerns about the type of support offered and the resulting quality of learning taking place in the no-fee environments.
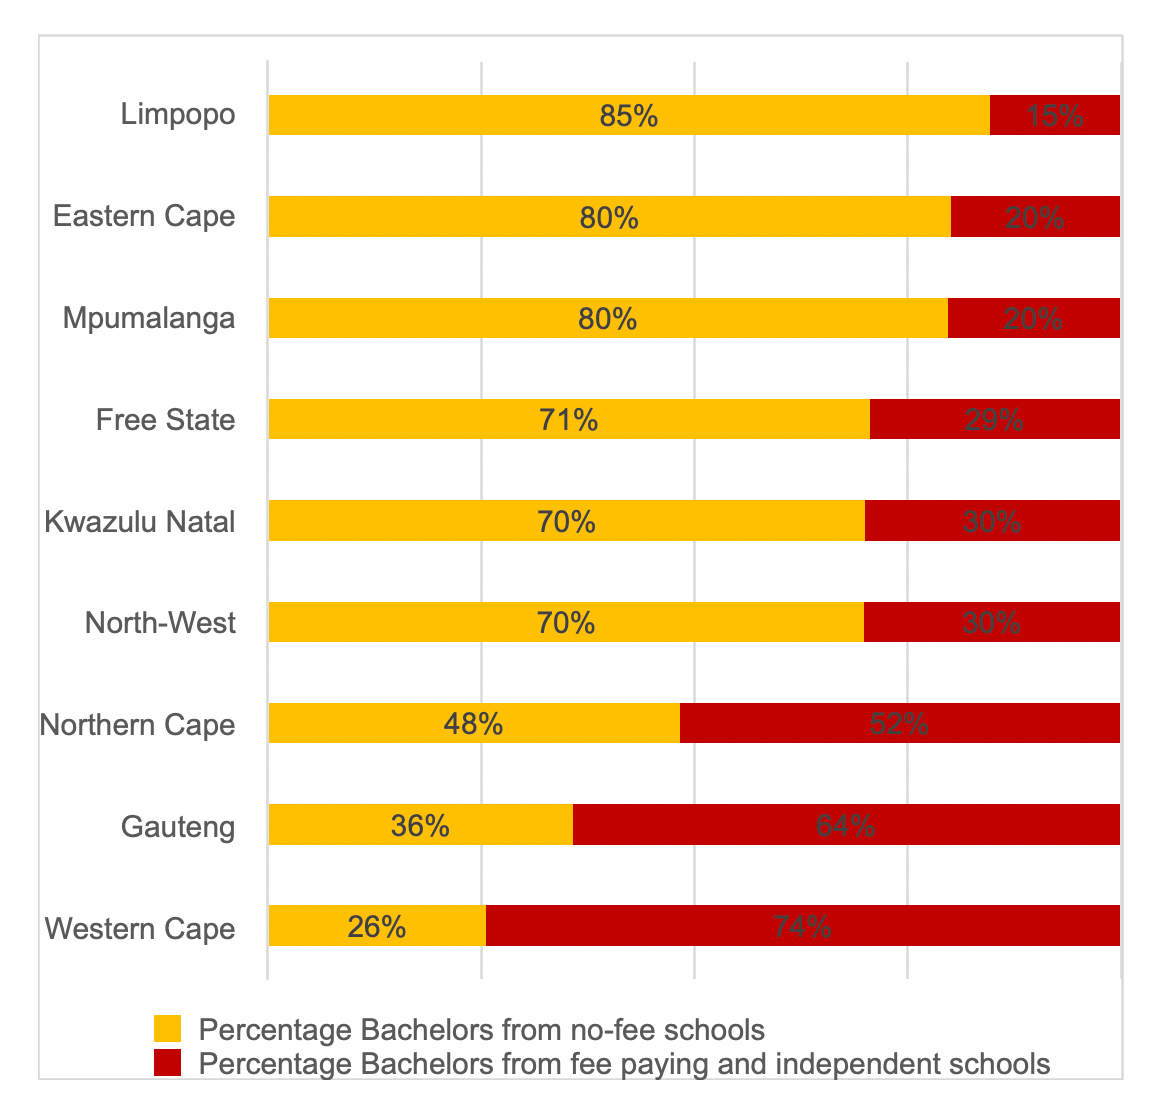
These additional indicators have been derived by the authors from data given in the same DBE NSC examinations report. The proportion of bachelor’s passes from no-fee schools is calculated as “bachelor’s passes from no-fee schools” divided by “the sum of bachelor’s passes from fee-paying and independent schools”.
We take note of two important groups at the national level. Of the 5,458 pupils with special education needs enrolled for matric, 4,581 passed, obtaining 2,701 distinctions. In addition, 137 of the 147 full-time matric pupils at correctional services centres passed matric, with 90 obtaining a bachelor’s pass.
We now present the report cards for each province for the Class of 2023. By comparing provinces to each other on all indicators, we can comment on their relative performance. We use this key:
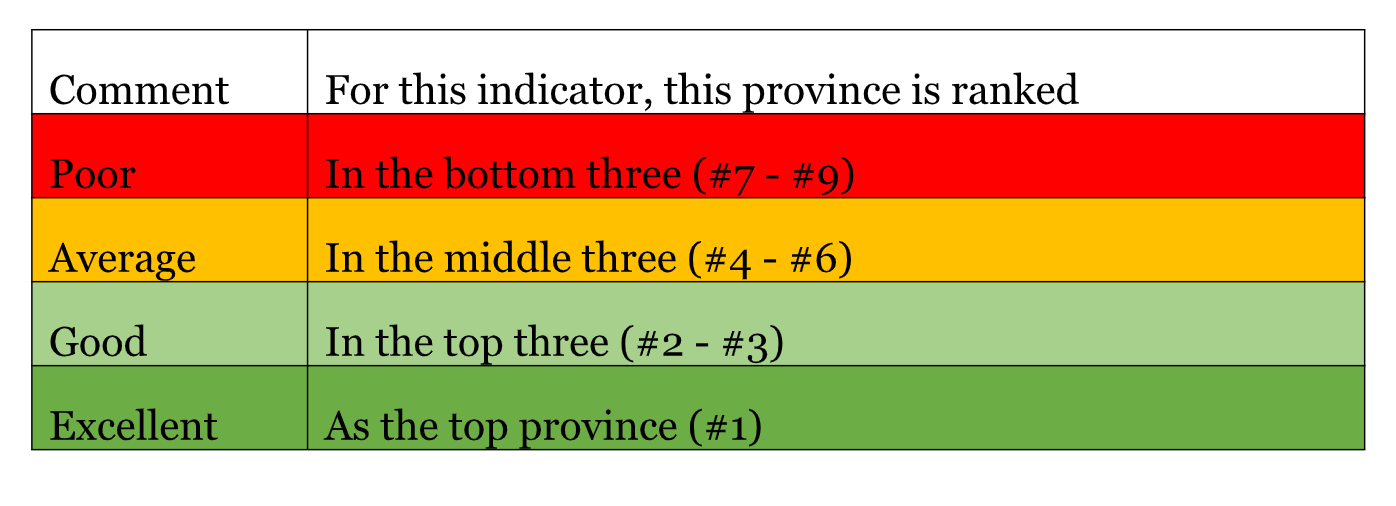
In many cases the differences between provinces are marginal, so four categories are more than adequate.
Eastern Cape: MEC Fundile Gade
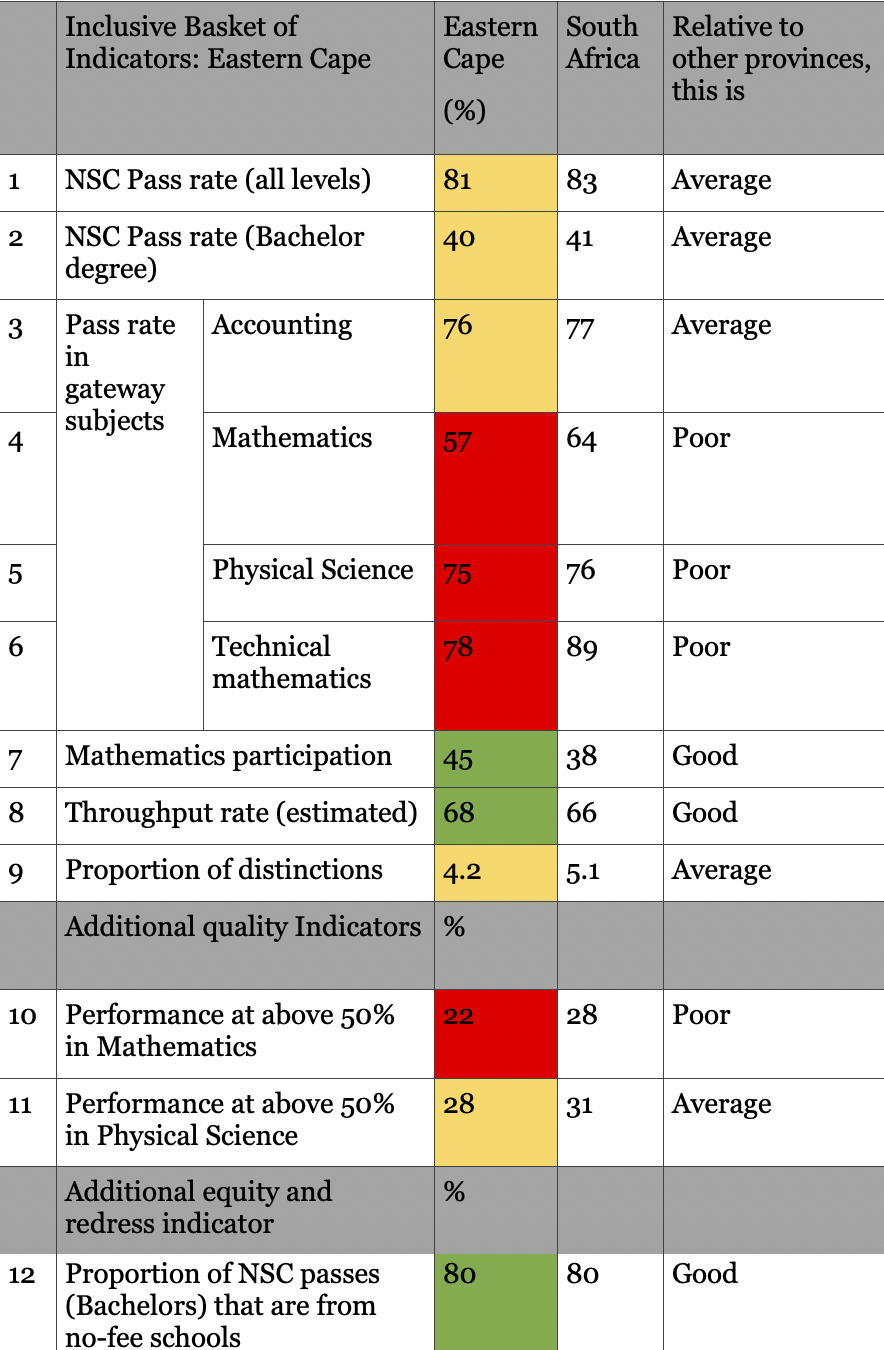
The Eastern Cape has 95,600 pupils enrolled for matric, and 81% of them passed. The province comprises 14% of the national pupil enrolment and contributes 14% of the quality (bachelor’s level 4) passes. It is a rural province with a significant history of poor education outcomes in former Bantustan schools. It has trialled an ambitious isiXhosa mother-tongue intervention which is showing promise and looks set to influence national language policy.
The Eastern Cape has done well in encouraging pupils to choose mathematics. However, this is not yet converting into quality maths passes. Quality passes in physical science are also lagging. Throughput looks pleasing. Where the Eastern Cape does excel is with regard to equity and redress. The fact that 80% of the quality passes (bachelor’s level) come from no-fee schools is commendable and cause for celebration.
Free State: MEC Mokale Mohale
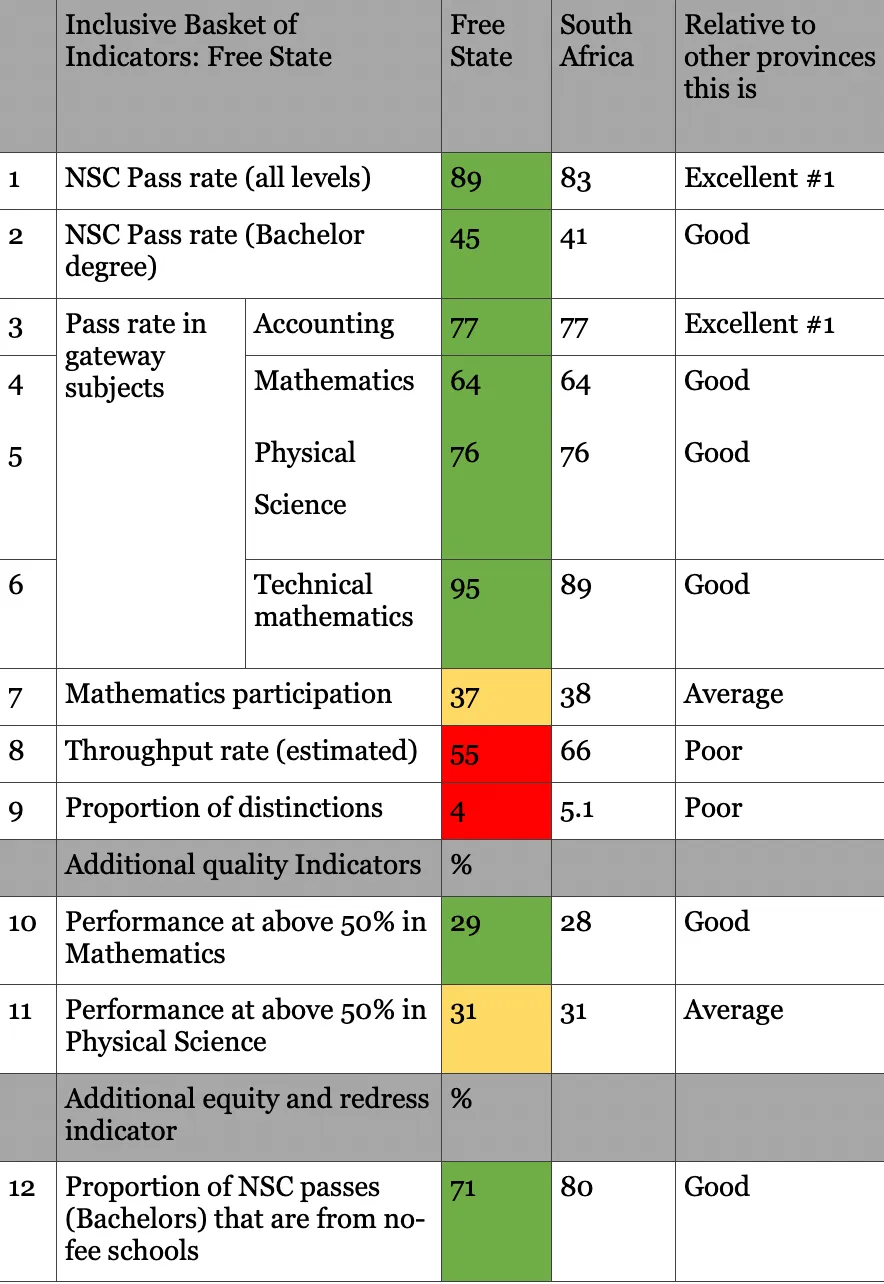
The Free State has about 34,000 pupils enrolled for matric, and 89% of them passed, making it the top province for passes. The province comprises 5% of the pupil enrolment and contributes 6% of the quality (bachelor’s level 4) passes. The Free State punches above its weight, and is in the top three provinces for eight of the 12 indicators.
The Free State has done well in encouraging pupils to choose mathematics. However, this is not yet converting into quality maths passes. Quality passes in physical science are also lagging. Throughput looks pleasing. The province does well with regard to equity and redress. The fact that 71% of the quality passes (at bachelor’s level) come from no-fee schools is above average.
Gauteng: MEC Matome Chiloane
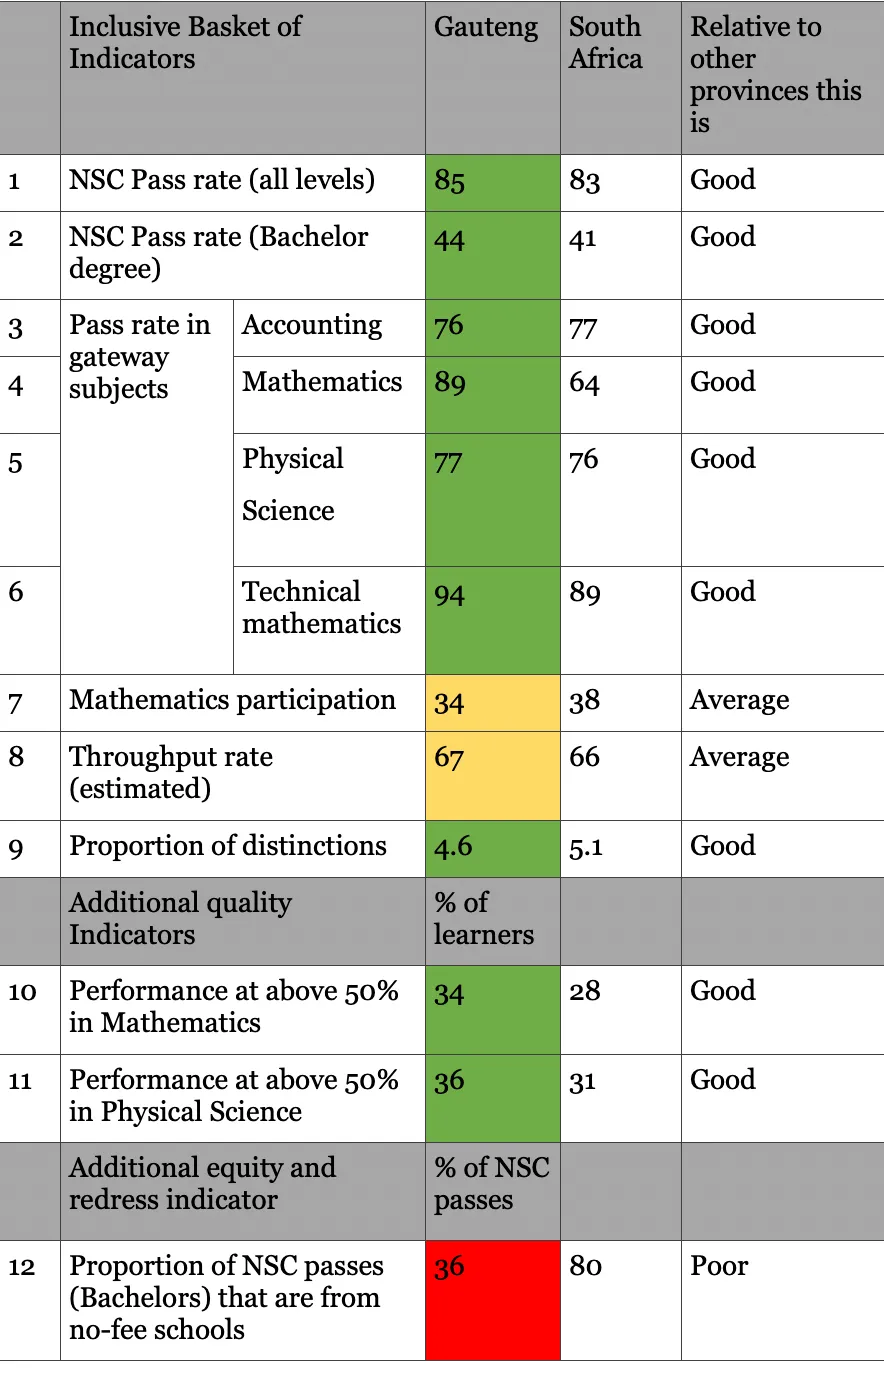
Gauteng has about 128,000 pupils enrolled for matric, and 85% of them passed, which is good. Gauteng comprises 18% of the pupil enrolment, and contributes 19% of the quality (bachelor’s level 4) passes. Gauteng is in the top three provinces for nine of the 12 indicators. Congratulations! This is a major achievement for a large urban province. Additional attention is required to ensure that no-fee schools are producing quality (bachelor’s level) passes.
KwaZulu-Natal: MEC Mbali Frazer
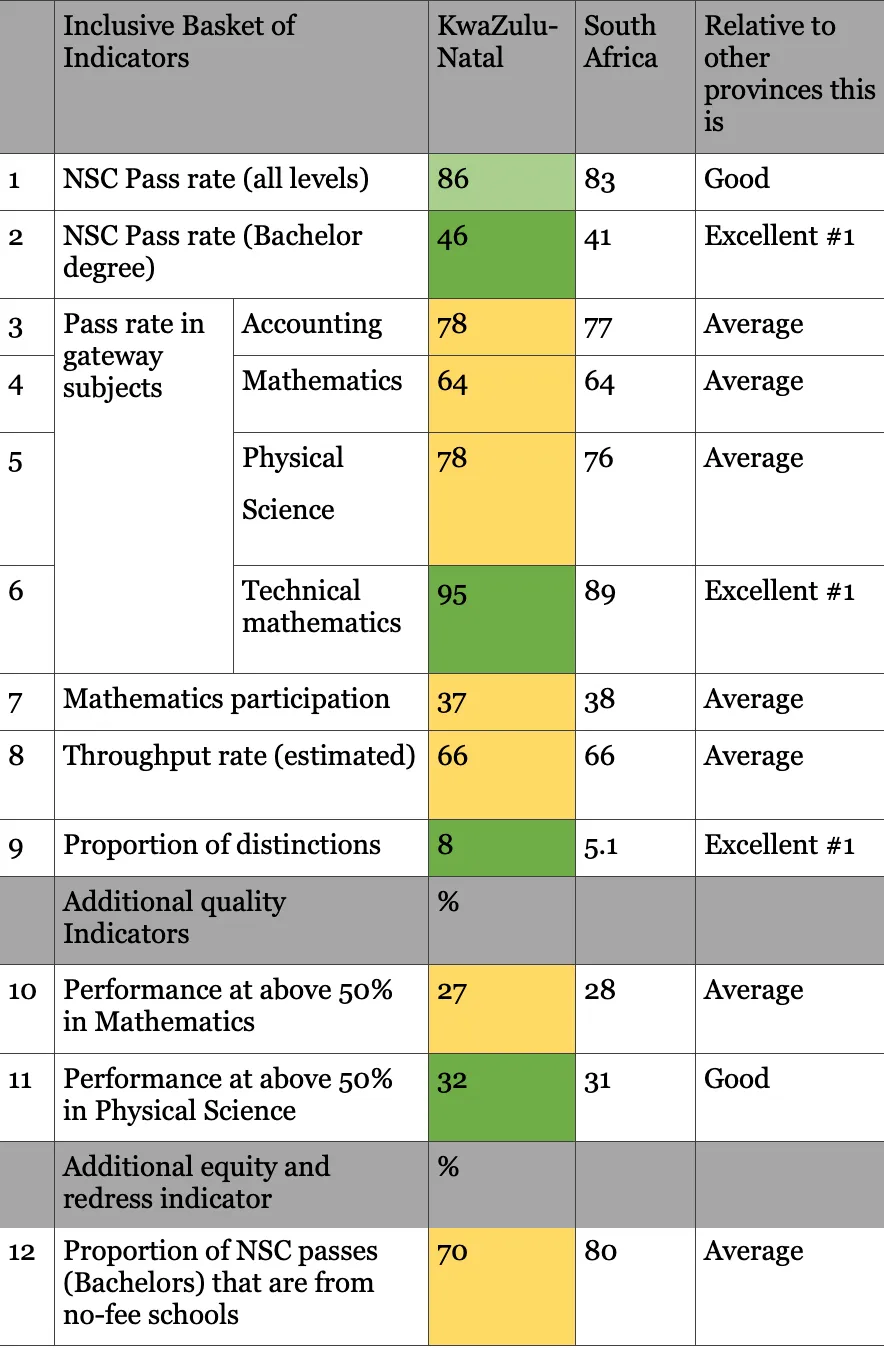
KZN has about 158,000 pupils enrolled for matric, and 86% of them passed, which is good. KZN comprises 18% of the pupil enrolment, and contributes 19% of the quality (bachelor’s level 4) passes. KZN is a rising star, and given its size is an important contributor to the nation. It excels in quality-level bachelor’s passes, having obtained the highest rate across all provinces, with 46% of its pupils obtaining a quality pass. It also punches above its weight in distinctions. These are both excellent indicators of high expectations and quality performance.
Limpopo: MEC Mavhungu Lerule-Ramakhanya

Limpopo has about 94,000 pupils enrolled for matric, and 85% of them passed, which is good. Limpopo comprises 14% of the pupil enrolment, but contributes only 12% of the quality (bachelor’s level 4) passes. It has the highest participation in mathematics – with 48% of pupils selecting maths over maths literacy. Unfortunately this high maths enrolment is not converting to quality passes (which remain average). Although its pass rate for physics is low compared with other provinces, it remains close to the average. Limpopo excels in the equity and redress indicator of the proportion of NSC quality passes from no-fee schools. It is the top province in this regard, with 85% of quality passes from no-fee schools.
Mpumalanga: MEC Bonakele Majuba
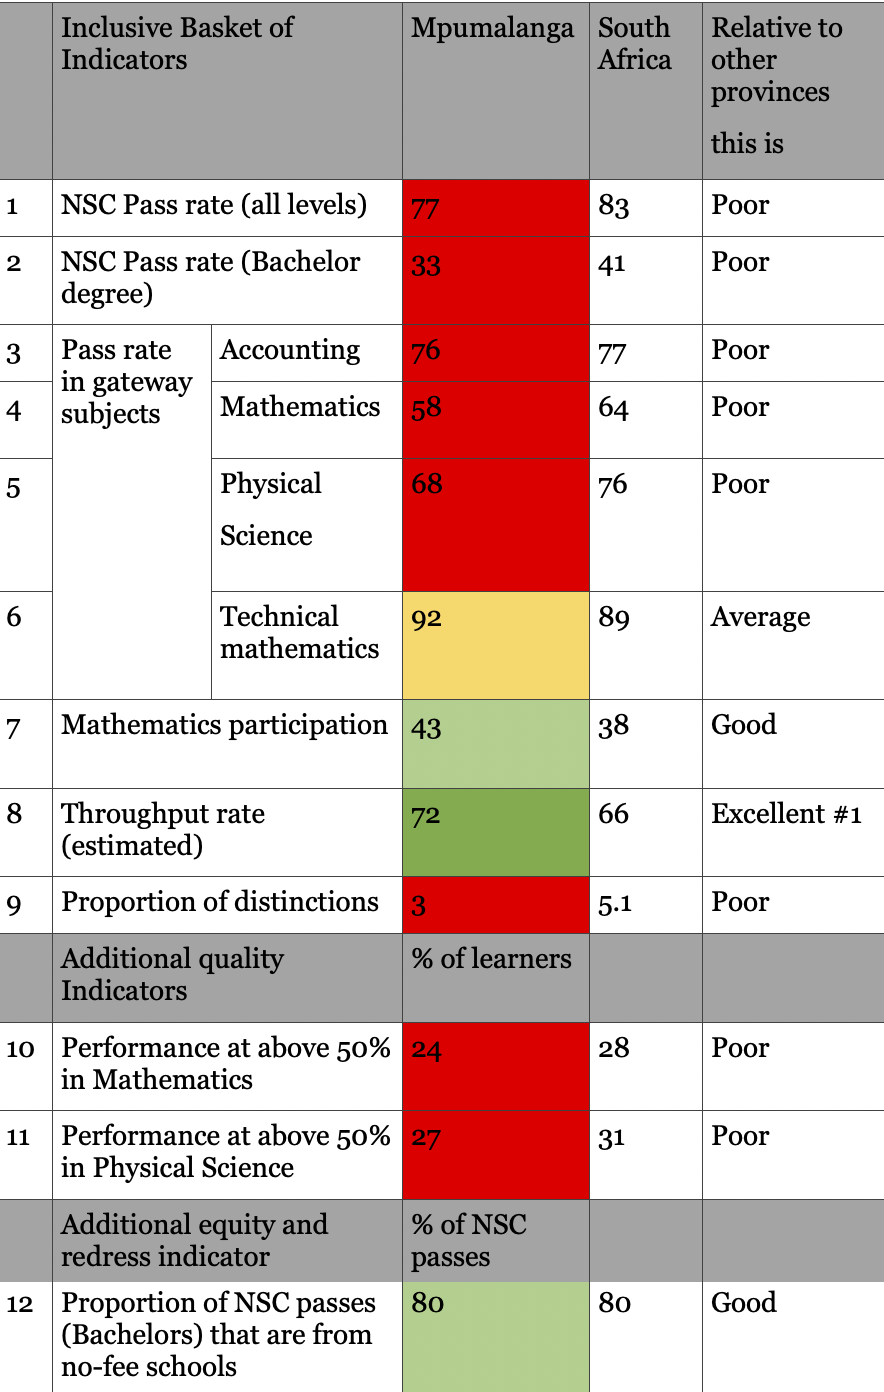
Mpumalanga has about 66,000 learners enrolled for matric, and only 77% of them passed, which is poor. Mpumalanga comprises 9% of the national learner enrolment, and contributes only 8% of the quality (bachelors level 4) passes. Mpumalanga is the top province relating to estimated throughput. However, it has far more poor ratings than good ones (eight out of 12 indicators are ranked poor). Mpumalanga needs to focus on getting the basics right with regard to the fundamentals: NSC pass rate, NSC quality pass rate. Once this is done, attention can turn to the gateway subjects, and distinctions. It is encouraging to see a high proportion (80%) of the quality passes coming from no-fee schools in Mpumalanga.
North West: MEC Viola Motsumi
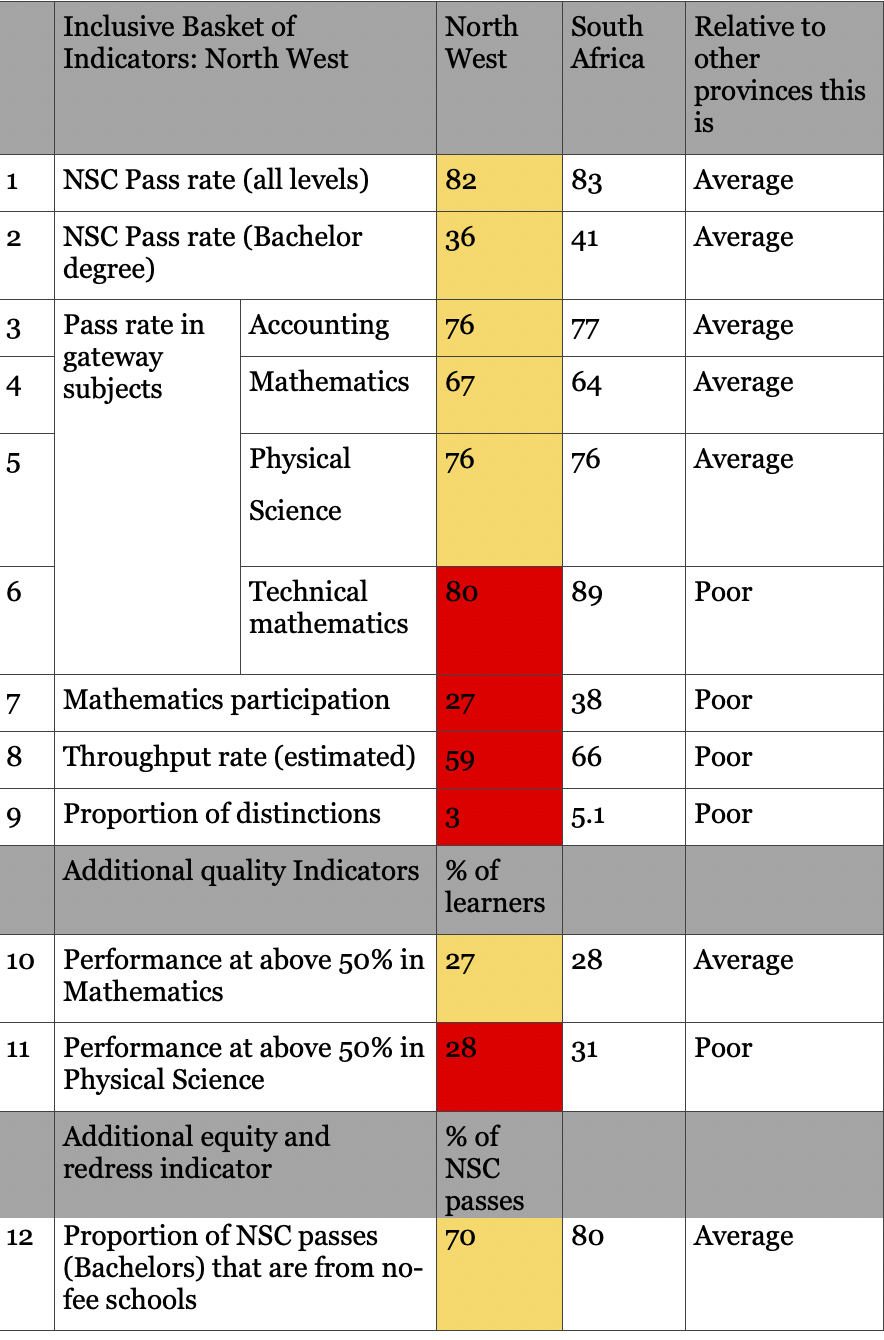
North West has about 41,000 pupils enrolled for matric, and 83% of them passed. North West comprises 6% of the national pupil enrolment, and contributes only 5% of the quality (bachelor’s level 4) passes. The province comes across in general as average. It does not excel in any particular indicator. It needs to focus on improving mathematics participation (73% of NW pupils enrol in maths literacy!), throughput, distinctions and quality passes in physical science. These are all important quality indicators.
Northern Cape: MEC Zolile Monakali
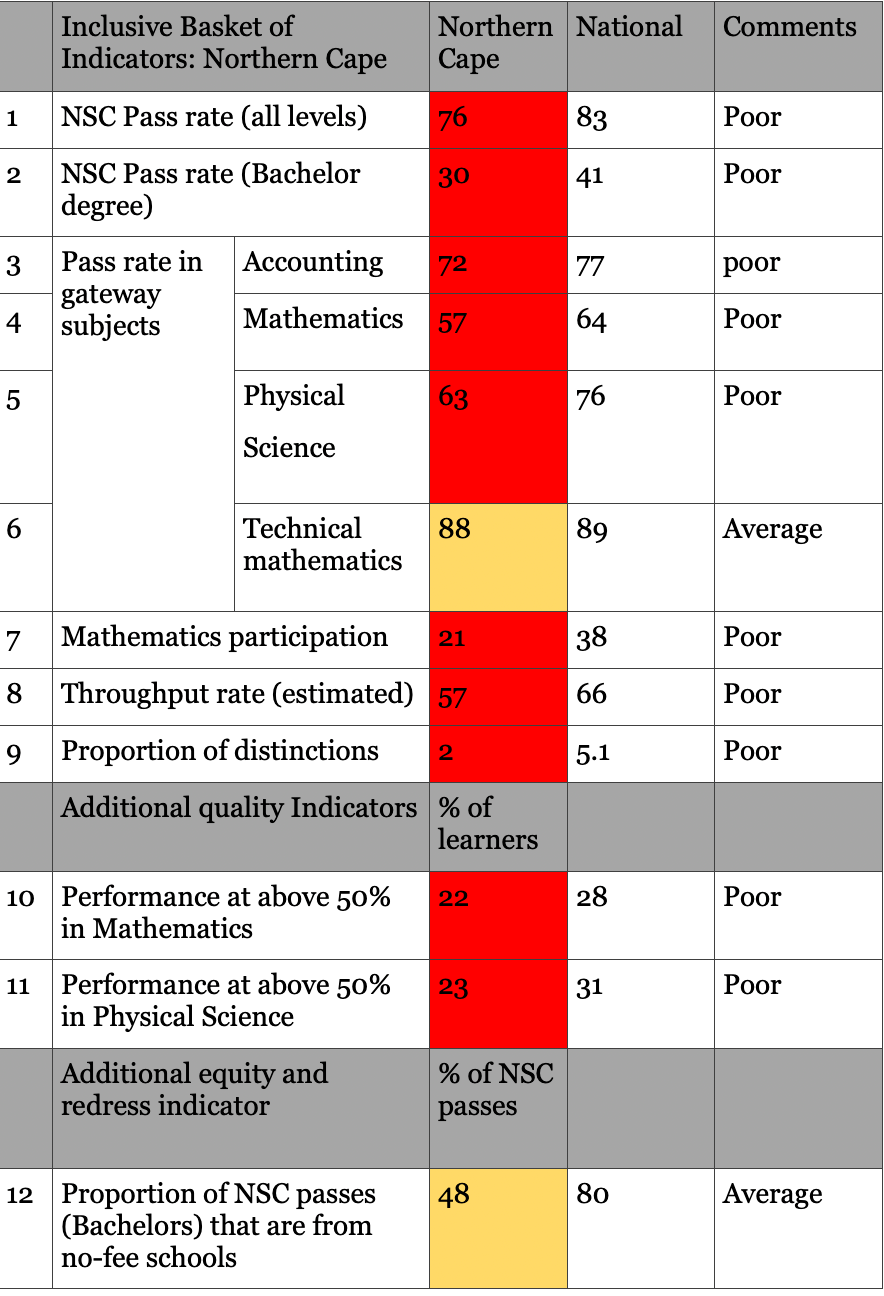
The Northern Cape has about 13,000 pupils enrolled for matric, and only 76% of them passed, which is poor. Northern Cape comprises 2% of the national pupil enrolment, and contributes only 1% of the quality (bachelor’s level 4) passes. The province presents a bleak educational picture. In 10 of the 12 indicators it is in the bottom three provinces. Is the Northern Cape a neglected province in terms of interventions? Do the heat, and vast distances mitigate against subject adviser and district-level support and/or serious investments into this province? Is it the socioeconomic conditions in its small towns which mitigate against learning?
With the growing economic investments of mining, wind farms and other renewable energy role players, it is now urgent to have a joined-up and coherent private-public intervention into understanding the Northern Cape’s challenges and addressing learning outcomes in this province.
Western Cape: MEC David John Maynier
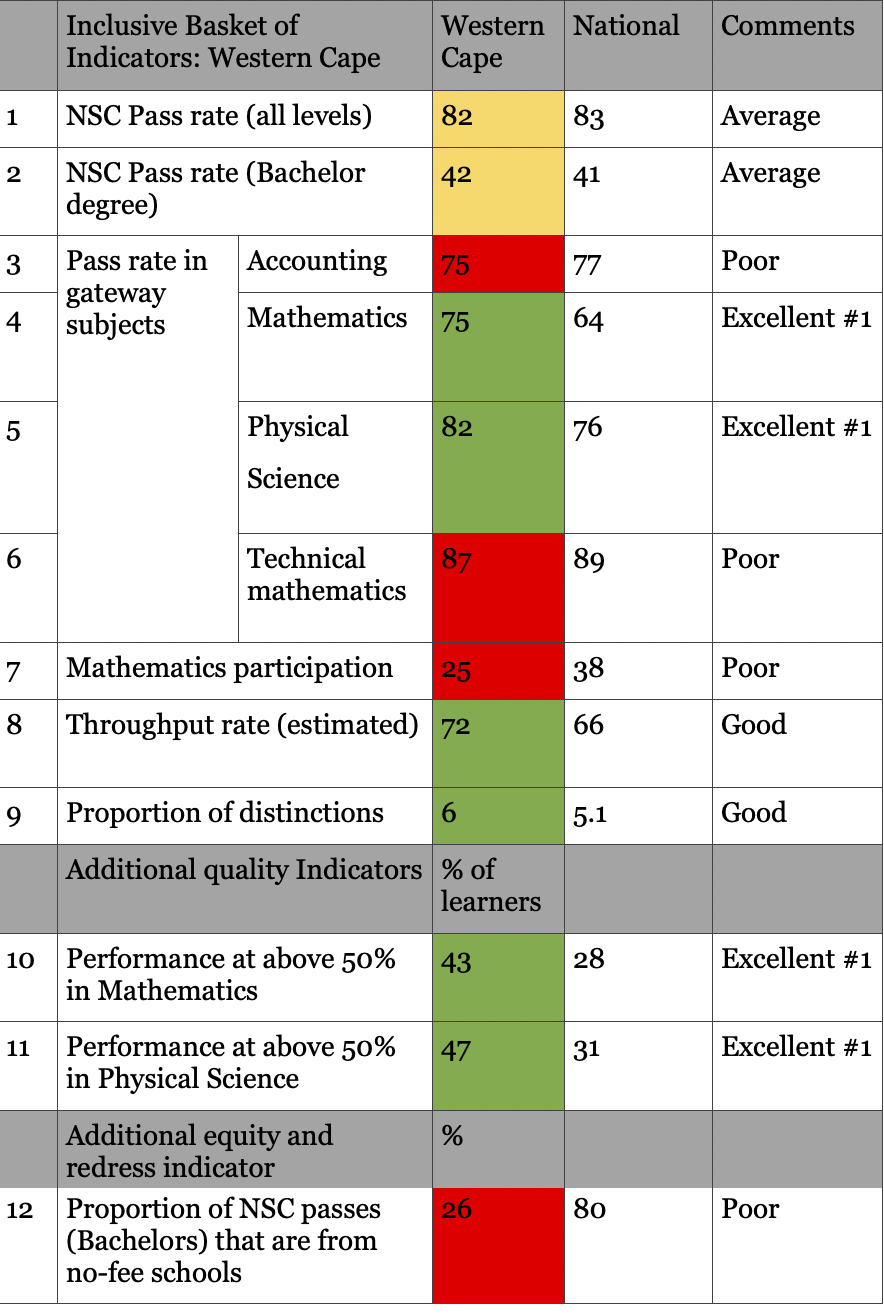
The Western Cape has about 62,000 pupils enrolled for matric, and 82% of them passed. The Western Cape comprises 9% of the national learner enrolment, and contributes 9% of the quality (bachelor’s level 4) passes. It must be congratulated in reaching the top spot for four indicators: Mathematics and physical science pass rates, and quality passes above 50% in these subjects. Throughput and distinctions are also good. Congratulations!
However, when we take into account the very low mathematics participation rate (75% of Western Cape pupils take maths literacy over mathematics!) the positive mathematics pass rates, and quality maths passes lose their shine.
The Western Cape clearly produces some of the country’s top performers. It is, however, its no-fee schools which need serious support to contribute to these quality indicators. With only 26% of quality passes coming from no-fee schools, the Western Cape is the most unequal province and has made the least progress with regard to educational redress.
This is particularly notable in a province which did not inherit any former Bantustans (homelands). The lack of quality learning in its no-fee schools requires urgent attention and intervention. DM
Professor Nicky Roberts is the director of Kelello Consulting and an extraordinary Associate Professor at the University of Stellenbosch. She specialises in mathematics, languages and technology enhanced learning. Professor Zanele Ngcobo is an Associate Professor in the School of Education, University of KwaZulu Natal. She specialises in mathematics education. Dr Lydia-Anne Plaatjies is an adult educator, multimedia producer and director of active citizenship focusing on youth speak leaders. They write in their personal capacities.