


 (Photo: Leila Dougan)
 The Eskom Pension and Provident Fund (EPPF) wants the public and its members to believe the fund’s financial position and operational cost structure is just hunky-dory. In reality, it is not. Their investment fees, when compared to the rest of the industry, are not great, and the metrics they disclose are opaque at best. Why should an EPPF member pay a vastly different amount for the same service than the rest of the country, especially when they are contributing to one of the largest and most influential funds in the country?
Setting the benchmark
In order to test the reasonableness of the EPPF’s costing structures, we used the annually published Registrar of Pension Funds Annual Reports as benchmarks for the years 1993 - 2017, the latter being the latest report issued by the Registrar. It contains information of all of South Africa’s private retirement funds that are required to submit their financials to the Financial Services Conduct Authority (FSCA) every year.
Supporting data was obtained from the FSCA website, respective pension funds’ websites and other government sources such as Statistics SA.
It should be noted that as the year-ends of individual funds differ across the annual period used by the Registrar, the annual reports in question are not a precise picture of the local market. However, it remains the best and only representation of “Pension Fund South Africa” in the public domain. Furthermore, for the purpose of this analysis, Business Maverick restated the communal year-end for “Pension Fund SA” as 31 December.
The comparison was made on a like-for-like basis, which is facilitated by the fact that the annual financial statements of Pension Funds are in a statutory format, making a comparison between funds very coherent.
Now for some context
The EPPF is a private fund as per the FSCA classification and is registered as a defined benefit pension fund under the Income Tax Act. According to the Registrar’s reports, the average number of members per registered retirement fund in 2017 in the country were as follows:
- Average member per private fund: 3,680
- Average member per underwritten fund: 1,898
- Average member per private and underwritten fund: 2,930
The EPPF with 81,222 members in 2019 and 84,618 in 2017 is therefore at least 22 times larger in terms of membership than the average private fund in South Africa – and this gets even larger if underwritten funds are included.
In terms of investments as per the Registrar’s 2017 report, each private and underwritten fund had approximately R470-million in investments on average, while the EPPF has investments of R144-billion in 2019 and R132-billion in 2017 respectively, which is approximately 280 times more than the average private and underwritten fund.
As such, the EPPF can be considered a very large private fund and is in fact the largest fund by assets and the 31st largest fund by membership, according to FSCA records. Logically, and according to industry experts, given the EPPF’s size it should have some of the lowest costs in the industry if compared to the average of its counterparts – “Pension Fund SA”. In fact, they say, it should be the benchmark for the rest of the industry to aim for, but regrettably this is not the case.
Total Expense Ratio (TER)
In a letter sent to and published by the Daily Maverick in response to a Business Maverick article claiming that it ‘overpays for underperformance at the expense of Eskom employees’ the EPPF refers to Total Expense Ratio (TER), which is a metric used by asset managers to calculate the ratio of an investment portfolio’s actual expenses as a percentage of an investment portfolio’s average assets under management in a given period. The EPPF tried to use this to defend EPPF’s administration costs rather than their investment costs.
As explained to Business Maverick by an array of actuaries, this might be a useful reference when comparing investment portfolios, but when it comes to retirement funds it becomes less so.
Retirement fund costs are not based on a single function. They include managing the investment portfolio, which is normally outsourced to asset managers. In addition, there is the cost of administering the member records and payments, one expert said.
The biggest cost drivers for administration are therefore related to the number of pay points contributions must be collected from, the number of claims to be paid and the number of investment managers the fund makes use of. The more there are of these items, the more staff are required to be employed to manage the processes associated with them.
Therefore an 80,000-odd member fund with fewer pay points and several investment managers (including the EPPF itself) should be cheaper to run than a fund with the same number of members but who have more pay points, money managers and claims on their books.
If the other funds in the country had the same value of investments, one would expect similar investment fees to be charged. If, however, the fund splits these investments among more investment managers, the value of assets managed by each manager is lower and therefore the investment fees can increase.
Therefore, when analysing these funds Business Maverick looked at each cost component separately.
Business Maverick was also told that the reason the Retirement Fund Administration industry prefers to use TER (or percentage of contributions or salary) for administration costs is because it hides a multitude of sins but has absolutely no bearing on the cost incurred for the administration of a fund.
For example, banks mostly do not charge bank charges based on the balance you hold at any point in time – it is usually a transactional or fixed charge. Likewise, retirement fund administration costs should be compared on a per member cost basis, as the member is receiving the same service in the maintenance of their membership record like every other member in a retirement fund.
The impact of TER versus a per member cost comparison will be highlighted in the analysis of administration costs below, clearly showing how it distorts excessive charging and hides the expected economies of scale, which are the cost advantages that entities should obtain due to their scale of operation.
Given that the investments held by the EPPF are substantially greater than those held by the average pension fund in South Africa – in fact, they hold the most – Business Maverick’s expectation is that the costs would be substantially cheaper than those found for the average Pension Fund SA, as the size of their assets gives them greater purchasing power. Asset managers will generally also reduce the fees charged when the quantum of assets placed under management is significant.
The graph below shows the EPPF’s investment fees as a percentage of investments. For the period 2015 to 2017, EPPF’s investment fees are greater than the average fund in South Africa. This should not be the case for the fund which has the largest amount of investments for any private or underwritten fund in South Africa under the FSCA supervision. These costs have increased in 2018 and were marginally less in 2019 but still higher than in 2017, a trend that is moving in the wrong direction.

This graph shows the EPPF’s investment fees as a percentage of contributions, which indicate that the average contribution per member is more than five times greater than that for the average member in Pension Fund SA.
In its analysis, Business Maverick split the fund’s total administration costs into:
- Fund costs – the cost that a retirement fund will have to incur by simply existing, which include audit fees, board fees, bank charges, Fidelity insurance etc. and
- Administration costs – the costs required to administer the fund by processing, accumulating these records with the return, calculating and paying member claims and fund expenses and accounting for and reporting on these activities.
This allowed us to compare more accurately the cost of a fund versus the running of the fund and to compare the funds that are self-administered, like the EPPF, and those that outsource the administration function.
The allocation of total administration for the Pension Fund SA analysis is consistent with that done for the EPPF.
The graphs below are an analysis of costs from different perspectives.
First, Pension Fund SA has a much lower average contribution per member than the EPPF. In the three years for which we have comparable data, EPPF members were contributing five times more.

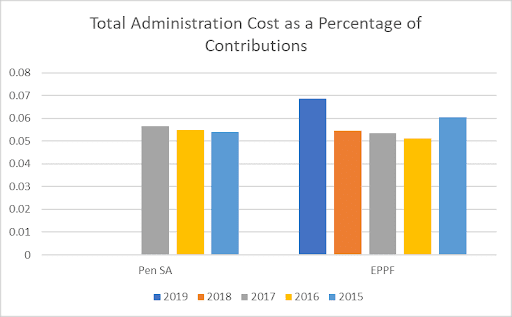
The EPPF’s total administration costs as a percentage of contributions versus Pension Fund SA is a mixed story. Pension Fund SA was better in 2015 with the EPPF having a lower percentage in 2016 and 2017. But then EPFF’s costs rose sharply in 2018 and 2019. It should be noted that as a large fund, the EPPF really ought to have a much better cost ratio.
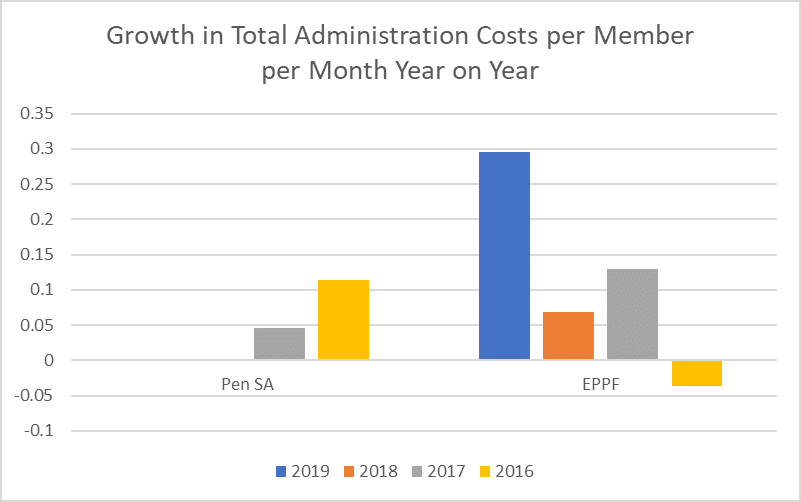
In absolute terms, however, the difference really jumps out. The EPPF’s total administration costs per member per month are never lower than 2.6 times that of Pension Fund SA for the periods compared in the graph below. This means that each EPPF member pays 2.6 times more than the average pension fund member in the country.
In addition, it shows when EPPF managed to lower its costs, the total administration cost was increasing at a huge rate, much faster than Pension Fund SA for the comparable period. The increase in total administration costs per member per month from 2018 to 2019 for EPPF was 29.54%, whereas if the increase for the total cost shown in the annual financial statements was looked at, it was up by 25.92%.
With declining membership, each member that remains bears a greater portion of the costs, or, in the case of a defined benefit fund, the employer bears that cost. The EPPF increase in administration costs on either basis is however extremely high for 2019 and other years.
The graph below is a good example where expressing a cost as a percentage of contributions appears to show great cost management. Because contributors to Pension SA are on average making much smaller contributions, their costs seem larger by comparison. Because contributors to the EPPF are paying more, their costs seem smaller by comparison.
If you calculate it this way, the EPPF’s costs as a percentage of contributions are substantially lower than that for Pension Fund SA, in fact up to 2.5 times lower.
If you look at it in absolute terms, however, it is a different story. It shows an average cost of R333 for Pension Fund SA versus R690 for the EPPF – more than double that of Pension Fund SA.

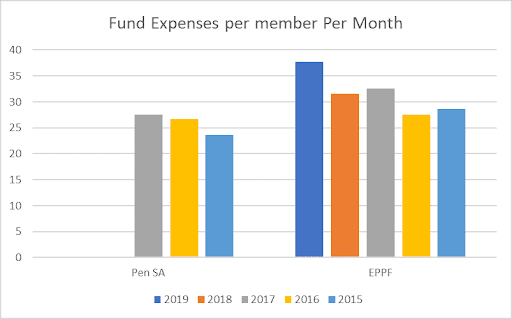
When expressing the fund’s expenses per member per month, the graph below shows the EPPF’s fund expenses are greater than Pension Fund SA in every year compared. EPPF members are paying more per member than the average pension fund in South Africa even though, given its size, these should be considerably lower.
The main outliers here appear to be the consulting, principal officer and board costs as reported on previously, and to be further dissected in future.
Now if we want to reflect the EPPFs administration costs on the basis that EPPF would want us to, as per TER and their letters of reply and communications to members as the total administration fees, fund cost and cost to administer, as we did above, but as a percentage of investments, and then compare these to the Pension Fund SA market, this is what that would look like:
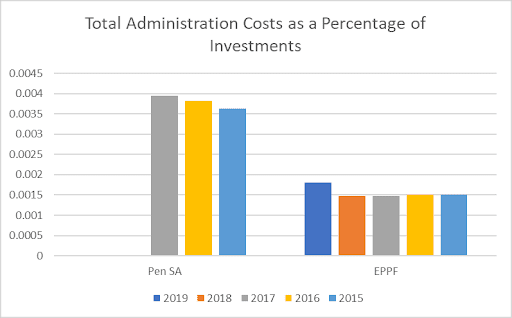
Now that does tell a different story altogether, doesn’t it? BM