


 Archive Photo: Limpopo’s top Matrics, Masithi Mikano Ndodzon and Mavhina Khuthadzo Anthel during the announcement of the Limpopo Matric results in Polokwane, on the January 4, 2019. (Photo by Gallo Images/ Sowetan/Antononio Muchave)
 Part One of this series provided some empirical evidence to debunk five persistent myths about matric results:
We are not making any progress;
Matric results report on quantity, not quality;
Matric is getting easier and easier;
Youth who fail matric have no options open to them; and
Every citizen should obtain matric;
In Part Two, I discuss another three recurrent claims that:
The roughly half-a-million students who don’t make it from Grade 1 to Grade 12 are ignored;
Matric is written by 18-19-year-olds; and
Those outside schools are a lost cause.
Again, I will discuss each one, with some empirical evidence to ensure that my opinion is more than just my own experience or gut feeling.
MYTH 6: The roughly half-a-million students who drop out of full-time school between Grade 10 and Grade 12 are being ignored.
Did you hear the radio interviews, or see the tweets and news reports which argued that the Department of Basic Education deliberately ignores the youth who are out of full-time school, to inflate the matric “pass rate”? They argue that the “real matric pass rate” should include all the children eligible for matric — and not just those who are still in full-time school.
FACT: Various role players have argued for greater attention to “out of school” youth, for some time. The Department of Basic Education has responded in part to these calls to publish the “cohort pass rate”. This is the number of learners eligible for matric in an age cohort, and not just those learners who are in full-time school.
In its release of the Class of 2018 results, the Department of Basic Education argued that the National Senior Certificate (NSC) results are just one indicator of the quality of the schooling system. It referred to early childhood development and Grade R enrolments. It reflected on performance in international assessments. It published the overall trends on “out of school” youth for ages 7-18:
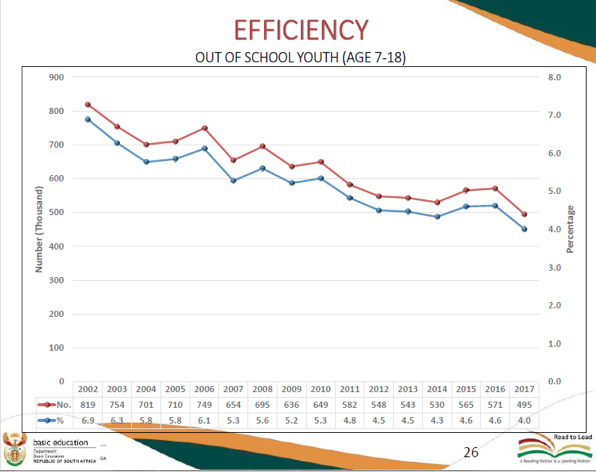
Source: DBE NSC 2018 Technical report
Notice, that this declined over more than a decade from 7% in 2002 to 4% in 2017. School enrolment has been near-universal for primary school (ages 7-13), but there is more concern about secondary-school dropouts.
The Department of Basic Education has also published its Education Management Information System data for the last four years in its NSC Technical Report (2018):

Source: DBE NSC 2018 Examination report
So the Department of Basic Education is now tracking its cohorts and knows exactly how many of the children in the Class of 2018 started Grade 1 in 2007. It is transparent about this and makes this data available publicly (on the day after announcing the matric results).
However, the department has not yet made the bold step of calculating the “cohort pass rate”.
If we simply subtract the number of a number of learners in full-time schooling in Grade 12 in 2018 (643,802) by the number who entered school in Grade 1 in 2007 (1,171,323), we find that we are “missing” 527,521 learners. So 45% of those who entered Grade 1 are no longer in Grade 12.
We can use this data together with the pass rate data, to report on the “cohort pass rate” for full-time candidates:
Class/cohort | Learners in Grade 2 | Learners in Grade 12 | NSC exam pass rate | Learners achieving NSC (full time) | Cohort matric pass rate |
Class of 2015 | 1 118 690 | 687 230 | 70.7% | 455 825 | 41% |
Class of 2016 | 1 082 501 | 657 447 | 72.5% | 442 672 | 41% |
Class of 2017 | 1 050 103 | 629 155 | 75.1% | 401 435 | 38% |
Class of 2018 | 1 031 821 | 643 802 | 78.2% | 400 761 | 39% |
Source: Own calculations from DBE NSC 2018 Examination report
Taking into account part-time enrolments (estimated at 35,000 full-time equivalent learners) would increase the cohort matric pass rate for 2018 to 42%. 1
Unfortunately, the enrolment picture is not quite as simple, as the above rough calculations suggest. This does not consider children who start school late, who repeat grades or who re-enter school after a break. We see these changes in enrolment more clearly when plotting the above Department of Basic Education enrolment data by grade for each class in full-time schooling over time:
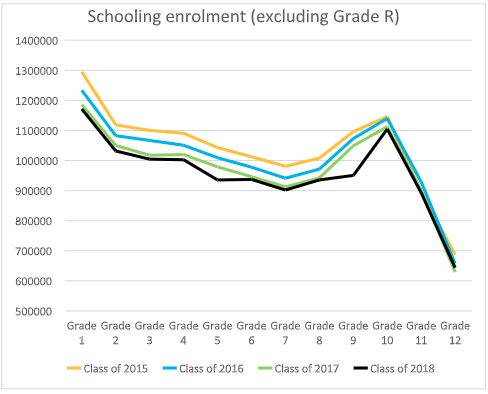
Source: Own calculations from DBE NSC 2018 Examination report
There are two important enrolment trends worth noting:
First, the Grade 1 enrolments seem to be inflated. Children do not drop out between Grade 1 and Grade 2. But there is a high repeat rate in Grade 1, and there has been a tendency for children to be enrolled in Grade 1 too early (to access free public education). The Grade R enrolment data — which shows increasing Grade R enrolments over time (with 67% enrolment in Grade R compared to Grade 1 in 2016) may smooth out this trend over time. It is for this reason that the Grade 2 cohort data (which is comparable to grades 3 and 4) is used when calculating the cohort matric pass rate.
Second, there is an increase in enrolments in secondary school. The enrolment data is relatively stable for grades 1-7 (primary school), there is an increasingly evident in Grade 8, to Grade 9 and then to Grade 10. A more efficient education system would show a decrease in enrolment from Grade 9 to Grade 10 as the alternatives to full-time schooling for Further Education and Training (FET) pathways would be utilised.
It would also no longer show a “blockage” at Grade 10, caused by repeaters. For this to be attained a more flexible and better-articulated FET system is required. Full-time schooling is not the primary form of learning for youth. Having learners stuck in Grade 10 or Grade 11 is inefficient, leads to bigger class sizes, and is likely to impact on the quality of learning as fewer resources and less attention is available for the age-appropriate learners.
It is worth looking more closely at the secondary school enrolment data:
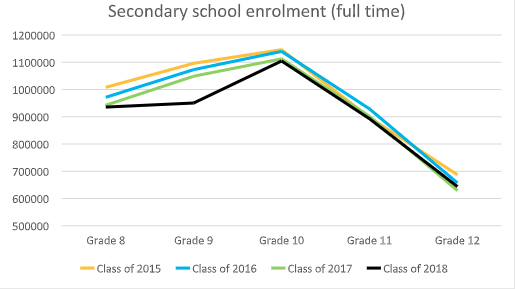
Source: Own calculations from DBE NSC 2018 Examination report
The comparative stability in enrolment from grades 8 to 9 for the class of 2018 (compared to 2015, 2016 and 2017) looks encouraging. It may be there are fewer learners failing Grade 9 (and so increasing the Grade 9 enrolment). However, this requires further investigation, and tracking to establish if this is retained over time.
There are sharp declines in enrolment grades 11 and 12. This provides evidence of the many young people who fail and/or exit school in lower secondary school (commonly at Grade 10). This leads to increased class sizes in schools at the Grade 10 level. The specialisation and difficulty of academic work increase significantly from Grade 9 to the higher grades.
MYTH 7: Matric is written by 18-19-year-olds
FACT: Matric is written by 16-30-year-olds.
Given a starting age of six years old, the age to complete Grade 12 (including the possibility of repeating a grade once per phase is 18 to 22 years old. This is the age analysis of the Class of 2018 as provided by the Department of Basic Education:
Age | Entered NSC 2018 | Wrote NSC 2018 | Percentage writing | Pass rate (of those entering) | Pass rate (of those writing) | |
16 | 2317 | 2178 | 94% | 83% | 88% | |
17 | 82754 | 79339 | 96% | 85% | 89% | |
18 | 200288 | 187358 | 94% | 82% | 87% | |
19 | 131340 | 108626 | 83% | 63% | 76% | |
20 | 87631 | 62974 | 72% | 47% | 66% | |
21 | 57390 | 36514 | 64% | 41% | 65% | |
22 | 33061 | 19180 | 58% | 19% | 33% | |
23 | 16025 | 8617 | 54% | 27% | 50% | |
24 | 7499 | 3997 | 53% | 26% | 49% | |
25 | 3063 | 1685 | 55% | 29% | 52% | |
26 | 1426 | 848 | 59% | 34% | 57% | |
27 | 668 | 434 | 65% | 38% | 58% |
Source: Own calculations from DBE NSC 2018 Examination report
Unsurprisingly, those who write matric at the appropriate age band (17-20 years old) perform better than those who write it when older.
Notice the high retention rates (above 80%) from those entering to those writing in the 16-19 age group and the related high pass rates (above 75%) for the 16-19 category.
The retention rates for those entering and writing matric, and their pass rates, drop for the those who are 21 and older. The older learners have already encountered difficulties with schooling. They may have repeated grades, started school late, or re-entered school after a break. The Department of Basic Education is correctly concerned about 10% of full-time learners who are older than 21 and are still writing matric exams.
MYTH 8: Those who are outside the full-time schooling system are a lost cause
“There is nothing that a person who is no longer in school can do.”
FACT: There are multiple pathways for learning and work opportunity after Grade 9. However many of these opportunities are not known about, and/or are poorly funded.
How full-time schooling joins up to other opportunities is made explicit in our National Qualifications Framework Act 67 of 2008 (NQF). The basic level of education is up to Grade 9 — through formal schooling (and or through Adult Basic Education and Training). This is NQF level 1.
From NQF levels 2 onwards there are different pathways open for further learning:

Source: South African Qualifications Authority
A young person (or adult) who has completed Grade 9 in full-time schooling (so obtained NQF level 1) is eligible to:
Enter a FET college where they can obtaining national certificates vocational (years 1-3), then enroll in an apprenticeship leading to becoming an artisan — which may lead back into a matric and university pathway.
Undertake a skills programme (offered by various Sector Education and Training Authorities (SETAs), and leading into/supporting learning in the workplace). These are offered at NQF levels 2 to 6, and at level 5, can be used to lead back into a matric and university pathway; or
Remain in full-time schooling to complete grades 10, 11 and 12.
Our current national norm is to focus only on those youth who take the “remain in full-time schooling” route. This attitude — with our skewed education funding towards universities — must change.
So what can be done (and/or investigated) further to bust these persistent myths?
Recognise that our compulsory full-time schooling applies only to the age of 15 and expect that the vast majority of our citizens reach this basic education level (NQF level 1 — or some secondary schooling).
Expect that only some (just more than half) of our 18-year-olds will write matric through full-time schooling. We need to strengthen the offerings and awareness of what is available for more flexible pathways for learning, training and work for our 15-24-year-olds. Full-time schooling is only one option.
Ensure that parents and the youth are aware of the full range of learning opportunities for 15 to 24-year-olds. This learning is a combination of work experience, internships, academic, vocational and technical training options.
Publish the “matric cohort pass rate” with the annual NSC results. Including this metric in the provincial breakdowns would also be helpful.
Fund and strengthen the flexible pathways into obtaining a matric (by supporting the current part-time, and multiple exam opportunity initiatives), so that secondary schools cater for their main target of 13-20-year-olds.
Build on and strengthen schools’ and districts’ ability to support older learners with more flexible learning (such as the multiple examination options, and second-chance matric programmes. This could be through platooning (using the facilities after school or during weekends or holidays), part-time and repeat classes for older learners. However, such interventions should not be funded solely from the basic education budget allocation, and should reflect joined-up services for youth (involving the Departments of Labour and Higher Education) to include both skills programmes and referrals to vocational and technical colleges.
Fund and strengthen the alternative pathways for learning among 15-24-year-olds. This includes vocational and technical training at FET colleges, and skills programmes via SETAs. A full-time school matric which leads to a university degree should not be the only route into employment.
Combine our data sets across departments to get a real picture of where our youth are and how they are being schooled, trained and or employed. This would include tracking youth (ages 15-24) drawing on schooling data, child grant data, employment data, skills programmes, youth internships and vocational and technical schools and combining this with our general household, census and community survey data.
Track the part-time learners over time to ensure that they can be accurately reported within the annual cohort pass-rate indicator.
We have observed an increase in poverty levels from 2011 to 2015. Our class of 2018 were aged 11 to 15 (in grades 5-9) when we saw poverty levels rising. Assuming that our poverty levels decline again in later periods, watch for possible impacts on educational outcomes, especially for those in the vulnerable 0-5-year age groups (our classes of 2029 to 2034).
So I see improvements in our education outputs and the quality of our education data. I see slow moves (or at least intention) towards a more flexible and less high-stakes NSC system which caters more flexibly for older youth (not just 15-18-year-olds).
I worry that matric is seen from the perspective of the privileged youth (about a fifth) who complete full-time education and are eligible for university degree programmes. Those who fail, drop out or take a break are those in most dire need of real funded opportunities for study or work. I still maintain that our vulnerable children in the 0-5 age group need the greatest investment to reduce our gaping inequality.
I feel bored by the persistence of the “education basket case” mythology. I think this is in part a weakness in the quality of our journalism and educational reporting. I think all media platforms who want to be taken seriously in their analysis of matric results should at the very minimum familiarise themselves with the reports made promptly available by the Department of Basic Education. The same holds for those who pose questions to “education experts”.
Each year reports on the NSC results are made available on www.education.gov, under “curriculum”:
Department of Basic Education NSC 2018 Examination report;
Department of Basic Education NSC 2018 Technical report;
Department of Basic Education NSC 2018 School report.
To shift our public discourse on education performance and hence improve our educational investments and performance we must be informed. Our future depends on it. DM
Nicky Roberts is an Associate Professor in the Centre for Education Practice Research at the University of Johannesburg Soweto campus. She has a PhD in mathematics education (Wits), and a masters in international perspectives in mathematics education (Cambridge). Her research focuses on childhood mathematics, science and language in addition to technology-enhanced learning.
1Part time passes are difficult to estimate, as in many cases the part-time candidate does not write all seven subjects in one sitting. This estimate has been made from assumptions presented on page 7 of the DBE report on NSC Results.