


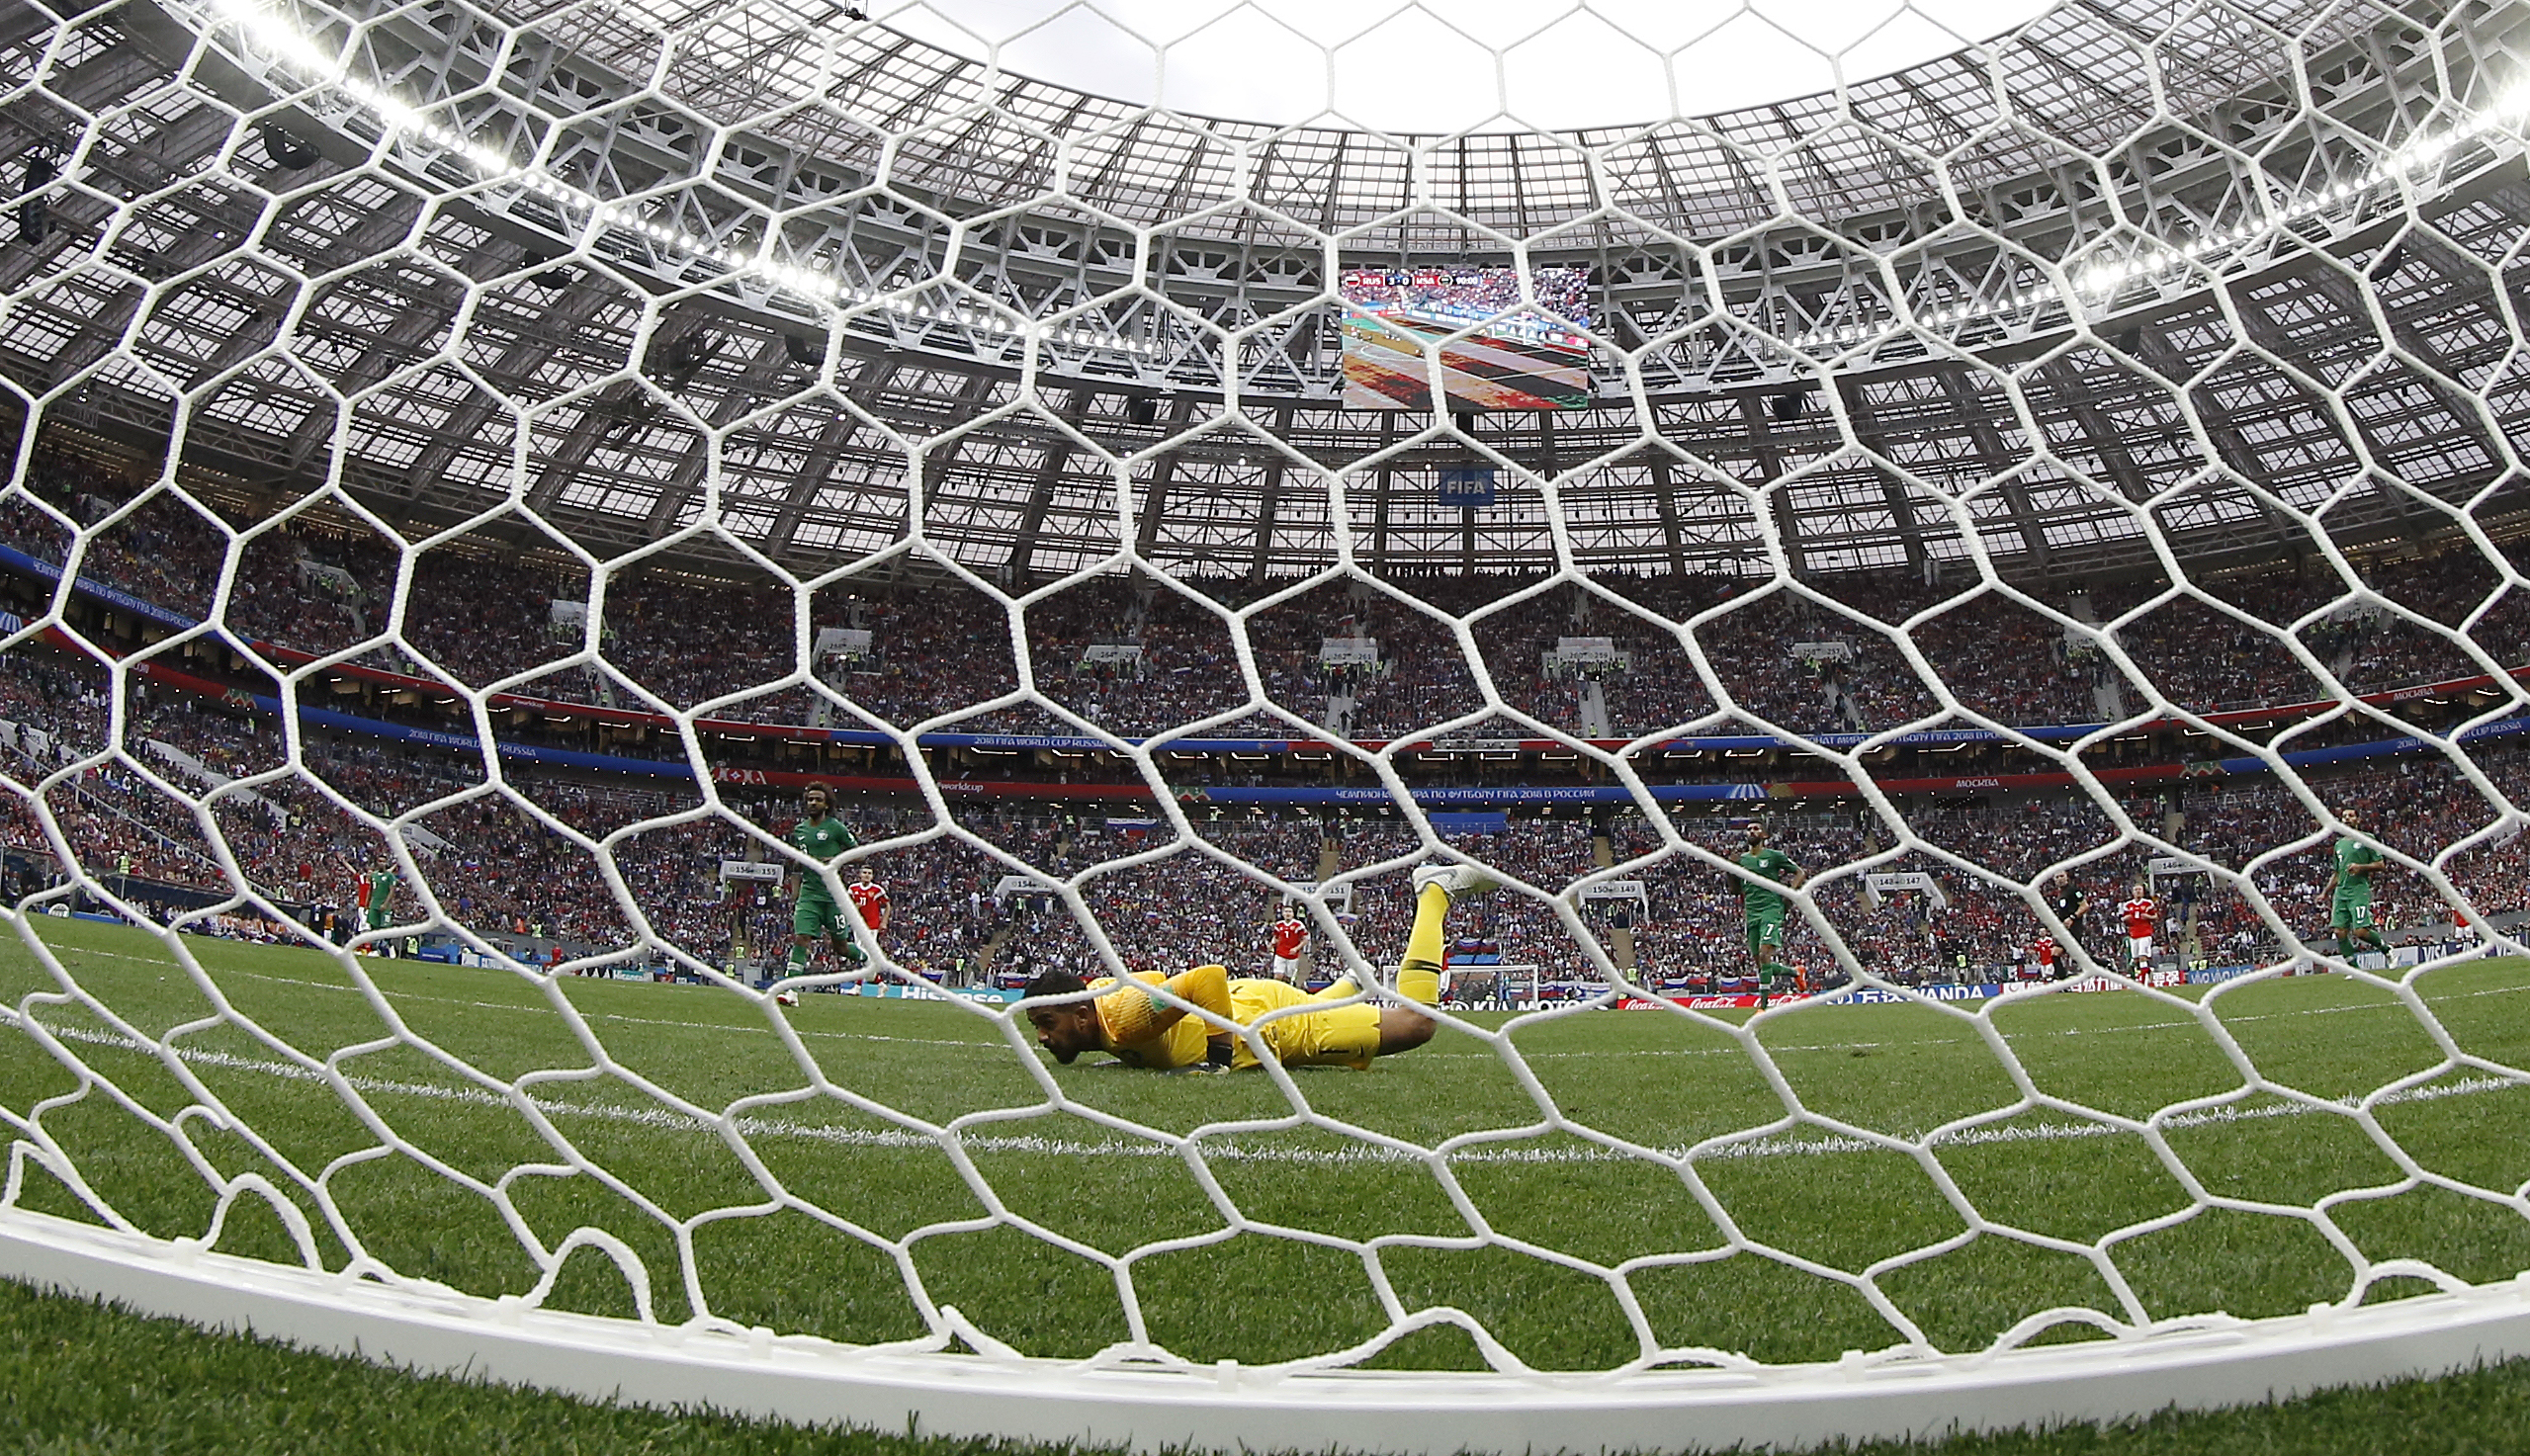
 Saudi Arabia's goalkeeper Abdullah Almuaiouf concedes Russia's 4-0 lead during the FIFA World Cup 2018 group A preliminary round soccer match between Russia and Saudi Arabia in Moscow, Russia, 14 June 2018. EPA-EFE/YURI KOCHETKOV
 The World Cup is here and hosts Russia opened the tournament by thrashing hapless Saudi Arabia 5-0 at the Luzhniki Stadium in Moscow.
Not since 1950 has an opening game of the World Cup finished with such an imposing scoreline. And that fixture - between Brazil and Mexico - only ended 4-0 in Brazil's favour.
Thank goodness for that.
There’s one thing everyone wants to see when watching soccer. No, not England engineering a creative way to implode: it’s goals. While more seasoned soccer watchers can appreciate a sturdy defence, the World Cup captures a broad audience, one that often prefers goals to fancy footwork.
Since the inception of the World Cup back in the 1930s, there have been some notable trends in goals scored. On the surface, it looks like goals have followed an upward trajectory.
History of the World Cup by number of goals
/file/dailymaverick/wp-content/uploads/goals.png "Graphic / data via public.tableau.com")
Total goals do not take into account the increase in teams participating and more matches being played, though. The average goals per tournament paints an interesting picture.
History of the World Cup by average number of goals
/file/dailymaverick/wp-content/uploads/average-goals-wc.png "Graphic / data via public.tableau.com")
Overall, the average number of goals scored has remained fairly stable across the last five tournaments, increasing slightly at the last event in Brazil.
It might seem like a no-brainer that goals increase when more games are played, but that does not ring true for individual teams.
Overall, Germany has scored more goals than any other side - 224 in 106 matches - but the difference for the teams that follow is notable.
Brazil, the most successful team at World Cups, has scored 221 goals in 104 appearances, while Argentina has notched 131 in just 77 matches. Italy found the back of the net 128 times in 83 games and France come in fifth with 106 goals in just 59 games. Special mention to Hungary - a team which hasn't even qualified for the competition since 1986 - with 87 goals in just 32 games.
Interesting as these nuggets are, they are largely just numbers for the sake of numbers. What about the science and what does it all matter?
Fortunately, there are some smart people who analyse this kind of stuff. Turns out goals matter more when they are scored first.
After the 2010 World Cup, a study published in the Journal of Human Sport & Exercise found that during the group stage, the team scoring the first goal recorded 66.7 percent of victories, 4.2 percent of defeats and 29.2 percent of draws.
The impact was compounded when it came to the knockouts. Here, 81.3 percent of the time when a team scored first, they won. That compares to 6.3 percent of defeats and 12.5 percent of draws.
Does that mean the team that scores the most goals will lift the trophy?
Looking back at the last five tournaments in which Germany, Spain, Italy, Brazil and France have triumphed, statistics suggest it’s probably so
France, Brazil and Germany (including seven in a single match) all averaged more than two goals per game during their World Cup-winning runs. Spain and Italy, though, are anomalies.
Back in 2010, David Villa scored five of Spain's eight tournament goals while Italy managed just 12 in the entire tournament back in 2006. Unsurprisingly, these cup wins came when there was a dip in average number of goals overall.
What helped the pair was the presence of solid goalkeepers, with Spain’s Iker Casillas and Italy's Gigi Buffon both putting in good shifts throughout the respective tournaments. They even share the record for the least number of goals conceded during a competition which their team won. France's Fabien Barthez also makes the list for his efforts as Les Blues clinched the cup on home soil in 1998.
The answer to the question of what it takes to win the World Cup based purely on goals, then, is simple: score first consistently, score lots and have a shot stopper that's on another level.
Here's an overview of goals scored through the years at World Cups.
1930 World Cup
Host country: Uruguay
Winner: Uruguay
Total goals: 70
Matches played: 18
Average goals: 3.9
1934 World Cup
Host country: Italy
Winner: Italy
Total goals: 70
Matches played: 17
Average goals: 4.1
1938 World Cup
Host country: France
Winner: Italy
Total goals: 84
Matches played: 18
Average goals: 4.7
1950 World Cup
Host country: Brazil
Winner: Uruguay
Total goals: 88
Matches played: 22
Average goals: 4
1954 World Cup
Host country: Switzerland
Winner: Germany
Total goals: 140
Matches played: 26
Average goals: 5.4
1958 World Cup
Host country: Sweden
Winner: Brazil
Total goals: 126
Matches played: 35
Average goals: 3.6
1962 World Cup
Host country: Chile
Winner: Brazil
Total goals: 89
Matches played: 32
Average goals: 2.8
1966 World Cup
Host country: England
Winner: England
Total goals: 89
Matches played: 32
Average goals: 2.8
1970 World Cup
Host country: Mexico
Winer: Brazil
Total goals: 95
Matches played: 32
Average goals: 3
1974 World Cup
Host country: Germany
Winner: Germany
Total goals: 97
Matches played: 32
Average goals: 3
1978 World Cup
Host country: Argentina
Winner: Argentina
Total goals: 102
Matches played: 32
Average goals: 3.2
1982 World Cup
Host country: Spain
Winner: Italy
Total goals: 146
Matches played: 52
Average goals: 2.8
1986 World Cup
Host country: Mexico
Winner: Argentina
Total goals: 132
Matches played: 52
Average goals: 2.5
1990 World Cup
Host country: Italy
Winner: Germany
Total goals: 115
Matches played: 52
Average goals: 2.2
1994 World Cup
Host country: USA
Winner: Brazil
Total goals: 141
Matches played: 52
Average goals: 2.7
1998 World Cup
Host country: France
Winner: France
Total goals: 171
Matches played: 64
Average goals: 2.7
2002 World Cup
Host country: South Korea/Japan
Winner: Brazil
Total goals: 161
Matches played: 64
Average goals: 2.5
2006 World Cup
Host country: Germany
Winner: Italy
Total goals: 147
Matches played: 64
Average goals: 2.3
2010 World Cup
Host country: South Africa
Winner: Spain
Total goals: 145
Matches played: 64
Average goals: 2.3
2014 World Cup
Host country: Brazil
Winner: Germany
Total goals: 171
Matches played: 64
Average goals: 2.7 DM