


First published by GroundUp
The current water crisis in the Western Cape has shown why we need transparent decision-making and better access to environmental information and data.
Dealing with the crisis, in large part, depends on asking all of us to alter our lifestyles by reducing water use and recycling water. We have to forfeit some of our comforts, not water gardens or refill swimming pools, and invest some of our income in alternative water supply and water-saving solutions such as water tanks, water-saving devices, and grey water systems.
While the goal of reduced water use can possibly be achieved by regulation and enforcement, actions stemming from the understanding that this is a crisis shared by all — the authorities, citizens and communities — are likely to be much more effective. To build that understanding requires firstly, a sense of community and shared responsibility, and secondly, considerable level of trust in your community, other communities and the authorities.
There is nothing better to create trust than availability of data and information, and transparency of how that information is used in the process of planning and decision-making. Importantly, that information has to be understood and internalised. Cognitive psychology and journalistic experience shows that to effectively achieve such a goal, information has to be suitably packaged. It should ideally be visual, interactive, contextualised, and accompanied by a narrative referring to our experiences.
To the City of Cape Town’s credit, data on the state of water resources (dam levels) are currently easily available on the internet (eg here or here, or directly from Department of Water Affairs and Sanitation) and in the print and broadcast media. We learn not just about the state of the dams today, but also how it relates to the state of the dams in the last four to five years. This lets us intuitively understand the severity of the current situation. Here, we can also find out about the amount of water currently supplied to the city, and compare it to amounts supplied in the past. Most of these data are presented as attractive infographics.
This is a significant improvement from a couple of years ago, when that data were available, but only to those determined enough and able to navigate the intricate system of internet databases and unconventional data formats.
However, numerous additional pieces of highly relevant information are still difficult to access by the general public, journalists or researchers. Data on current rainfall, which is a key element in the drought puzzle, are available from SAWS for individual locations, but these data are not available retrospectively (only current day/month can be seen). The SA Weather Service also provides rainfall maps for current and past months and similar maps are available from Agricultural Research Council. The maps are a slightly better alternative to data from locations, although still difficult to interpret for relating current drought to longer-term weather. Current and retrospective rainfall data can be accessed through the National Oceanic and Atmospheric Administration, but their format leaves them beyond the reach of many.
Data on average and current water use by different sectors is also difficult to come by. We get glimpses from indirect sources (here, here or here). How are the people of Cape Town to strive to use 87 litres per day or to collectively reach 500-million litres per day, while we don’t know whether our efforts are at least matched by other water users dependent on the same source -- agriculture and other small municipalities? Availability of such data would prevent a blame game and unhealthy speculations.
Projecting the dam levels towards the next rainy season (June 2018) is becoming more and more relevant. This is because of the threat of Day Zero, the (hopefully avoidable) day when there is no more water in the city’s dams. Availability of such projections is an absolute must if we are to understand and trust the City’s assurances of having things under control, continuing calls for further reduction of water use and water supply management actions such as water rationing. Yet, such information is nowhere to be found in the official city data.
The gaps are sometimes filled by “independent” sources. In May 2017, GroundUp ran an article summarising where drought-relevant data is to be found. Recently, Daily Maverick presented a rather informative and visually engaging illustration of the state of the dams “as seen from space”. Data on rainfall and stream flow from Jonkershoek collected by SA Environmental Observation Network are summarised, and interpreted in terms of drivers of drought. We at UCT Climate Systems Analysis Group developed data-based stories addressing drought severity, predictability, Day Zero, climate change context and potential of rainwater harvesting.
Our “rainfall monitor” has been used by thousands of people in the last months (including by city water managers). The presentation of rainfall in this tool is perhaps not the easiest to understand, but when you are using it, you are in the driver’s seat, you have data at your disposal. And it is a very empowering feeling indeed.
More recently, we have developed another web tool that allows for interactive exploration of implications to Day Zero of reduced water use and introducing additional water sources. It is a relatively complex tool (although based on very simple principles) that requires engagement from the user’s side. But as we have argued earlier, engagement is likely a successful path to building trust and understanding.
We hope that similar tools and analyses will appear in the near future. We would also like to see data and analyses presented as the City sees them. We hope that these will be permanently available resources, so that the whole Cape Town community can always participate in discussions about the wise use of water resources, not just during the drought. DM
The author is a researcher at the Climate System Analysis Group of the University of Cape Town
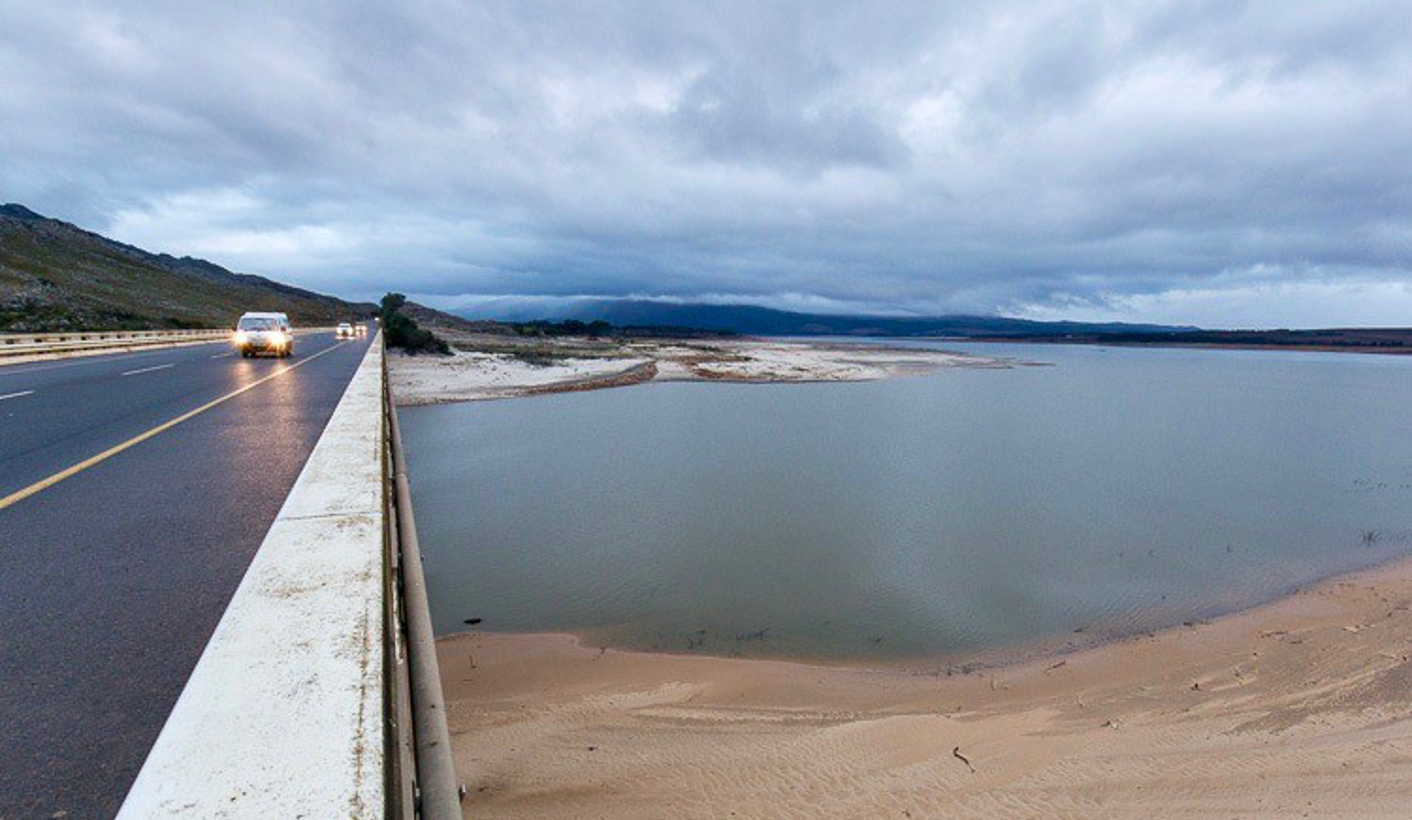
Photo: Voëlvlei is the second-largest dam supplying Cape Town’s municipal water. This photo is from May 2017. Photo: Ashraf Hendricks