MAVERICK CITIZEN Op-Ed
Thousands of lives at risk if South Africa goes ahead with local government elections, says medical specialist

On 21 June 2021, Dr Fareed Abdullah made a submission to the Moseneke inquiry into whether the October local government elections would be free and fair. He submitted that ‘elections be postponed to a time in the future when there is a demonstrable decrease of severe disease, hospital admissions and deaths as a result of high coverage of effective vaccinations’. His submission contains an important analysis of South Africa’s experience of Covid-19 so far, projections concerning a fourth and further waves as well as comment on the vaccination programme. Maverick Citizen is publishing it in full in the public interest.
Though much is known about SARS-CoV-2 since it was first described in Wuhan at the end of 2019, there is insufficient knowledge of the evolution of transmission trends, infectivity and the changing pathophysiology of the Covid-19 disease that it causes. Emergency Use Authorisation of multiple vaccine candidates and their rapid deployment in many regions of the globe provide some insights into the possibilities of controlling the spread of the disease and reducing rates of severe manifestations of the disease, hospitalisations and death.
Any exercise to predict the future trends of the transmission of infection, the evolution of transmissibility (contagiousness) and the changing pathogenesis and presentation of Covid-19 in population subsets must be done with both caution and spades of humility.
Many factors influence the way in which we navigate our way through figuring out what we are likely to face over the coming period. Host, pathogen and environmental factors all contribute to the evolution of the pandemic in the local context.
Natural immunity and vaccination coverage are critical host factors. While both these factors will contribute to the size and shape of future spread, they have not been sufficiently enlightening for our third wave experience.
Natural immunity in Gauteng resulting from the second wave varies considerably from 5-43% (Mahdi) across the provincial locales, and there is some evidence of sub-district variation (up to 71%) arising out of prior natural immunity from the first wave (Myers). The ability of variants of concern (VOC) to partially escape both natural and vaccine-induced immunity is difficult to estimate and weakens the predictive value of prior Covid-19 infection and vaccination status.
Age, comorbidities and body mass index (BMI) are other important host factors to take into account in efforts to forecast disease severity. Unfortunately, outside of the Western Cape province and the medical schemes members, almost no systematic data exists to fathom their effect. Social class is likely to feature as a factor in health status, agency to control exposure and healthcare options including access to home-based treatment alternatives such as oxygen concentrators, and even access to vaccination.
Population density, mobility and modes of transport are also important factors that fuel transmission. It is difficult to measure the impact of these factors on transmission dynamics, though a common wisdom is emerging that indoor gatherings and nighttime movement are important factors in driving new infections. Hence, the focus on gatherings and the curfew in the recent Alert Lockdown Level 4 announcement.
What is more difficult to fathom are seeding events and wave triggers.
Seeding events that lead to cluster outbreaks in the home, shopping centres or congregant settings are due both to chance and to human behaviour. The sequence of events that lead clusters to coalesce to a critical tipping point that then sets off a wave is less well understood.
What triggered the second wave in the Eastern Cape? And why did the Northern Cape come first in the third wave? Factors such as population density and the geographic spacing of small towns in rural provinces and regions are likely to affect the height of the peak, the rate of its rise and fall and the duration of the wave.
It is likely that the Delta variant that is more transmissible than other variants shows a rapid rise to a high peak and a precipitous fall as seen in the India second wave or the second wave in Portugal (due to the Alpha variant which was similarly more transmissible than the ancestry virus). We have not yet seen the peak in Gauteng but the rise is clearly due to the Delta variant based on the latest genomic analysis reports.
Winter and summer were initially expected to play a role in the timing of waves in the way that seasonal changes drive the annual influenza epidemic, but this is no longer believed to have any influence on the timing of waves, which seem to be bi-annual every six months with low levels of NPIs or more protracted across many months of the year if strict NPIs are possible. All of this gives rise to serious unpredictability, even though there might be some knowns which may be summed up as the pandemic continuing everywhere until substantive vaccine coverage is achieved.
Having stated the shortcomings of our knowledge and know-how in the introduction, we are able to turn our attention to what we have learned about this pandemic in an attempt to figure out what is likely to unfold over the medium term. The analysis of available data and a discussion explaining how we may use this analysis is set out below.
Metrics of analysis – case and death rates
There are numerous measures used by the NICD and other institutions and individuals to track the pandemic. These include the daily absolute number of cases, the yield or positivity rate, the rolling seven-day average, the three-day rolling average, official hospital admission reports, daily reports of hospital deaths and weekly excess death reports from death notifications.
In this submission, we propose to mainly use a combination of two measures to monitor the pandemic trends over time at the national and provincial level. For ease of comparison across provinces we are using rates as opposed to absolute numbers. These are the daily case rate per 100,000 population and the excess death rate per 100,000 population. In the case of the daily case rate, the temporality of the wave form is easily observed, and deductions can be made about when a wave commences, when it peaks and when it declines. The case rate is biased by the volume of testing and the rate is undercounted in provinces and municipalities where the testing rates are low.
The excess death rate per 100,000 population is a more accurate measure of the scale of the pandemic, as it records all deaths whether these occurred in a health facility or at home in the community. This death rate lags behind the case rate by between two to three weeks and provides a later shifted death wave. This is a more accurate measure of the wave severity for both duration and peak. These two measures provide an integrated estimate of both the temporality and intensity of the pandemic in a wave. Cumulative excess deaths also provide the most accurate measure of the severity of impact of the pandemic.
The source of the case rates is that reported by the NDOH daily reflecting both public and private sector tests. The excess deaths are from the weekly report of the SAMRC Excess Mortality report. These data have been uploaded to STATA 16 by Professor Jonny Myers who has then very kindly generated these images of LOWESS smoothed rates for this submission.
There are other measures used to track cases, such as the seven-day rolling average and the official statistics of Covid-related deaths are monitored by the NICD from death reports from public and private hospitals. With cases the estimates are skewed by the level of testing. The higher the number of tests performed, the higher will be the number of positive tests or cases per population, so provinces that test more will have higher rates.
The case rates will need to be adjusted for the positivity yield to get one closer to the case rates. The most recent positivity yield reported by the NICD was 25%, meaning that the number of untested positives is likely to be much higher.
Having reflected on the case and excess death rates by province over the first, second and third waves, we suggest that the following should be considered in navigating possible current and future trends for the pandemic in our country.
The fourth wave – when?
Global experience over the last 18 months has shown that only draconian lockdowns as seen in Wuhan, international isolation as seen in New Zealand and high levels of vaccination coverage as seen in Israel, have been able to control future waves of the pandemic.
A fourth wave, and even possible future waves, is inevitable until vaccine coverage has reached a point where new infections and the risk of new mutations is severely reduced. As South Africa is unlikely to reach the levels of vaccine coverage required, there is no reason to believe that we will not experience a fourth wave before the year is over.
Figure 1a below shows the peaks and troughs and the inter-wave periods over waves one, two and three for the country as a whole. If the regularity of the first three waves recurs, then a fourth wave can be expected in the fourth quarter of the year.
Figure 1a. South African national case rate
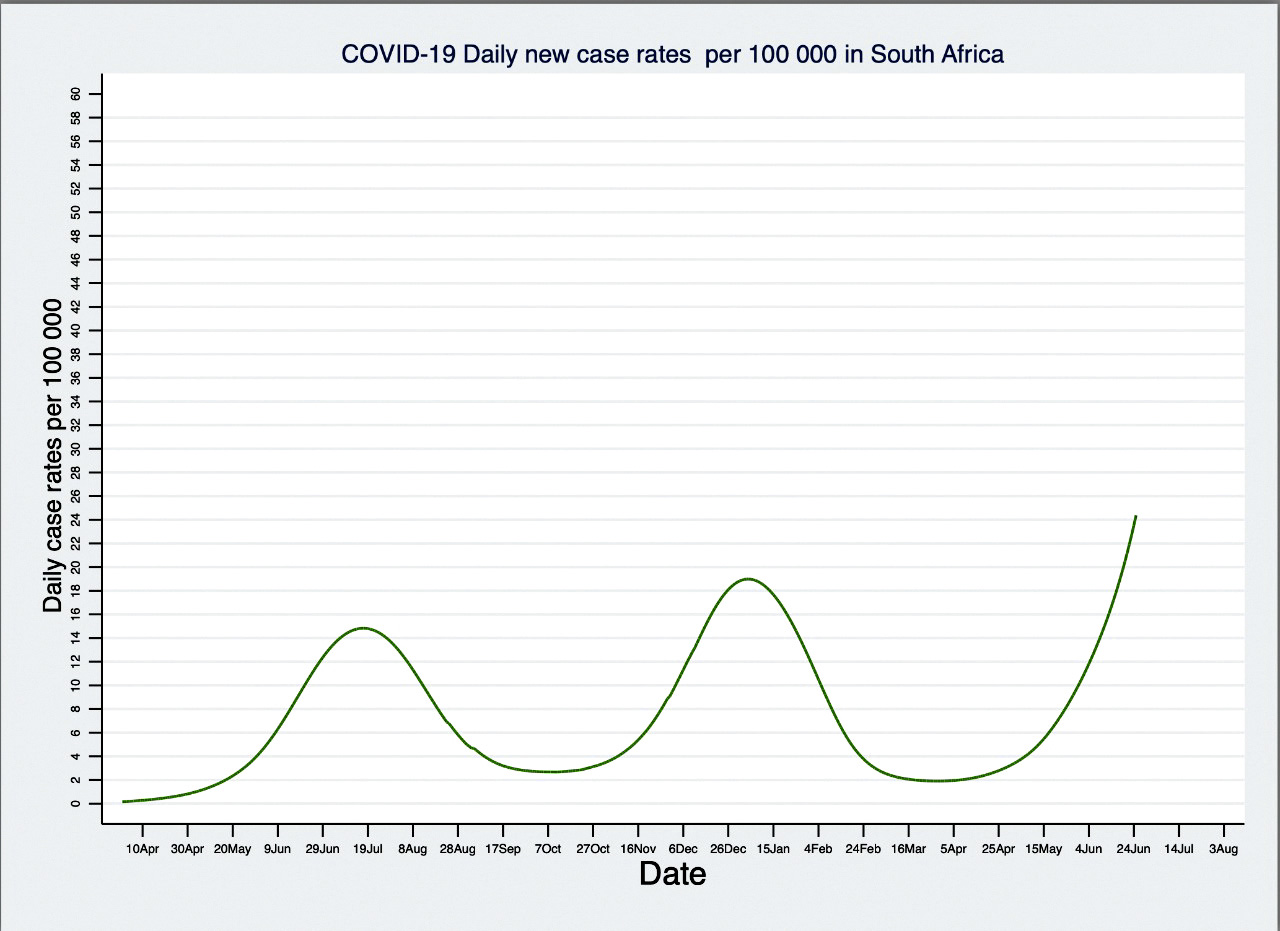
The peaks of previous waves appear to be about six months apart and once there are signs of when the third wave will peak, we will be able to confirm the pattern. It is difficult to explain the regularity of this pattern, so this is merely an observation of the pattern that is emerging. This is not necessarily the pattern in all countries and there are countries with a completely different pattern.
It would also appear that the time between the end of the first and second waves and the beginning of the next wave was between eight and 10 weeks. If this pattern were to continue between the third and the fourth wave, then the latter could be expected to commence in the first two weeks of October and would be well established in the exponential phase by the last week of October. There is also a strong possibility that the third wave could end a few weeks later and the fourth wave would start closer to the end of October as shown in Figure 1b.
Figure 1b. National case rate 0 straight line projection
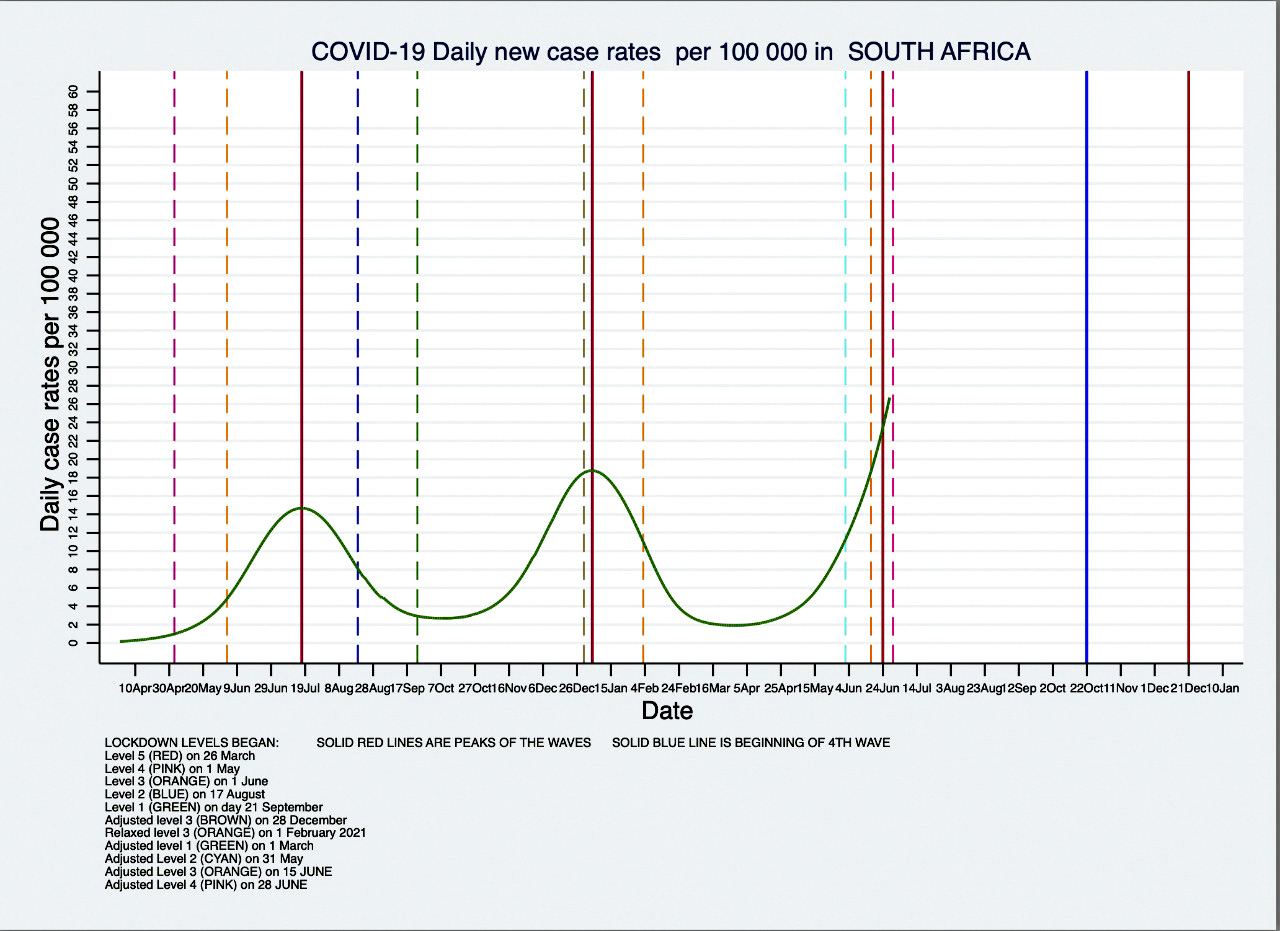
If the fourth wave were to set off at the end of October, then a host of gatherings across the country would play a major role in triggering the fourth wave and possibly increasing its size by seeding new infections throughout the country.
Interprovincial and local variability
The national picture masks local variation in the trajectory of the first, second and third waves. A review of the provincial breakdown of the first, second and third waves will offer insights into the likely local scenarios for the pandemic during the expected fourth wave.
From Figure 2 below, it is evident that there is substantial inter-provincial variation in the trend lines for cases and reported deaths. The Northern Cape and Free State are interesting to observe. In the case of the Northern Cape the timing of the peaks and troughs are completely out of kilter with the national trend line and provinces such as Gauteng and the Western Cape. In the case of the Free State, both the case rates and the excess death rates show an undulating pattern that does not have the distinct peaks and troughs of provinces such as the Eastern and Western Cape. The northern rural provinces of North West, Mpumalanga and Limpopo showed very small first waves, larger second waves and will perhaps see much larger third waves.
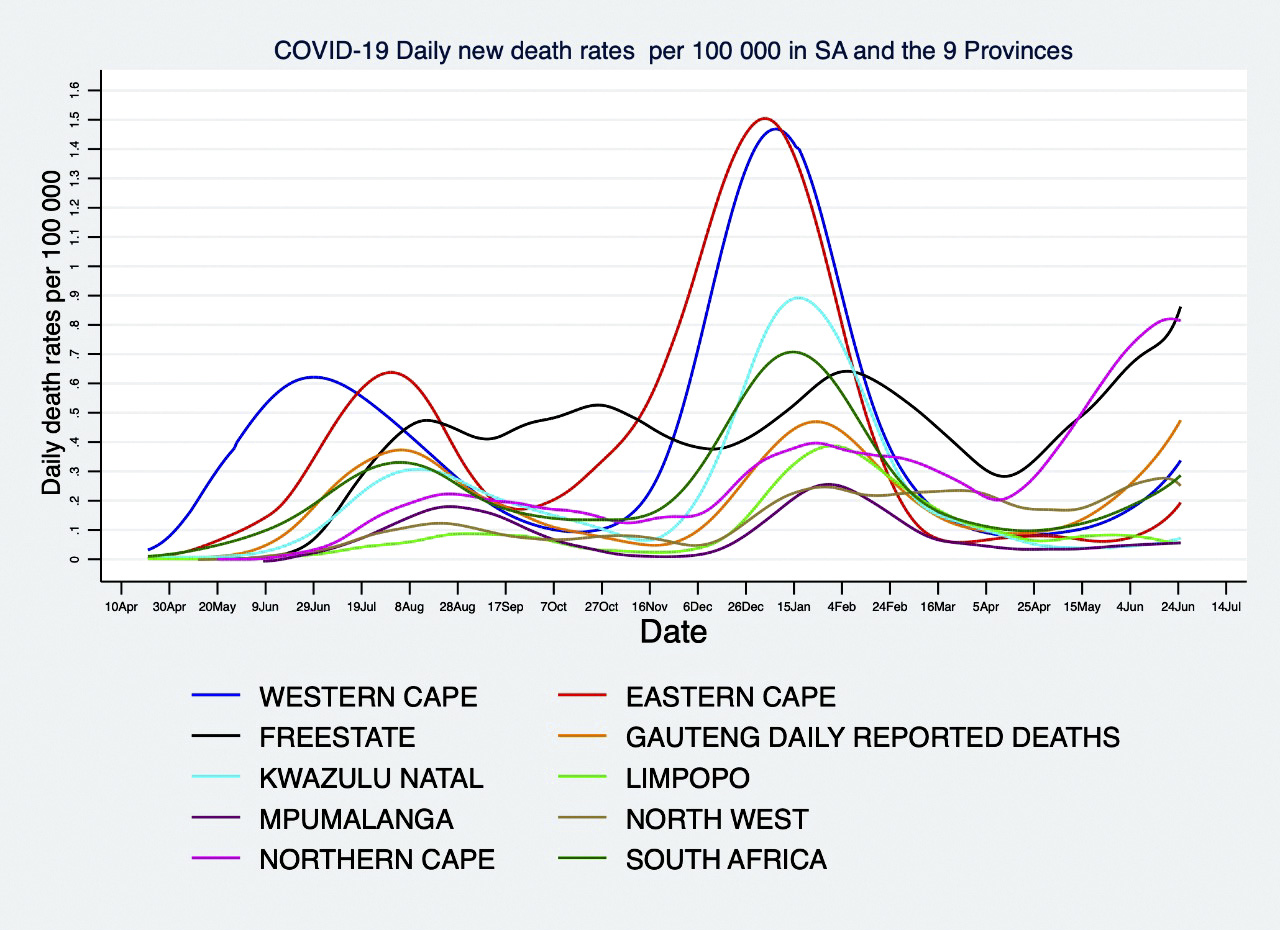
Figures 2 and 3 below provide a graphic description of the inter-provincial variability for both the case rate and the reported death rate. At no point does the trough of all provinces align with the national average and this is even more evident in the death rates.
Figure 2. Case rates per 100,000 population, South Africa and provinces (JM)
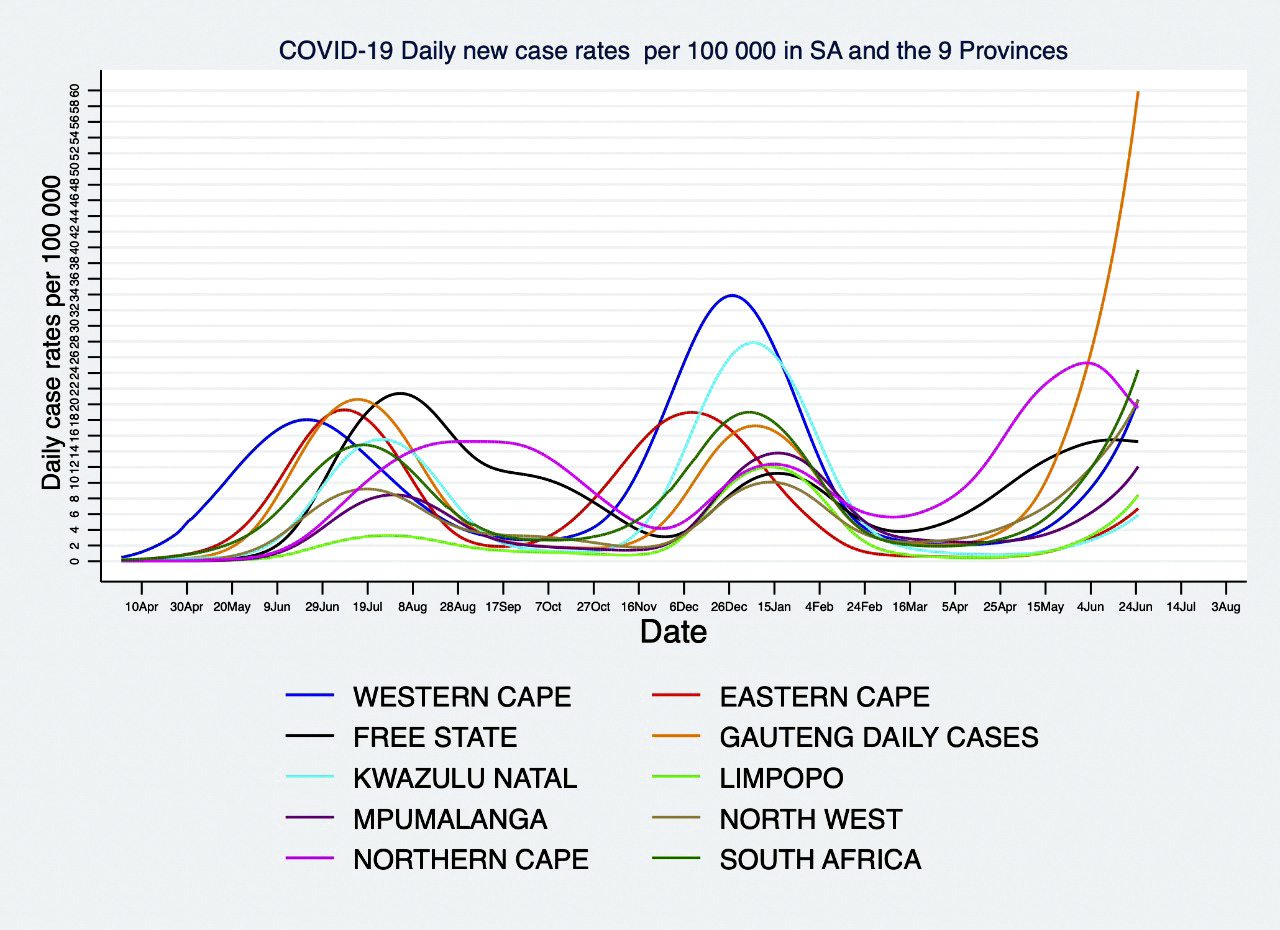
Figure 3. Reported deaths per 100,000 population, South Africa and provinces
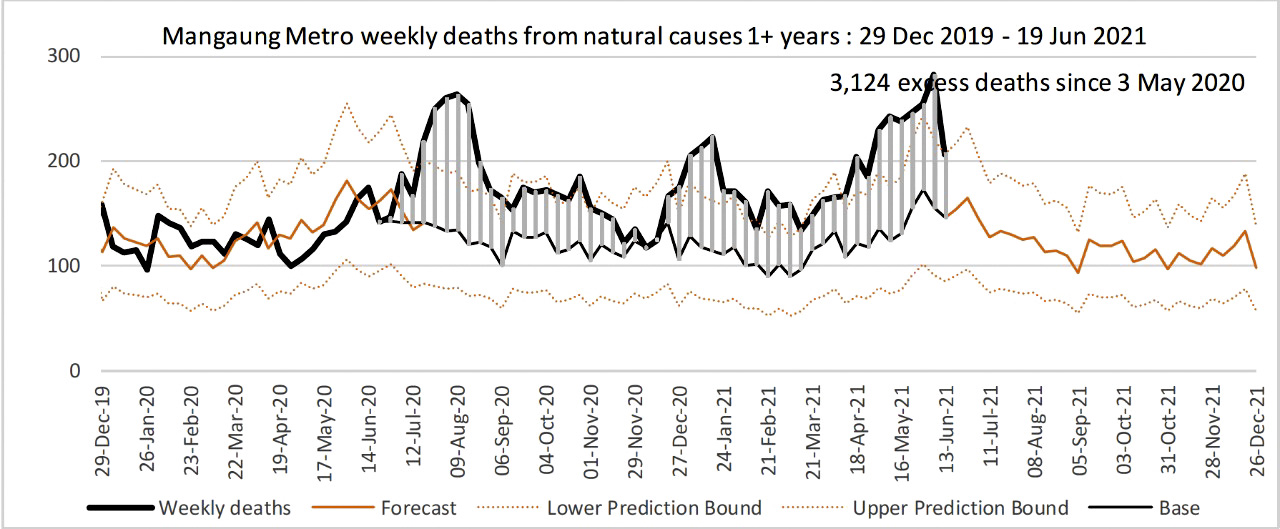
Drilling down further to the metro municipalities, one sees a similar variation (see figures below for metro excess death rates across all three waves). One can see the wide variation in the wave patterns across the metros when comparing eThekwini and Nelson Mandela Bay which have had two peaks, with Johannesburg which has three very distinctive peaks. The wave pattern for Mangaung is remarkably different and could be said to have had two double waves with only a single trough in the last two months of 2020.
Figure 4. Excess deaths eThekweni Municipality (SAMRC Weekly Report)
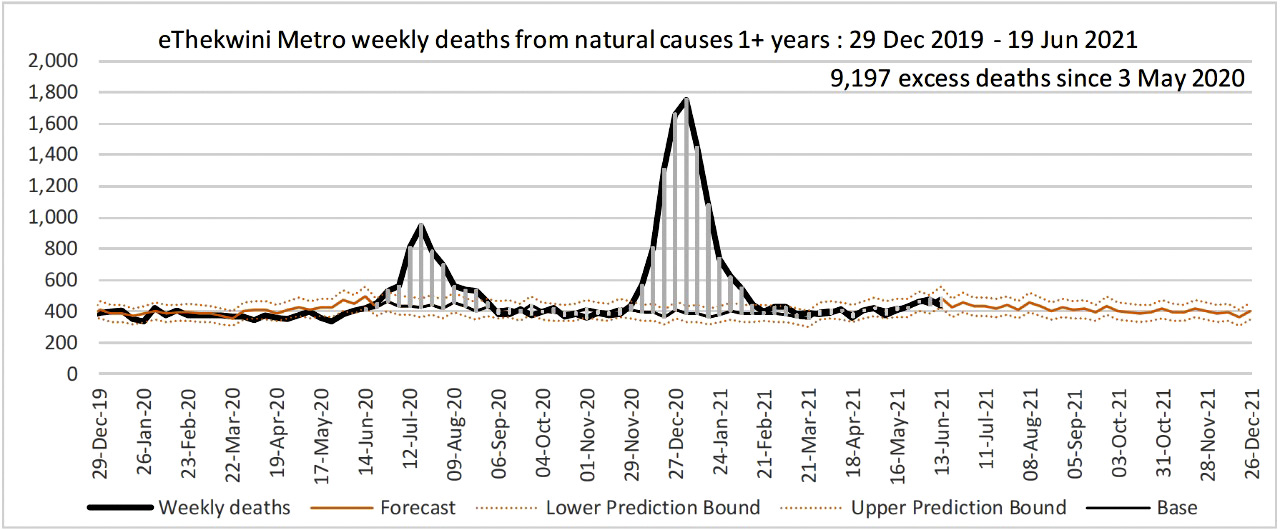
Figure 5. Excess deaths Nelson Mandela Bay Municipality (SAMRC Weekly Report)
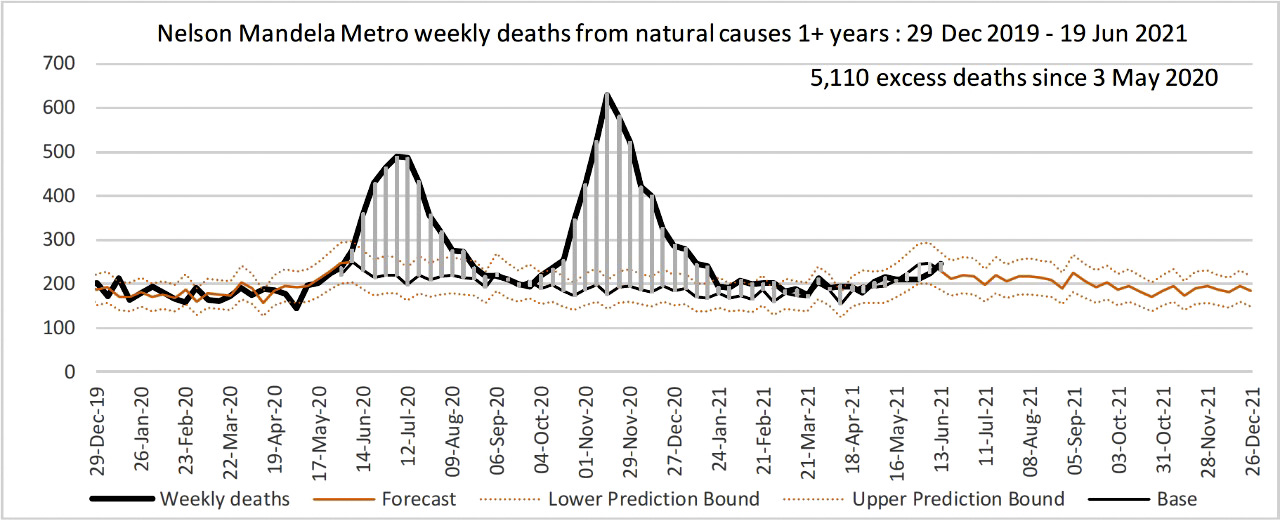
A comparison of the eThekwini and Nelson Mandela Bay municipalities in Figures 4 and 5 above, show an overall similar pattern with slight differences in the heights of the peaks. The most important difference is temporal in that NMB is already peaking (second wave) before the eThekwini wave has even started.
Figure 6 below shows the Johannesburg municipality is experiencing a significant third wave that is already higher than the first and second waves. Figure 7 below is remarkable in its difference when compared to the distribution of excess deaths shown in Figures 4, 5 and 6.
Figure 6. Excess Deaths Johannesburg Metro Municipality (SAMRC Weekly Report)
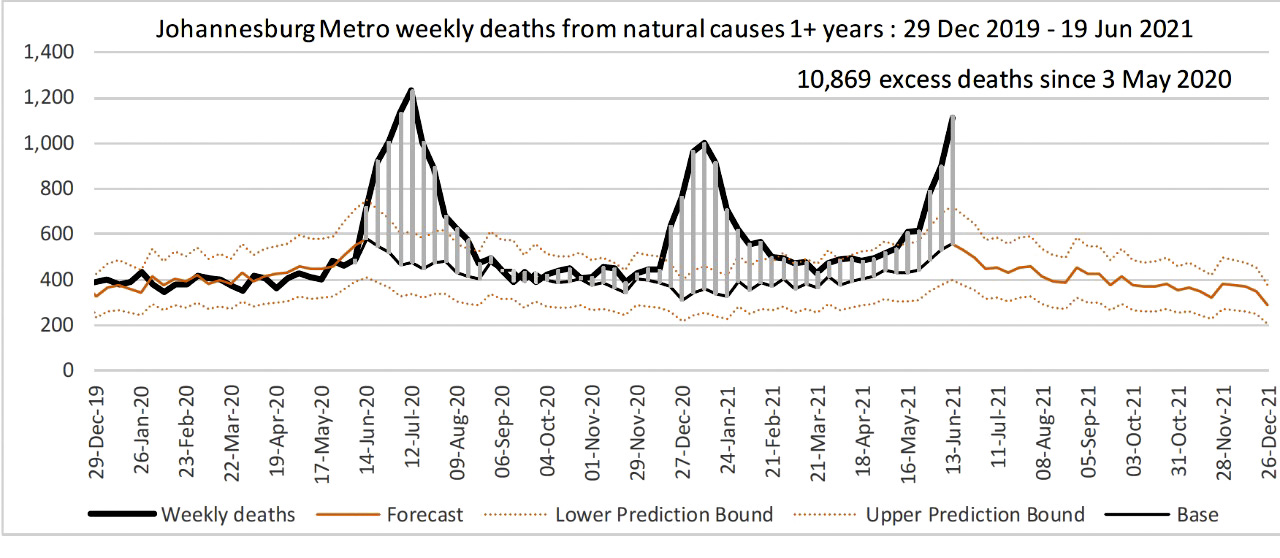
Figure 7. Excess Deaths Mangaung Metro Municipality (SAMRC Weekly Report)
The conclusion that we draw from these data is that the inter-provincial and local variation of transmission dynamics across the country will mean that there will always be some parts of the country which will be at a point in the trajectory of the fourth wave where it is experiencing an exponential rise.
This will trigger a higher degree of the spread of infections or voluntary or involuntary limitation of movement of individuals as they adjust their behaviour. This could disproportionately affect turnout at the polls on election day.
Vaccines and variants
The impact of the vaccination programme on future trends of the pandemic in the last quarter of this year are an essential consideration in determining the public health risks of holding an election on 27 October 2021.
The currently available J&J and Pfizer vaccines have reduced efficacy against the Beta variant for mild and moderate illness, but the Delta variant now appears to be dominant in most provinces and will soon be dominant nationally.
Recent evidence from the UK shows that there is excellent AstraZeneca and Pfizer vaccine efficacy for severe Covid, hospitalisation and death for the Delta variant. As J&J is the same type of vaccine as AZ, it can be expected to perform similarly well.
A single shot of the J&J vaccine may be less efficacious against the Delta variant, and the US CDC is considering boosting the J&J with a second shot or a booster with another vaccine. The jury is still out on whether J&J will need a booster against the Beta or Delta variants and more evidence is imminent.
In light of the low vaccine coverage, the reduced efficacy of the vaccines against the Beta and Delta variants for mild to moderate disease, the inability of vaccines to prevent infection and transmission, and the very likely slowdown of the vaccine rollout due to the very high third wave we are experiencing in Gauteng, North West, Western Cape and Limpopo and potentially other provinces, the vaccine rollout is likely to be of limited immediate impact.
Even in countries such as the UK, there is a surge in infections even though vaccine coverage is among the highest in the world.
The limited supply of vaccines and the onerous registration requirements of the EVDS system will mean that the country is unlikely to vaccinate sufficient numbers of adults to impact significantly on the transmission dynamics of a fourth wave.
In addition, there is always the likelihood of a new mutation. So far, we have had three different strains in each of our three waves. With so many regions of the world under-vaccinated, we could very easily see a new strain that more fully escapes both vaccine-induced and natural immunity during a fourth wave.
Health service capability
It is important to reflect on the ability of the health services during the first, second and third waves and how this would impact on their performance in the fourth and future waves. While Gauteng, the Western Cape and KZN may meet the minimum capacity requirements for a substantial health system response, especially in their respective private sectors, many of the other provinces may not have the capacity to respond adequately to a bigger wave, as is currently seen in Gauteng. This was seen in the Eastern Cape in the second wave and is reflected in the high mortality seen in that province in the second wave.
Events such as election rallies, local party branch meetings and door-to-door campaigns with groups of party electioneers must be considered extremely high risk for super-spreader events.
We have unfortunately not displayed the ability to optimise our health services to create a special capacity to manage the third wave and are unlikely to be able to do so in the fourth wave. The private sector is constrained by its high and rigid fee structure that limits how many more patients it could absorb.
The public sector has really struggled to rapidly increase its capacity to accommodate a flood of patients in all three waves, and especially in regions or provinces where the case rates were much higher than expected. There are structural weaknesses in the public sector and rigidities which limit its agility. Managing capacity and leadership were often inadequate when extraordinary measures were required.
In provinces such as Gauteng in the third wave, even provinces with a strong public sector infrastructure were unable to cope. Any notion that risks can be taken as the public sector hospitals will be able to respond are unwise.
Conclusion
The peaks and troughs of the national wave have taken on a regular pattern, even while the underlying sub-national trends display significant diversity as shown in the figures above. There is no guarantee that the fourth wave will follow the same pattern; only a reasonable expectation that whatever is driving this regular pattern in South Africa will not have changed between now and the next two quarters.
The third wave has shown more interprovincial variability than the first and second waves as evidenced by the Northern Cape declining rapidly and the Free State peaking while all other provinces are rising.
The Gauteng “skyrocket” is a completely new phenomenon. It is most likely that this is driven by the Delta variant and it is therefore likely we will see these steep peaks in other provinces soon, or in the fourth wave.
The idea that an election can be held in a trough window between the third and fourth waves seems like wishful thinking.
Any decision to proceed with an election will have to be taken with the full understanding that there will be significant risk of super-spreader events either across entire provinces or within municipalities and smaller localities.
The enforcement of regulations governing social distancing and gatherings will require public policing and crowd control policing at levels never seen before in the country. The EFF march on SAHPRA last week is a warning that parties will not be able to enforce social distancing while campaigning for the vote in the local government elections.
In light of the limited impact of natural immunity on the prevention of new infections, and the cyclical nature of the rise and fall of new infections, we think it is common cause that there will be a fourth wave in South Africa when one takes into account the averages of the national dataset. Other countries such as India and Portugal have also experienced a similar cyclical wave pattern.
The fourth wave could be smaller than the third wave in provinces such as Gauteng that are experiencing a large third wave, or it could be large if new variants become dominant in the country or in some provinces. If the pattern of the first three waves is repeated in the fourth wave, it is likely to begin during October and peak in December or early January 2022 as was the case with the second wave.
Provinces such as the Northern Cape and Free State that are starting to see senescence in their third wave, could start their fourth waves even earlier. The slow rollout of the national vaccination effort means that there will be insufficient coverage of the adult and adolescent populations to significantly impact on the number and rate of new infections when a fourth wave establishes itself in multiple provinces.
The main benefit of the vaccination programme will be the reduction in moderate to severe disease, resulting in fewer admissions and deaths in the fourth wave, but the reductions are likely to be marginal as this is dependent on vaccination coverage achieved by the end of September.
The capacity created in public and private hospitals that results from these reductions are likely to be taken up by the category of people that were not admitted to hospitals in previous waves and had to fend for themselves with home oxygen and home care, or succumbed to Covid-19 without any care or before reaching the hospital.
In essence, it is our submission that the hospitals will experience the same pressure in the fourth wave as in the third and previous waves.
All in all, any gatherings or events at which people will congregate in small or large groups, is likely to rapidly multiply the seeding of cluster outbreaks and contribute to increasing the size and distribution of fourth waves in provinces and municipalities. Given the limitations and rigidities of both the public and private hospitals systems, this could lead to high rates or disability or death in the fourth wave on the scale of any of the previous waves seen in the country.
In conclusion, we recommend that the elections be postponed to a time in the future when there is a demonstrable decrease of severe disease, hospital admissions and deaths as a result of high coverage of effective vaccinations.
If government’s plans to scale up the vaccination rollout to 300,000 vaccinations a day materialise, the possibilities exist for proceeding with an election sooner rather than later. And if government diversifies its vaccination strategy to allow companies to vaccinate their employees and also bring on-stream mass vaccination sites, a safe date for an election could be brought even nearer.
An unprecedented vaccination drive powered by well-oiled machinery that ensures efficient and effective execution is needed if there is any hope of allowing an election to happen next year, along with the resumption of normal life.
Proceeding with elections now, as things stand and as we know them to be, will put the lives of thousands of South Africans at risk. DM/MC
The author would like to thank Professor Jonny Myers, UCT Emeritus Professor of Public Health, for producing the graphs and his extensive comments on this submission.
Dr MFA Abdullah is a medical doctor and a specialist in public health medicine. At the present time, he holds the position of Director: Office of AIDS and TB Research at the South African Medical Research Council and holds a part-time appointment as a public health specialist and HIV clinician at the Steve Biko Academic Hospital.
Since April 2020, he has been a member of the Steve Biko Academic Hospital Outbreak Response Team working as a clinician in the Covid-19 wards and assisting with fundraising and the provision of Covid-related equipment, staffing and infrastructure. He was part of the Covid-19 vaccination team at SBAH.
Previously, he was a senior manager in the Western Cape Health Department for 12 years and he was CEO of the South African National AIDS Council from 2012 to 2017. Currently, he is co-chair of the SA National TB Think Tank.
"Information pertaining to Covid-19, vaccines, how to control the spread of the virus and potential treatments is ever-changing. Under the South African Disaster Management Act Regulation 11(5)(c) it is prohibited to publish information through any medium with the intention to deceive people on government measures to address COVID-19. We are therefore disabling the comment section on this article in order to protect both the commenting member and ourselves from potential liability. Should you have additional information that you think we should know, please email [email protected]"