



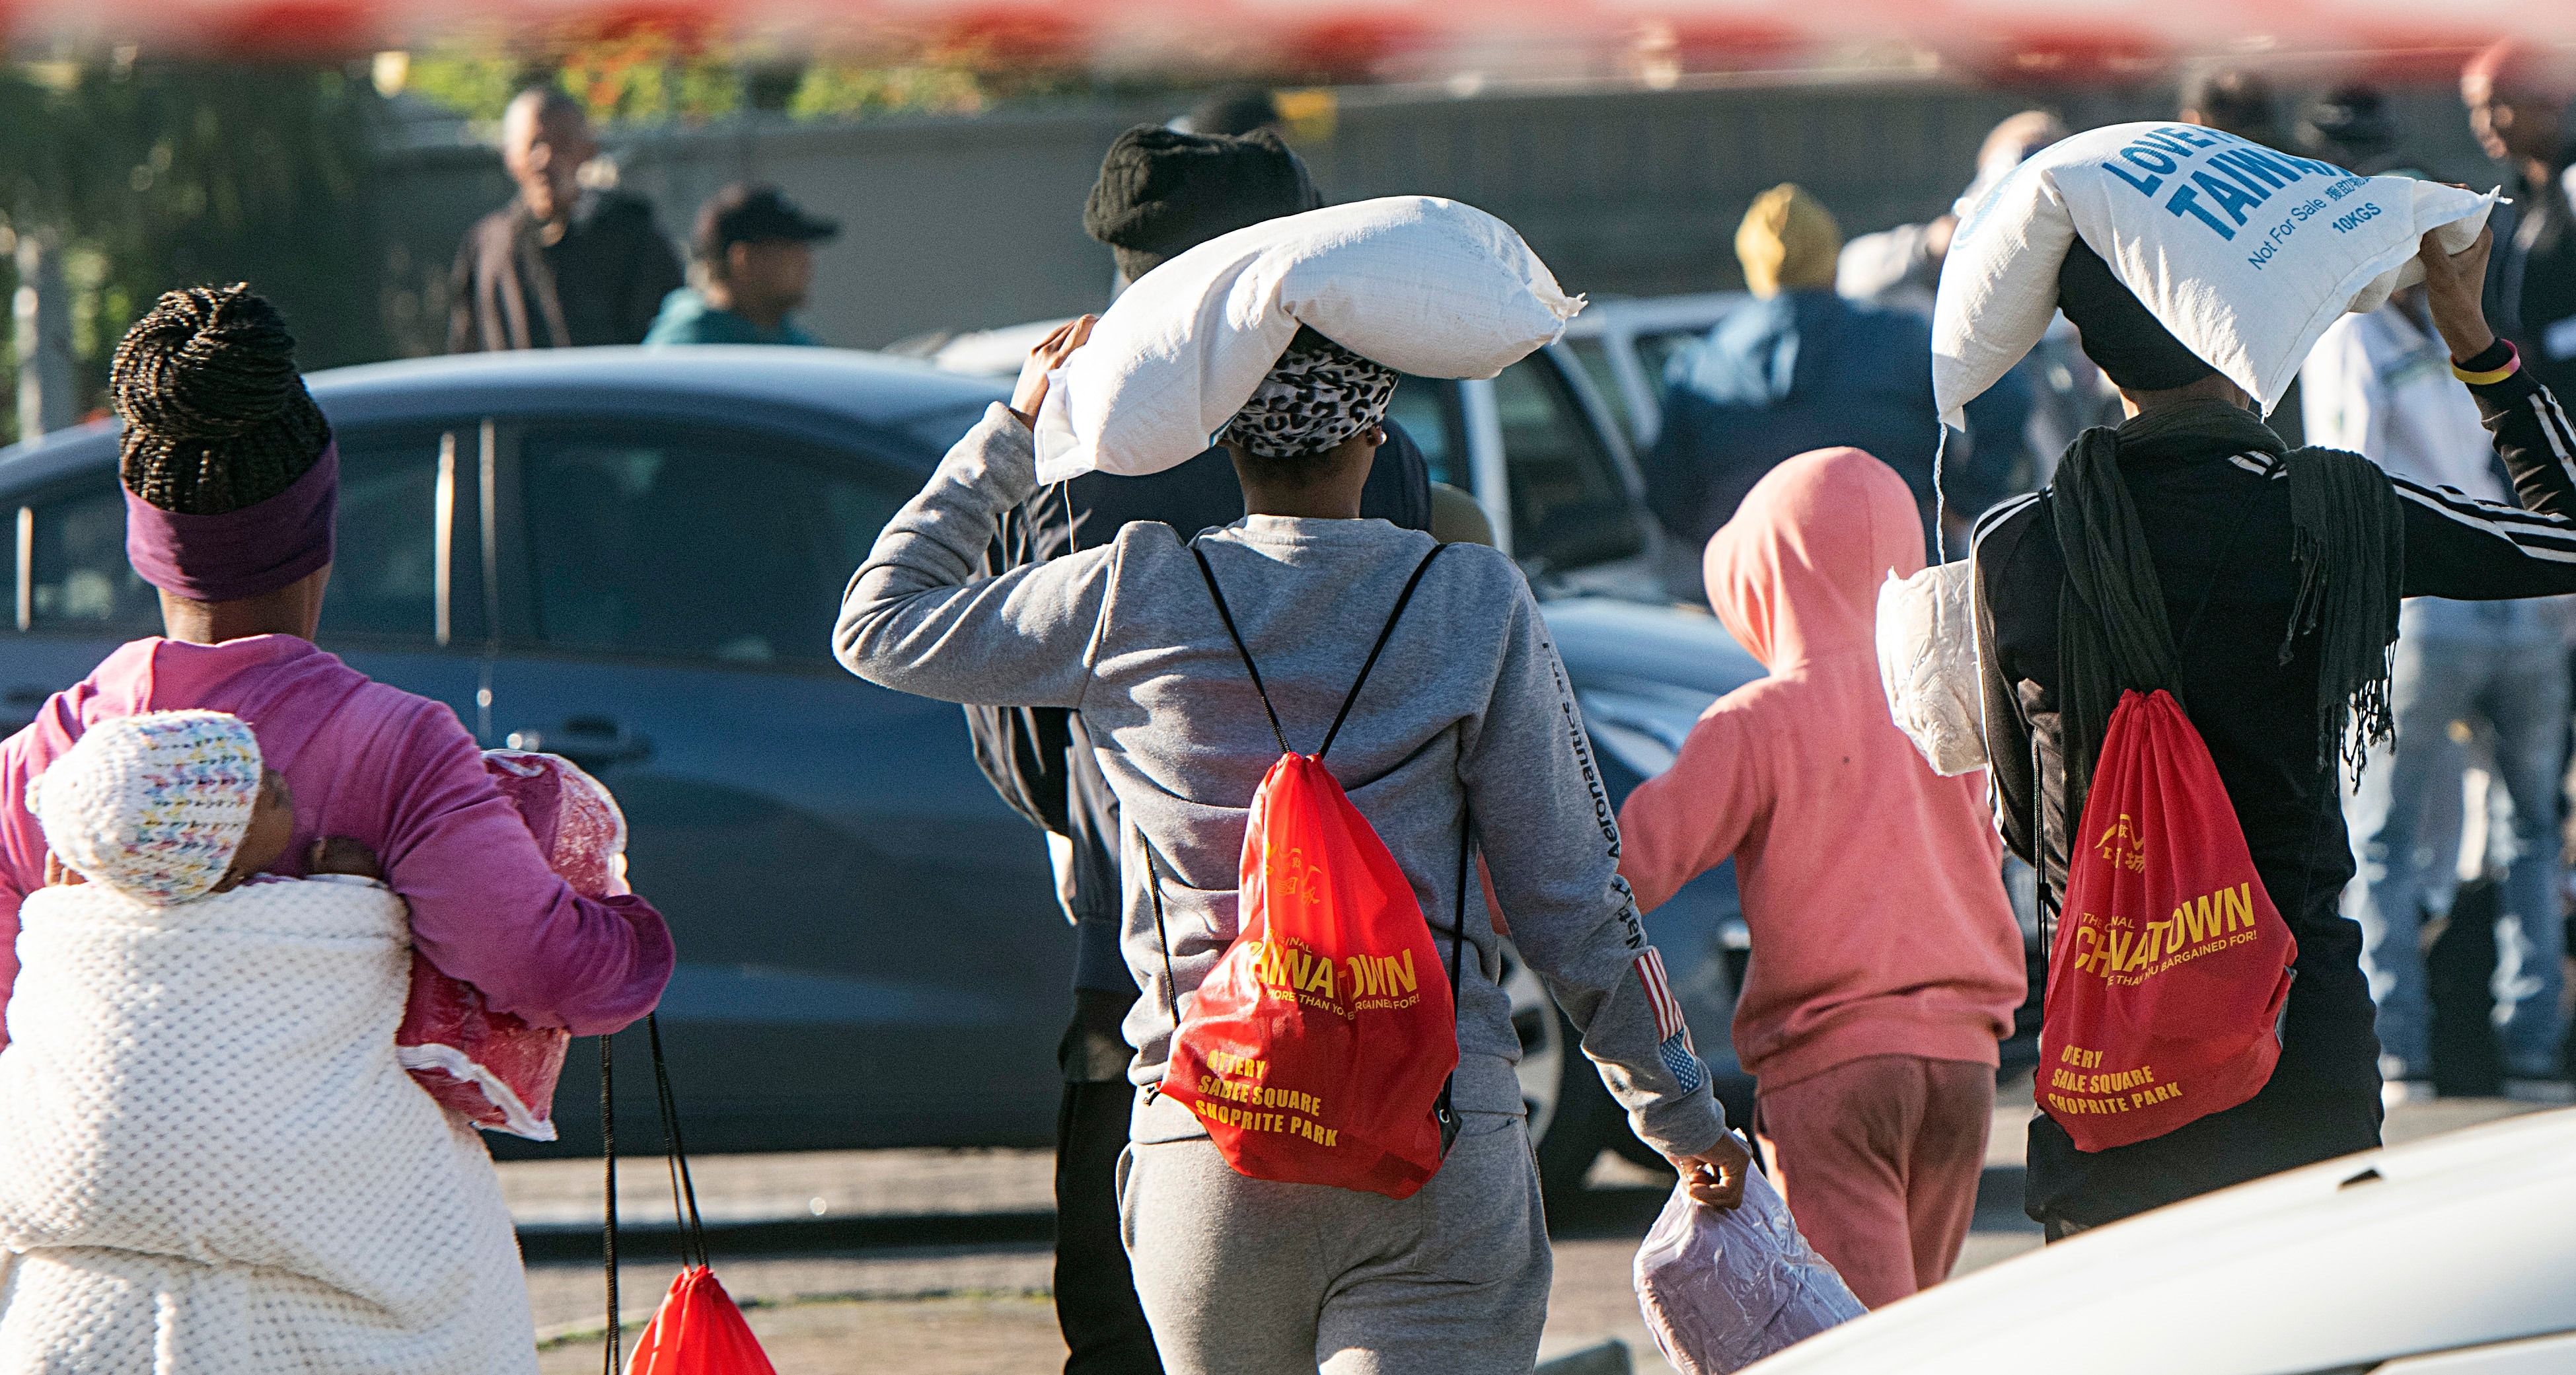
 In 2023, 18.2 million out of 60 million South Africans were living in extreme poverty, which is reflected in the country’s worsening hunger crisis. (Photo: Brenton Geach / Gallo Image)
 South Africa has the highest income inequality of any country with comparable data. The Gini coefficient — a measure of how evenly income or wealth is distributed within a nation, on a scale from 0 (perfect equality) to 1 (perfect inequality) — is 0.63 for South Africa, compared to 0.25 to 0.35 for European countries, 0.41 for the US, and 0.58 for sub-Saharan Africa overall.
Wages in South Africa are even more skewed: the country’s wage Gini is 0.69. The top decile holds between 71% and 85% of total wealth, while the bottom 50% holds only 4% to 7%.
“The inequality is in wealth and income distribution, and with that comes unequal power distribution,” said Marc Wegerif, associate professor of development studies at the University of Pretoria.
In 2023, 18.2 million out of 60 million South Africans were living in extreme poverty with less than $1.90 (approximately R35) per day. According to the Pietermaritzburg Economic Justice and Dignity’s Household Affordability Index, 74.8% of black South Africans live below the upper-bound poverty level of R2,846 per person per month. The World Bank’s figures show poverty has flatlined at around 62-63% since 2008.
“The state has abdicated responsibility for trying to ensure everyone has the right to food realised, and that’s carried on,” said Wegerif.
Post-apartheid gains in reducing food insecurity were reversed by the 2008 financial crisis, and liberalisation brought no safeguards against global economic shocks.
“We can’t stop those wars [but] it becomes all the more reason why we need to have in place a framework of policies that would help stabilise food affordability,” said Wegerif.
Malnutrition in children
More than 1,000 children die from malnutrition each year in South Africa, compared to approximately 352 in Brazil, which has three times the population.
When malnutrition is counted as an underlying cause, the real figure could be closer to 10,000 a year.
According to the University of Cape Town’s Children’s Institute, severe acute malnutrition (SAM) is associated with 30.9% of audited deaths of children under five in South Africa.
SAM rates dropped from more than 10 per 1,000 children in the early 2000s to 1.5 per 1,000 in 2020, then rose 33% between 2020 and 2022. In mid-2023, the Department of Health reported a further 20% increase, to 2.4 per 1,000. The highest rates are in the Free State (6.4 per 1,000) and the Northern Cape (6.2 per 1,000).
For every child who suffers from SAM, approximately 135 children are affected by stunting, which is measured by low height/length-for-age, and indicates prolonged undernutrition. One in four children in South Africa are stunted.
“When you look across all the information, what is clear is that we’re not beating this problem of stunting … and it does seem clear that it’s getting worse to some extent,” said Wegerif. Improvements appear linked to the expansion of the grant system, which increased food access, but not necessarily access to nutritious food, particularly for pregnant women and children in their first two years.
“The challenge with tracking stunting trends in South Africa is that different surveys over time have used varying methodologies, sample sizes and levels of data quality, making direct comparisons difficult,” said the nutrition lead at Hold My Hand, incubated by DGMT, Liezel Engelbrecht.
What recent research increasingly suggests is that we may be underestimating the true extent of linear growth faltering. There is an urgent need for stronger, more representative monitoring systems.
“But we’re currently not supporting women in the first 1,000 days enough, especially women in the informal sector that are not supported by any form of maternity protection,” said Engelbrecht. Pregnant women are more vulnerable to unemployment and income loss, and that vulnerability increases both during and after childbirth, she said.
A plan for food security?
An evaluation by the Department of Planning, Monitoring and Evaluation found that the National Food and Nutrition Security Plan (NFSNP) for 2018 to 2023 fell short of its targets due to budget limitations. Parliament’s portfolio committee acknowledged the limited progress and noted that targets had been going in the wrong direction.
South Africa is in a crisis of food insecurity and stunting, said Wegerif, and it shouldn’t be happening with the resources the country has. The NFSNP expired in 2023. No replacement has been adopted, and the national food and nutrition security council, meant to coordinate state and non-state action, has not met.
“The fact that we don’t even have any national plan is really worrying and does speak to a lack of commitment and budget or effort towards addressing food security,” said Wegerif. “I do believe if you don’t put resources behind plans and policies, then the chances of them getting implemented are far less.”
Provincial breakdown of hunger
Below is a provincial map of hunger across South Africa, drawn from the National Food and Nutrition Security Survey, a baseline of food and nutrition security across all nine provinces, using standardised tools to measure household food insecurity, hunger, dietary quality and child nutrition.
The survey was designed to provide a provincial and national comparability, and provides enough information to give an estimate of the state of hunger across the country.
Eastern Cape
Food consumption is dominated by nutrient-poor foods such as cereals, sugars and oils. The province’s mean dietary diversity score — a measure of how many different food groups households consumed in 24 hours — of 4.71 is below the national average.
Nelson Mandela Bay has the highest district stunting risk at 40.3%. Adult obesity is 32.5%, and 8% of children under five are overweight. High food prices are the dominant shock (66% of households), followed by input prices (55%). Where households have land, 37% use it for food production, with livestock, sheep, goats and poultry, an important income source.
Free State
Despite being known as the Breadbasket of South Africa, agricultural output does not translate into food security for most residents, and 73% of households live below the food poverty line, while the mean dietary diversity score of 4.01 is among the lowest nationally.
High input prices affect 81% of households; food prices 59%. The child overweight rate of 12.5% is the second-highest nationally, indicating that calories are more accessible than nutrition.
Gauteng
Food insecurity here is more closely linked to employment and social protection than to agriculture. The province records the highest proportion of vegetable production under households with land (71%).
The child overweight rate of 3% is the lowest nationally. High input prices affect 77% of households; food prices 40%. The West Rand district has the highest severe stunting in the province at 34%.
KwaZulu-Natal
The province has South Africa’s highest adult obesity rate at 39.4%. The uMzinyathi district had the highest proportion of households worried about food running out, and the uThukela district has a severe stunting prevalence of 48.8%.
High food prices affect 81% of households, and the province was severely affected by the April 2022 floods, which disrupted the food situation for 60% of households.
Limpopo
Limpopo presents one of the most important contradictions in the national data. It has the lowest severe hunger rate nationally, at 4%, and 85% of households experience little to no hunger, the highest proportion in the country. And with 90% of land-holding households producing food, Limpopo appears food-secure.
However, 35.9% consume poor diets, the highest rate nationally, with a mean dietary diversity score of 4.27. Access to growing does not mean access to nutritious food.
Mpumalanga
Adult female obesity and overweight in Mpumalanga reached 70.9% in 2023, the highest nationally, while child undernutrition remains significant, with the Nkangala district recording the province’s highest severe food insecurity.
High input prices affect 80% of households; food price shocks 64%. Mining and energy employment means agricultural involvement is lower than in other rural provinces.
North West
North West has the highest level of food insecurity in the country, with 81.9% of households food-insecure.
The Dr Kenneth Kaunda district has 34% of households in severe food insecurity and the highest meal-skipping rate at 21.3%. Dr Ruth Segomotsi Mompati district has the poorest dietary outcomes, with 27% of households consuming a poor diet, and the highest percentage of households that were worried about food running out (44.9%) and those who reported that their food often runs out (46.1%).
Northern Cape
The province is simultaneously at the highest risk for stunting (41.3%), wasting (20.8%), and underweight (25.8%). The Pixley ka Seme district has an overall stunting prevalence of 73.2%, nearly three in four children.
The Northern Cape also has the highest proportion of indigent households. High input prices affect 96% of households, and arid conditions limit production, with only 19% of land-holding households using land for food production.
Western Cape
The Western Cape has the highest mean dietary diversity score in South Africa at 5.37, yet national synthesis reports place its overall stunting prevalence at 46.4%, among the highest nationally.
Agricultural production is dominated by large-scale commercial farms, with household food production and livestock involvement extremely low at 7% and 5%, respectively. High input prices affect 98% of households.
The gap between dietary diversity scores and stunting rates in the Western Cape points to a distinction that runs through the national data: access to enough food is not the same as access to nutritious food, and the two do not always move together. DM