


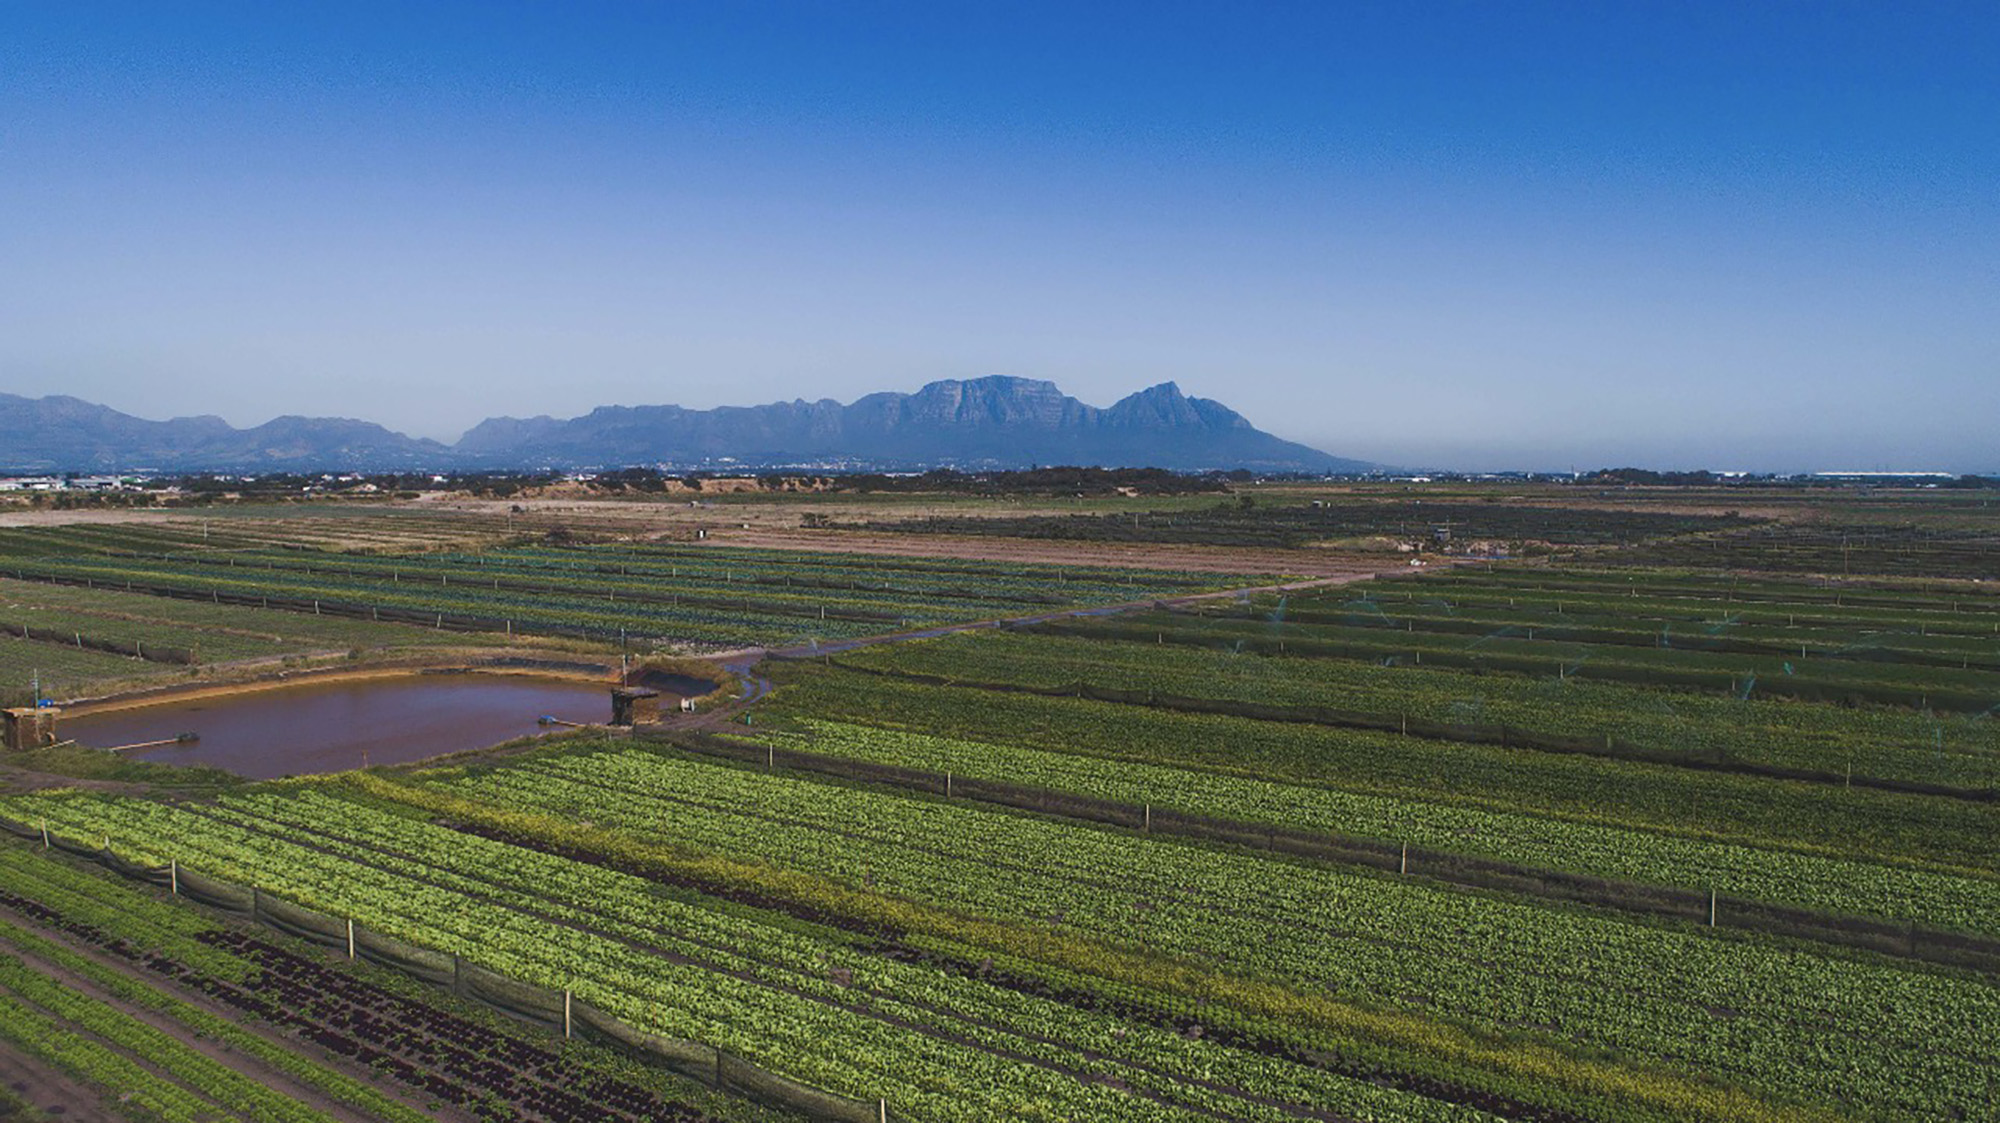
 The Philippi Horticultural Area (PHA) foodlands. About 20 million cubic metres of groundwater are pumped each year in the PHA to produce 75% of the fresh produce sold in Cape Town. (Photo: Supplied)
 /file/dailymaverick/wp-content/uploads/2025/10/label-Op-Ed.jpg)
Recent headlines such as “Understanding Cape Town’s groundwater crisis: insights from recent research”, “Worrying decline in Cape Town groundwater levels, UWC study reveals”, and “Cape Town’s groundwater reserves face alarming decline” dominated online media feeds. Reports highlighted findings from a PhD study by University of the Western Cape researcher Dr Sesethu Fikileni, which revealed 80% of monitored boreholes across the city recorded a sustained drop in groundwater levels between 2007 and 2024 — ranging from nearly 2m to as much as 17m.
Having carried out detailed groundwater monitoring across the city, I was taken aback by these claims. They stood in stark contrast to my findings, prompting me to investigate how the researchers reached their conclusion. After carefully reviewing the thesis data and analyses, it became evident that both the study and the subsequent media coverage had misrepresented the situation, shaping a narrative that demands closer scrutiny.
To be clear, neither the research nor its findings covered the entire city. The study relied on just 10 boreholes located within an 80km² section of the Cape Flats — representing only 13% of the Cape Flats Aquifer and a mere 3% of the city’s total area. Extrapolating these results to the whole of Cape Town is a considerable leap.
In reality, hundreds of boreholes across the city are monitored by public agencies, private operators, academics, and individuals. Yet no effort was made to source or analyse this broader dataset. As a result, the claim that “80% of monitored boreholes across the city show a sustained drop in groundwater levels between 2007 and 2024” simply doesn’t hold water. What the study actually found was that groundwater levels declined in eight of the 10 boreholes that they examined.
But was there truly a decline in groundwater levels over the 17 years chosen for the study? One of the most significant weaknesses I identified was the use of monotonic regression analysis. By definition, “monotonic” implies a relationship that consistently moves in a single direction. This method produces a straight-line relationship between two variables, and the trend can only show an increase or a decrease. In essence, this method forces an answer without taking account of supervening influences and events.
The use of adjectives such as “steady” or “sustained” to describe the alleged decline in groundwater levels is misleading. The groundwater level data presented in the research clearly shows variability and a range of fluctuation, including seasonal fluctuations and responses to rainfall and recharge events. In one instance, the effects of pumping are evident. However, as illustrated in the graphs below, the data itself does not demonstrate a consistent or steady decline.
During the study period, annual rainfall ranged between 486mm and 1,119mm. Within those years, the region experienced two droughts — one of them particularly severe — as well as two periods of above-average rainfall. Such variability over a relatively short timeframe is significant, and any single, overarching conclusion about groundwater levels must therefore be treated with caution.
Similarly, the observed changes in groundwater level patterns presented in the research strongly point to responses driven by rainfall variability and, importantly, to possible local groundwater abstraction. Yet these factors were excluded by the statistical method employed, which limited the analysis and overlooked key drivers of groundwater dynamics.
A citywide decline of 17m in groundwater levels would indeed be alarming—but that is not what the research showed. The researchers overlooked the fact that the 17m range observed in borehole G2N0649 was the result of pumping. This borehole lies in Philippi, Cape Town’s breadbasket, which supplies roughly 75% of the city’s fresh produce and has relied on large-scale groundwater abstraction for decades. Located just 12km south of the UWC campus, the site could easily have been field-verified to assess the proximity and impact of production boreholes.
Notably, nine of the 10 boreholes showed far less variation than G2N0649 — less than 4m. This outcome aligns with what one would expect given the variability in rainfall during the study period.
Weak correlation
The researchers examined the relationship between rainfall and groundwater levels, but reported only a very weak correlation. This result is surprising, as local hydrogeologists have long observed groundwater levels rising in response to winter rainfall — even during drought. Extensive data exist to support this well-established relationship, demonstrated in the graph below.
During summer, when rainfall is minimal, groundwater levels typically decline due to evapotranspiration, lateral outflow and groundwater abstraction. The groundwater level rises as winter rainfall recharges the aquifer, typically peaking in October each year. If rainfall truly shows only a weak correlation with groundwater levels, how then can we explain the clear seasonal patterns observed? This raises the question of whether the statistical methods employed were appropriate for such an analysis. Moreover, if rainfall and groundwater levels are only weakly correlated, attributing the reported decline in groundwater levels to climate change appears insufficiently substantiated.
/file/attachments/orphans/image1_773041.png)
As surely as night follows day, groundwater levels in the Cape Flats rise in response to seasonal rainfall and decline during the dry summer months due to evapotranspiration, lateral outflow and groundwater abstraction. Also, data collected at Lentegeur Hospital clearly demonstrate the localised nature of recharge, undermining the claim that recharge occurs primarily in the distant mountains. Annual rainfall is recorded above each winter peak.
The two boreholes at Lentegeur Hospital included in the research produced opposite groundwater trends, despite being only 600m apart. Between 2004 and 2024, groundwater levels in G2N0606 rose by 0.5m, while levels in G2N0116 declined by 0.8m. Such divergent results are difficult to reconcile, given their proximity and the highly transmissive nature of the aquifer, which is characterised by a flat hydraulic gradient.
/file/dailymaverick/wp-content/uploads/2023/01/toni_khulule.jpeg "The Spring Foundation vegetable garden at Lentegeur Hospital. (Photo: Daniel Steyn)")
This inconsistency was not addressed by the researchers, but it raised important questions about the sensitivity of their statistical results to the chosen duration and period of analysis. Although data were available from 2004 (as indicated in the thesis), the researchers selected 2007–2024 as their study window. Did this choice inadvertently introduce bias into the findings? This possibility was not considered in their analysis.
To explore this further, I aggregated my daily rainfall measurements from Pringle Bay and Betty’s Bay to calculate annual totals for each hydrological year. I then compared the trends generated in Excel for the periods 2004–2024 and 2007–2024. To my amazement, the two periods produced markedly different trends.
The longer record (2004–2024) produced a slight positive trend, while the shorter record (2007–2024, which coincides with the research period) showed a somewhat stronger negative trend. Yet the average rainfall for the two periods — 820mm/a and 810mm/a — differs only marginally. Using my complete record (2001–2025), I determined the average annual rainfall to be 785mm/a, and the linear trend indicates an overall increase of about 70mm/a over this timeframe.
Beyond the question of whether monotonic regression was an appropriate tool, a simple review highlights how sensitive the statistical outcomes are to the length of the data record used. Choosing a different period could easily have produced a positive trend. In that case, media headlines might well have read: “Concerning rise in groundwater levels in 70% of boreholes across Cape Town — widespread flooding expected.”
Increasing groundwater levels
In fact, three of the boreholes used in the research have shown increasing groundwater levels since 2014, with a further four rising since 2018. To me, this underscores that an inappropriate trend analysis was applied and that the study lacked the scientific rigour needed to critically assess the validity of its conclusions.
Perhaps my biggest concern with the research lies in its treatment of the mechanisms behind the alleged decline in groundwater levels. The study speculates about the roles of climate change, groundwater abstraction and sea-level rise, yet makes no attempt to substantiate these claims with supporting data, analysis or even references.
Above, I described that rainfall varied through two droughts and two wet periods. However, the average annual rainfalls determined at the start of the research and at the end were both in the order of 815mm/a. It is thus difficult to blame climate change for this.
Sea level has been measured at Fort Point, San Francisco, since 1854 by the US Geological Survey. That record shows a rise of 1.9mm/a. Over the research period, this equates to an increase of just 32mm — or 0.032m. Such a change is negligible and has no impact on the groundwater levels observed, particularly given that the boreholes in question are located more than 3.5km inland.
Reliable data on groundwater use from the Cape Flats Aquifer is lacking, but some rough calculations help provide context. The aquifer’s exploitation potential is estimated at around 50Mm³/a. Agricultural use in Philippi was previously estimated at 20Mm³ annually, and that figure is probably still similar. If we assume, generously, that 100 industrial-scale users collectively abstract 16Mm³/a and 1,000 domestic users draw just 0.5Mm³/a, the total estimated groundwater use would be about 37Mm³/a. This is well below the aquifer’s understood capacity, indicating that abstraction alone is insufficient to drive a long-term decline in groundwater levels.
To recap: the reviewed research was conducted in a very limited portion of Cape Town (just 3%), using the records from only 10 boreholes, and applying statistical methods that were both inappropriate and highly sensitive to dataset length. It claimed dramatic declines in groundwater levels — 17m over 17 years — without identifying credible mechanisms to drive such change. That magnitude of change was only observed in one borehole located in an area with significant groundwater abstraction. What is needed is a more comprehensive and carefully designed investigation, one that can produce credible results and genuinely advance our understanding of the Cape Flats Aquifer and its future management.
Borehole 3418BA000048, located 400m southwest of G2N0606, provides a useful comparison. Using groundwater level data from the Department of Water and Sanitation, borehole 3418BA000084 recorded an average groundwater level of 4.6m below ground between April 1979 and March 1980. This is soon after the borehole was drilled, and coincided with a relatively dry period in Cape Town. These depths are consistent with those observed at Lentegeur Hospital in the late 2000s and again in recent years. These are the three deepest levels on record and confirm a consistent and steady pattern over five decades.
/file/attachments/orphans/image2_798442.png)
Groundwater levels measured at the Lentegeur Hospital provide a useful comparison with those measured since 2023. The average and range of groundwater levels are similar, while the deepest levels recorded since the borehole was drilled and during dry times have remained consistent over five decades.
Above-average rainfall
From the mid‑1980s into the 1990s, Cape Town experienced an extended period of above‑average rainfall. This is reflected in the groundwater level record of 3418BA000084, which shows peaks about 1m shallower than those observed in the mid‑2000s and just before the onset of the Day Zero drought in 2015. Monitoring of 3418BA000084 ceased in November 1990, resuming only briefly in 2003. During that short revival, groundwater levels in both boreholes were found to be the same.
A visual inspection of the time‑series graph indicates that groundwater levels in the 1970s and 1980s exhibit similar averages and ranges to those observed since 2003. A computed linear trend from 1978 suggests a 0.5m decline over five decades, though this is clearly influenced by the prolonged above‑average rainfall of the mid‑1980s and 1990s. By contrast, analysis restricted to data measured since 2003 predicts a 0.25m rise over 17 years. Taken together, these results present a mixed message, highlighting the sensitivity of long‑term trends to periods of anomalous rainfall.
Science — or more correctly, the scientific method — requires new knowledge to be built upon existing understanding. There is little value in reinventing the wheel, though its design and materials can always be improved. Equally important, the method demands that new knowledge be subject to review and, where necessary, challenge.
My assessment of this research highlights several significant concerns. The evidence presented does not substantiate the claim that groundwater levels are declining in Cape Town — or even just the Cape Flats. And there is certainly no need for alarm or worry, just good groundwater management and ongoing monitoring. The resulting media headlines asserting such declines are misleading and incorrect. DM
Dr Roger Parsons is a hydrogeologist with more than 40 years of experience. He practises as Roger Parsons Groundwater Consultant. He writes this article in his personal capacity.