


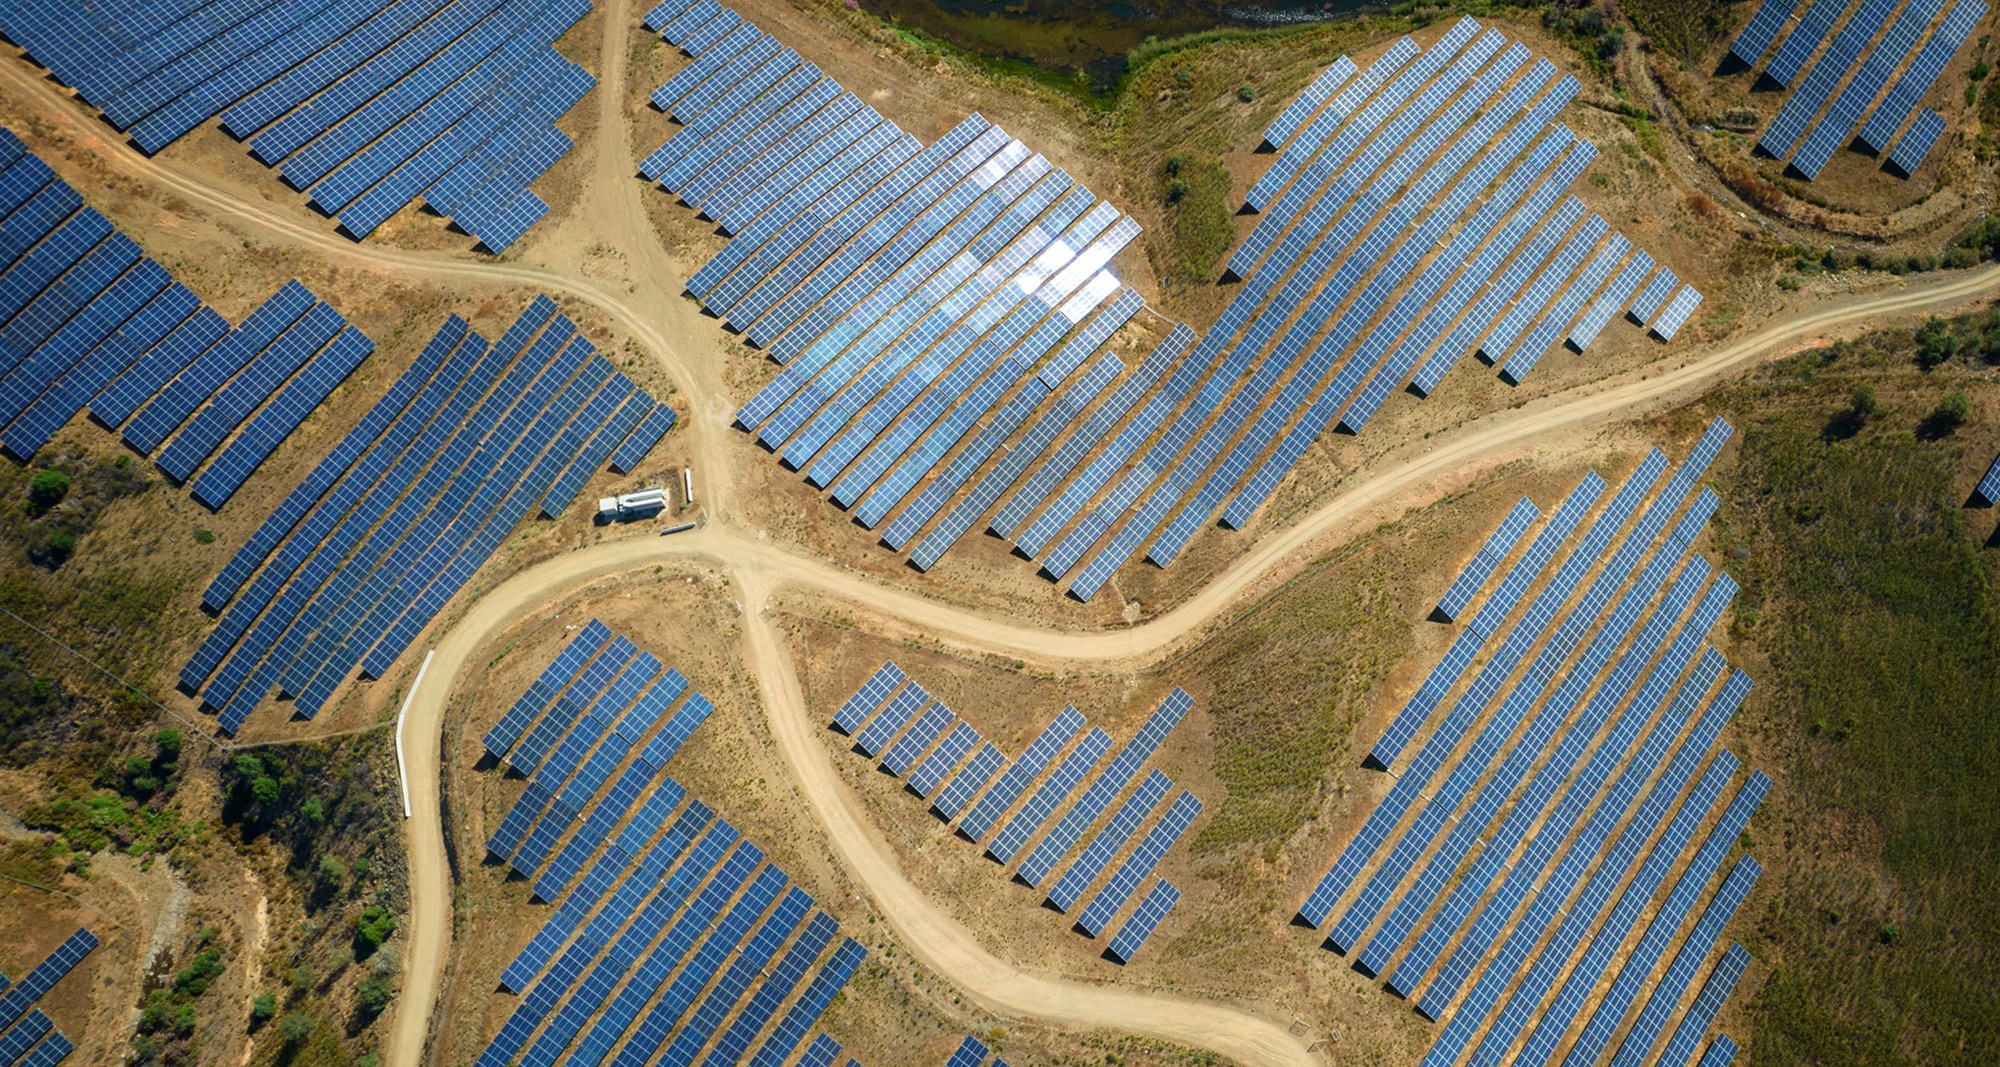
 Access roads cross between clusters of photovoltaic panels, which form part of the Solara 4 solar park, in Vaqueiros, Faro district, Portugal, on 9 June 2022. (Photo: Supplied)
 Published since the 1960s, the annual Statistical Review of World Energy is a trove of data on energy production and consumption, power generation, trade flows and other aspects of today’s energy system.
The publication always rewards a close look at both long-term trends and notable near-term changes. I could probably draw out dozens of meaningful trends, if I (and readers) had the time for them, but I will highlight four here.
Renewables are now 13% of global power generation

In 1985, coal-fired power was 38% of global electricity generation. Hydro was 20%, nuclear 15%; natural gas 14%; and oil a bit over 11%.
Three and a half decades later, coal is still king at 36%, and gas has increased to almost 23%. But every other major generation source of the mid-1980s has lost relative share — and more than gas alone can account for.
That is because renewable power (wind, solar, geothermal, biomass and small hydropower) has grown from 0.8% of the world’s electricity mix to 13%. Renewables passed the 10% mark in 2019 and have added 0.8% of market share — the same amount that they accounted for globally in 1985 — on average annually since 2010.
Wind and solar now generate more than nuclear power
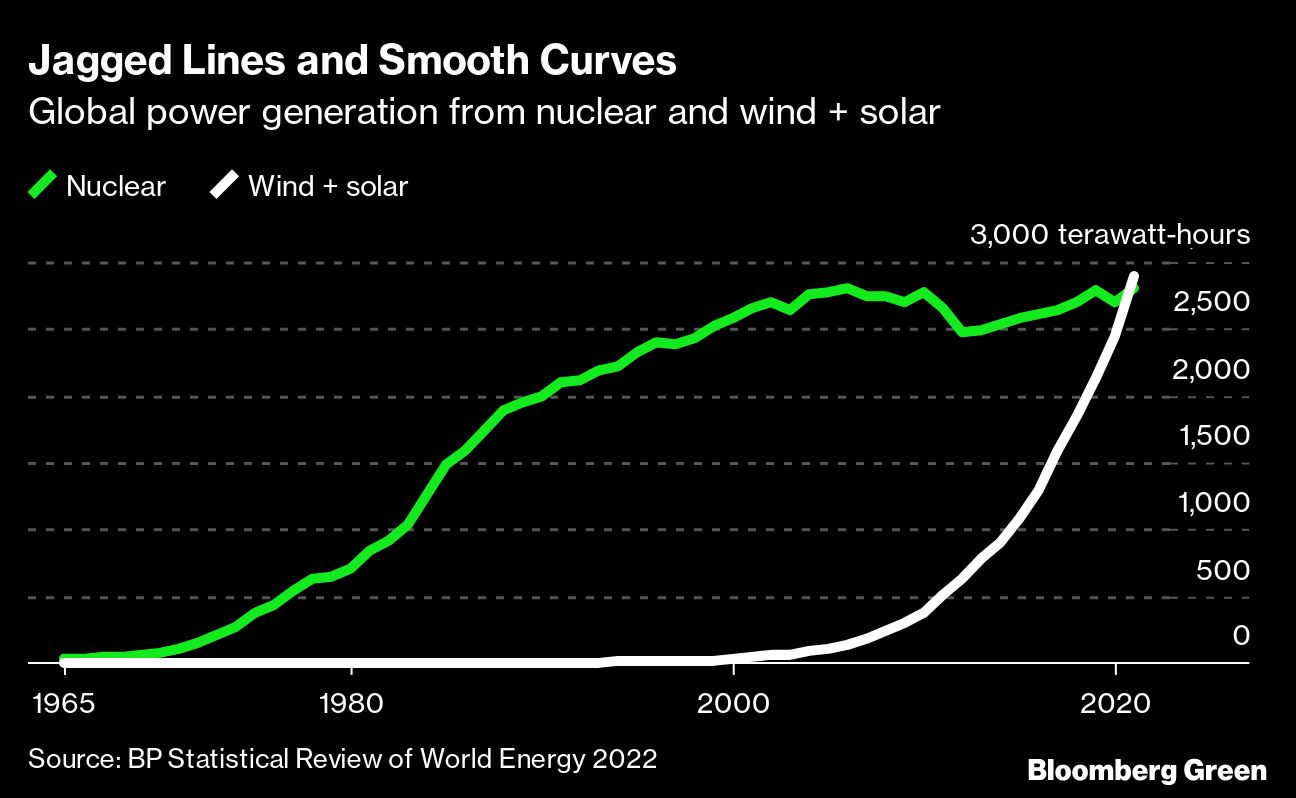
Last year I noted that although renewable power generation does not exactly compete with nuclear, renewables were winning. In 2020, all renewable power generation surpassed all nuclear generation. In 2021, wind and solar surpassed 10% of global generation on their own, and overtook nuclear in annual generation.
Last year was actually a significant year for nuclear power. Nuclear generation increased more than 4% in 2021, the biggest increase since 2004, thanks to Chinese fleet additions.
China is now the world’s biggest importer of liquefied natural gas
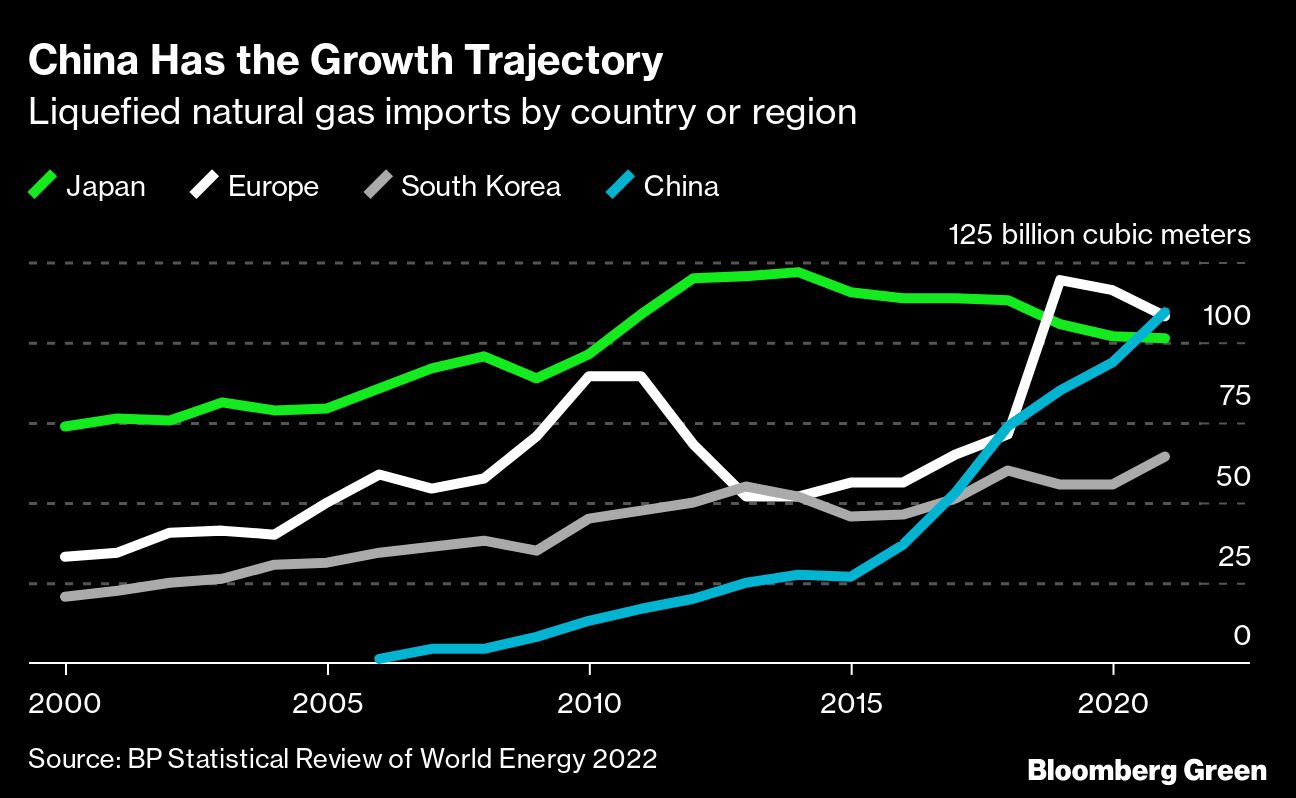
BP has tracked trade in liquefied natural gas (LNG) since 2000. At the start of the century, Japan was far and away the world’s biggest LNG importer, taking in about 75 billion cubic metres a year. Europe as a whole was the next biggest importer, followed by South Korea. China did not even begin importing LNG until 2006.
Over the next 20 years, Japan’s LNG imports peaked, driven by the closure of many of the country’s nuclear plants following the Great Tohoku Earthquake in 2011. Europe’s import volume looked poised to match Japan’s a decade ago, before falling back and then rising again to exceed Japan’s in 2019. Korea’s imports more than doubled, despite the occasional year of modest decline.
And then there is China. China imported 109.5 billion cubic metres of LNG last year, 1.3 billion more than Europe. Asia has accounted for 70% of global LNG trade for the past decade, during which time China’s shares of both global LNG trade and of Asia LNG trade have more than tripled.
China generates more renewable electricity than Europe
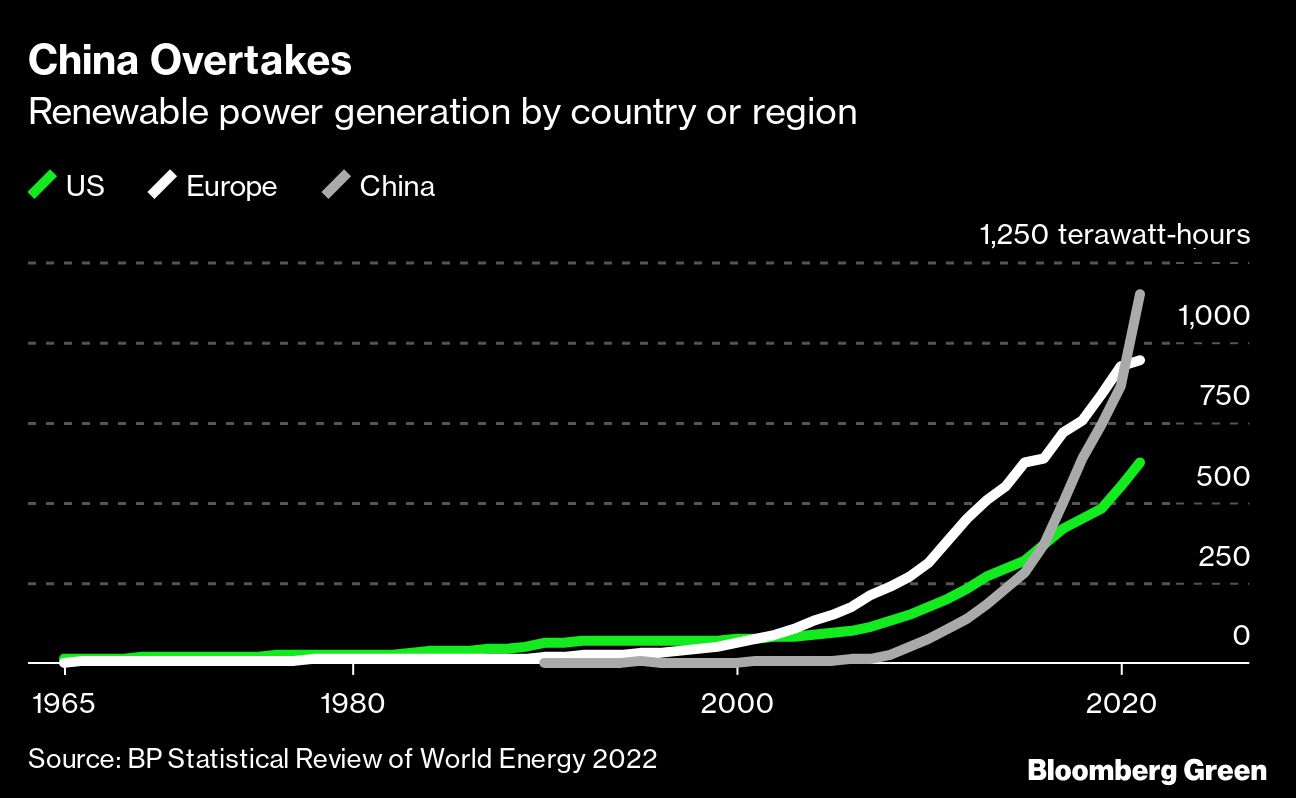
China, again, and a story and chart that should look familiar. In 1965, the United States generated 13 terawatt-hours of renewable electricity and Europe generated three terawatt-hours. Data on China’s renewable generation does not appear until 1990, at which point its 0.1 terawatt-hour was less than 1/600th of what the US was generating.
Fast forward to 2016 and China has surpassed the US and reached close to 60% of Europe’s total renewable generation. Then, in 2021, China rockets past Europe, adding almost 290 terawatt-hours of total renewable electricity generation in one year. Last year, Japan and India generated a combined 302 terawatt-hours.
Not every development in energy last year was positive. Coal consumption, for instance, rebounded sharply and was very close to its all-time high of 2013. Primary energy consumption reached an all-time high as well.
But primary energy consumption per capita has been more or less flat for a decade; it peaked 15 years ago in OECD countries. And growth rates matter. Coal consumption grew only 0.1% per year from 2011 to 2021, and gas grew at 2.2%. During that same 10 years, renewable power generation grew at 15% per year on average. The global energy system is huge and complex, and massive consumption of fossil fuels still dominates the mix. Zero-carbon power, however, is where growth lies. DM/OBP
Nathaniel Bullard is BloombergNEF’s chief content officer.
[hearken id="daily-maverick/9419"]