


 Illustrative image | Sources: Dean Hutton / Bloomberg via Getty Images | Gallo Images / ER Lombard | Flickr
 Journalist Reg Rumney is the former director of the SA Reserve Bank Centre for Economics Journalism at Rhodes University and former head of the economics department at the SABC.
Whoever came up with the slogan, “Johannesburg — a world-class African city” probably didn’t think a clearly aspirational phrase would later be used as mockery. In recent months the media has focused on the city’s water, electricity and road quality woes. The blame is laid at the door of the ANC, though the Democratic Alliance-EFF coalition under the colourful leadership of Herman Mashaba ruled for more than two full municipal years before the ANC regained control at the end of 2019.
What do the figures tell us about the reality of how Joburg is governed, compared, say, to Cape Town, a city perceived by many to be better run — always remembering that ideology lurks behind the presentation of figures as much as other facts? How do we move beyond political bias to a more dispassionate view of performance? One way is to examine the plentiful information on municipal finance produced by municipalities, as formidable a task this sometimes seems to most of us who are not necessarily financially au fait.
Luckily, we can easily get a handle on the basic numbers by visiting the National Treasury website Municipal Money and supplement our information with the Wazimap website, the SA Cities Network, and information from the National Treasury reports on municipal finance.
We’re moving towards the end of 2021, while the Municipal Money website has figures on spending and revenue only up to 2019 (the municipal year is from July in one year to June in the next, so 1 July 2018 to June 30 2019). In looking at recent performance, however, this is perhaps appropriate.
The 2019 to 2020 year includes the start of the Covid-19 emergency and the intense lockdown that so damaged the economy. All this hurt the livelihoods of municipal residents who pay municipal bills and complicates working out how well municipalities are managing. Moreover, the continuing Covid crisis and the effects of the insurrection that made itself felt in Joburg but seems to have bypassed Cape Town will be seen in the 2021 figures.
Anyway, the raw figures show that both Cape Town and Joburg, from 2016 to 2019, perform poorly in some areas and well in others — on paper at least. The figures that perhaps show most clearly how the city or town is being managed are:
- Cash coverage of operational spending
- Spending on repairs and maintenance
- Capital spending
- Spending on asset renewal
- Water and electricity losses.
Disaster will ensue if the municipality runs out of money to cover operational spending — the day-to-day expenses the municipality incurs in running the city, including paying wages and salaries. The indicator of performance is how many months or part of a month the municipality can pay for average operational spending.
According to Treasury’s 2019 State of Local Government Finances and Financial Management report, one month of average operational spending is a prudent level for metros, while other municipalities should have three months covered before they run out of cash. On this basis Cape Town has performed adequately, and though Joburg’s cash coverage did not hit the one-month target for 2017 and 2018, it did in 2019.
The next important indicator is spending on repairs and maintenance — strictly speaking just “maintenance” — as a percentage of the municipality’s property, plant and equipment.
The 2019 Treasury report notes, “Municipalities are consistently and grossly underspending on repairs and maintenance of infrastructure.” It adds that the 2018/19 audit outcomes reveal that only six out of 257 municipalities have spent enough on repairs and maintenance, and notes this “explains the generally poor state of infrastructure” of municipalities.
Here Cape Town stands out. In the 2016, 2017, 2018 and 2019 years, Cape Town municipality consistently spent the National Treasury target amount of around 8% on repairs and maintenance. Joburg fell short in each of those years. However, the calculation of what constitutes repairs and maintenance is not spelt out by a recognised accounting practice definition, the SA Cities Network State of City Finances 2020 points out, so we should handle this figure with caution.
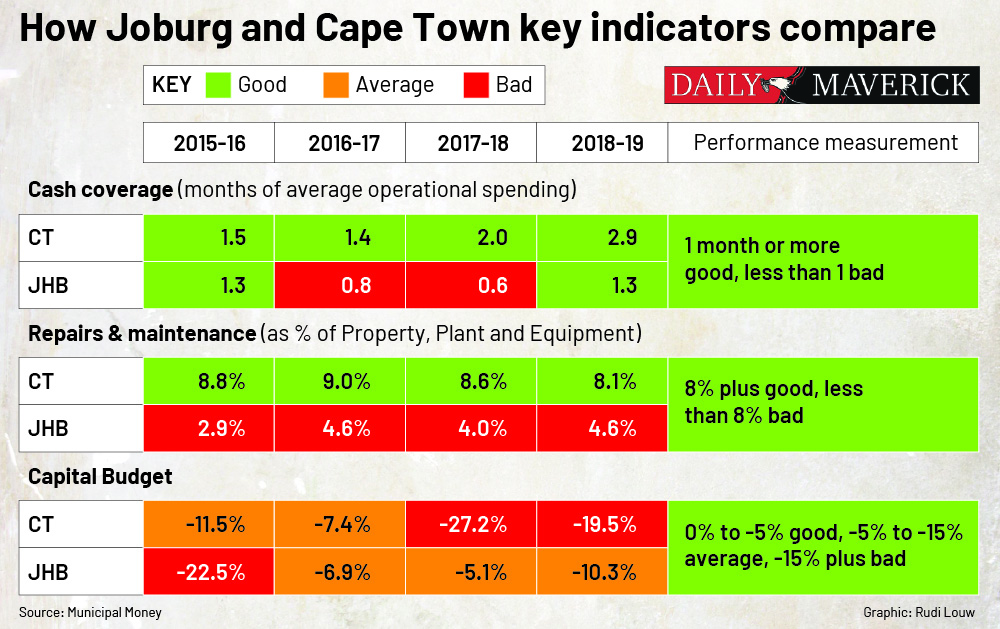
Spending of the capital budget is another important indicator. Capital spending is spending on those items that result in a long-term benefit, for example, new water or sewerage pipes, land, buildings and equipment. Municipalities in South Africa often seem to struggle with spending their capital budgets — as if there wasn’t a need for new infrastructure. Both Joburg and Cape Town are guilty of underspending their capital budgets, and this is worrying.
Within that capital spending, municipalities are also devoting too little money for the renewal of the municipal assets they have and too much on new assets. This is important because, as the State of City Finances 2020 report remarks, spending on rehabilitation, replacement or refurbishment of assets is essential to keep those assets functioning. An example would be putting in a new substation to keep electricity flowing, rather than building a new recreation centre. Both might be part of the city’s responsibility, but a rec centre left in darkness because the substation is malfunctioning is less useful than it could be, and factories struggling with power mean less money for bosses, workers and ultimately the city itself.
The State of City Finances 2020 report implies this is not a phenomenon unique to Joburg and Cape Town. “Capital expenditure is often low because cities defer renewal expenditure, which has long-term implications for the functionality of assets and the sustainability of service delivery.”
National Treasury’s guideline is that municipalities should spend 40% of their capital budgets on asset renewal. On this measure, Cape Town has been falling short and Joburg has been consistently above target, but the SA Cities report points out the amount will “depend on the extent and condition of a city’s asset base, backlogs and growth. Cities with assets in poor condition and slower growth will need to spend a higher proportion of capital expenditure on renewal compared to cities with assets in better condition and more rapid growth”.
Still, citizens of Cape Town need to ask pointed questions about whether the low figures for renewal are justified.

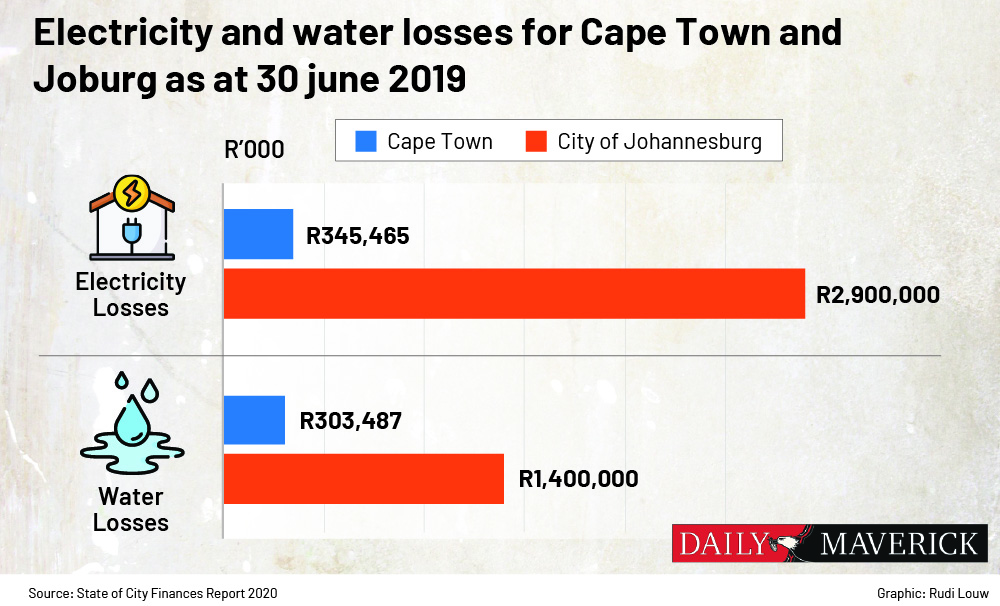
Recorded water and electricity losses are evidence of how well or badly the municipality is handling the delivery of essential services.
Treasury’s 2019 State of Local Government Finances report links losses with underspending on maintaining municipal assets, noting that underspending
“… results in a steady deterioration in the quality and serviceability of municipal assets that poses both an immediate and long-term risk to fiscal sustainability. This is also reflected in the continued high level of water and electricity losses”.
The Treasury report shows a disconcertingly different level of losses between Cape Town and Joburg. Joburg loses almost five times as much water as Cape Town and around eight times as much electricity. It’s true that Joburg has a larger population and greater population density, but the contrast is stark. Illegal electricity connections and copper theft will account for some of the electricity losses, but the water shortfall surely points to underspending on maintenance.
It might be argued that these figures don’t touch on the trade-offs that must be made in a city in meeting the needs of companies versus homeowners versus renters, or balancing serving the poor and the city’s revenue generators. Yet a poorly run city in the end affects everyone.
Also, these are only high-level figures, not a conclusive judgment, but they do give a taste of how complex the proper management of a municipality is and how much factual information is available.
Crucially, they also show what opposition politicians and individual councillors should be taking up with the governing party in council chambers, rather than engaging in political grandstanding. The financials should guide us, the residents, in the forthcoming municipal elections not only in choosing a political party, but in voting for councillors who can on our behalf put pressure on municipal officials to tackle the problems the financials reveal. DM