


 (Photos: Unsplash / Anna Jimenez / Andreas Gucklhorn / Master Wen)
 Mark Swilling, Nthabiseng Mohlakoana, Merin Jacob, Ndamulelo Mararakanye, Bernard Bekker and HJ Vermeulen are with the Centre for Sustainability Transitions and Centre for Renewable and Sustainable Energy Studies at Stellenbosch University.
The publication of the list of preferred bidders for the Risk Mitigation IPP Procurement Programme (RMIPPPP), the subsequent opening of Bid Window 5 by the Department of Mineral Resources and Energy (DMRE) and the recent presidential announcement about the new 100MW limit for self-generated licence-exempt renewables has focused attention on the accelerated construction of renewable energy generation in South Africa.
This brings the procurement of renewable energy from Bid Window 1 to Bid Window 5 to a total of 9GW, with a further potential procurement of 1.8GW from the RMIPPPP. Although this may not be as much as civil society groups, industry associations, research organisations and even Eskom may have wanted, the total of 10.8GW renewable energy, ie 24% of capacity currently installed in South Africa, does suggest that South Africa may well be catching up with the rest of the world that is transitioning fast into a renewables-based energy future.
The establishment of the Presidential Climate Change Coordinating Commission (P4C), with a clear mandate inherited from the National Planning Commission’s Just Transition Scenarios, will inevitably lead to the government confirming the globally accepted “Net Zero by 2050” target that was referred to in the Low Emissions Development Strategy approved by the Cabinet in September 2020. The Net Zero target refers to achieving net zero carbon emissions by 2050. This does not mean no carbon emissions, it means that the total output of emissions and total capture of emissions in carbon sinks should equal zero.
It’s an ambition that South Africa’s Nationally Determined Contributions (NDC) being prepared for COP26 later this year will need to fully embrace. The strongest commitment statement to date to the energy transition comes from the Presidential Economic Advisory Council (PEAC): “What used to be a choice is now mandatory. Those countries not adapting to a green transition will find themselves behind and excluded.”
The above developments, together with the recent announcement by the president that the cap on licence-exempt self-generation will be lifted from 1MW to 100MW that could unlock as much as 5GW of additional capacity in the near future, must undoubtedly be celebrated by all stakeholders.
According to the Council for Scientific and Industrial Research (CSIR) an ambitious commitment to building 5GW of renewable energy per annum for decades is urgently required — this equates to the generating capacity of two-and-a-half Koeberg nuclear power stations. This is needed to replace South Africa’s ageing coal-fired power stations and could unlock nearly R500-billion worth of investment over the next 10 years, creating 50,000 jobs per annum in construction and operation of wind and solar plants.
This, in turn, would trigger an upstream industrialisation programme that will catalyse the re-industrialisation of the South African economy that will rapidly drive down unemployment levels. All good news. Expanding and decarbonising the generation capacity through investment in renewable energy, however, represents only one aspect of the transition to a stable and sustainable energy scenario.
Once generated, electricity must be transmitted from distributed generation sites to load centres via the electricity grid. The existing grid, however, is unevenly developed — it is strong in the northeast where the coal deposits are, and weak in the southwest where the best wind and solar resources are located. Is the national grid, therefore, fit for future purpose?
National demand for electricity by businesses and households is variable, and it changes according to summer and winter seasons. While weather-dependent wind farms at two different locations might generate the same amount of energy per year, the times during which they dispatch energy onto the grid may differ drastically. One wind farm might generate power when the grid needs it (eg during the morning and evening peak times in winter), another in a different region may generate power at different times. This raises a crucial question: how well will the new weather-dependent renewable energy generators synchronise with the demand patterns of the end users (households and businesses) across different seasons?
Investments in renewable energy will unlock economic growth, especially in the regions where the plants and grid infrastructure are sited. However, will these benefits be optimally and equitably distributed across the South African landscape? Communities around wind and solar farms are well positioned to benefit developmentally from these projects. But this depends on the capabilities of local governments, local businesses and civil society to take advantage of new inward investment flows. This has implications for the location of projects. It would not be desirable, for example, to put projects into locations where there are high levels of corruption and mismanagement.
Research questions and current scenario
Addressing these questions in the medium to long term requires careful consideration of the geographical distribution of future renewable generation capacity. There are three core strategic questions that need to be addressed. First, in the short to medium term (one to five years), where should wind and solar farms be located to ensure reliable electricity generation and transmission at lowest cost?
Second, from a medium- to longer-term perspective (five to 15 years), where should the wind and solar farms be located to ensure integrated bulk procurement of renewable energy generation that optimally supports the changing electricity demand over the longer term?
And third, where should wind and solar farms be located to ensure maximum developmental impacts with respect to jobs, local economies and manufacturing? These questions are facing a range of stakeholders, including regulatory entities such as the National Energy Regulator of South Africa (Nersa) and the Department of Mineral Resources and Energy (DMRE) as well as the national System Operator (SO) which is Eskom.
At the moment, the Independent Power Producers Office (IPPO) within the DMRE evaluates bids from private developers mostly according to price of electricity generated (R/kWh), with limited reference to where each of these wind and solar farms should be located. In 2015, as part of Phase 1 of the Strategic Environmental Assessment (SEA) study for wind and solar PV, the CSIR proposed a total of eight Renewable Energy Development Zones (REDZ) for fast-tracking the deployment of future wind and solar PV plants. These REDZ, proclaimed by the Department of Environmental Affairs (DEA) (currently known as the Department of Forestry, Fisheries and the Environment (DFFE)), demarcate areas with good grid connection infrastructure where large-scale wind and solar PV facilities can be constructed with limited negative impacts on the environment, while delivering equitable socioeconomic benefits to regional communities.
In 2019, as part of Phase 2 of the SEA study, the CSIR proposed three additional REDZ, bringing the total number of REDZ to 11. The proclamation of these REDZ makes it possible for locational criteria to be taken into account when approving renewable energy projects.
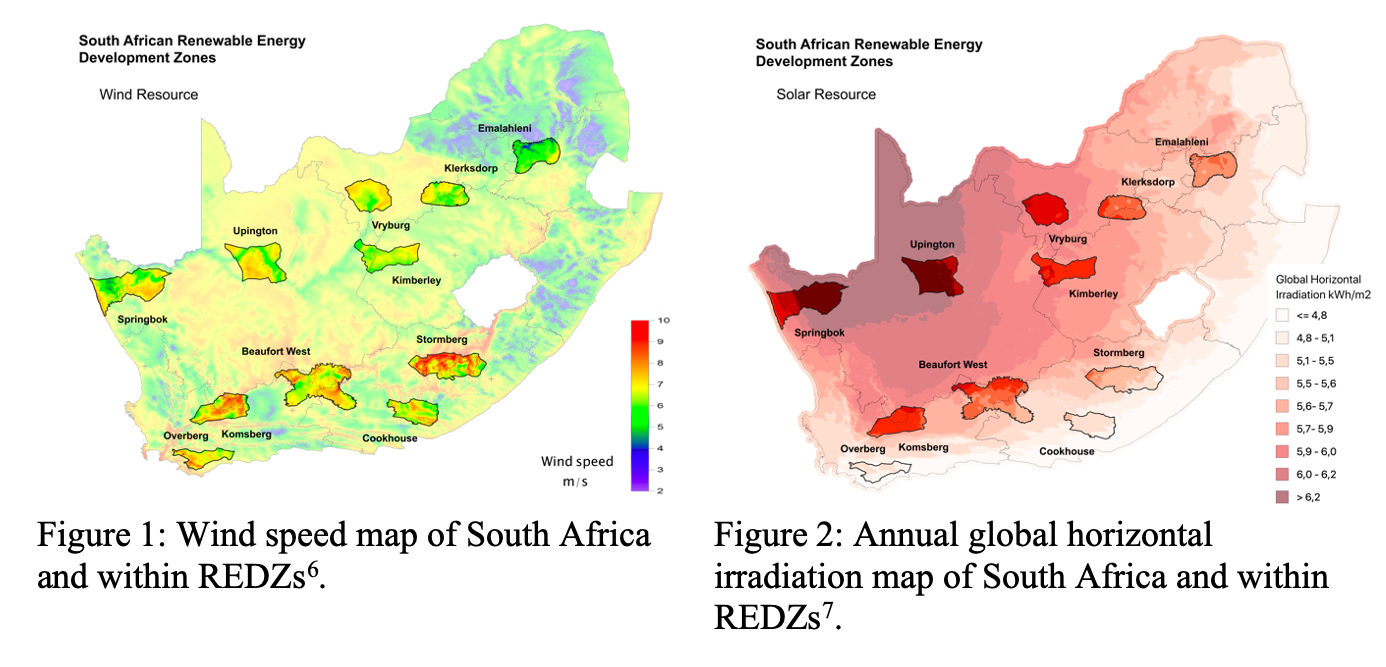
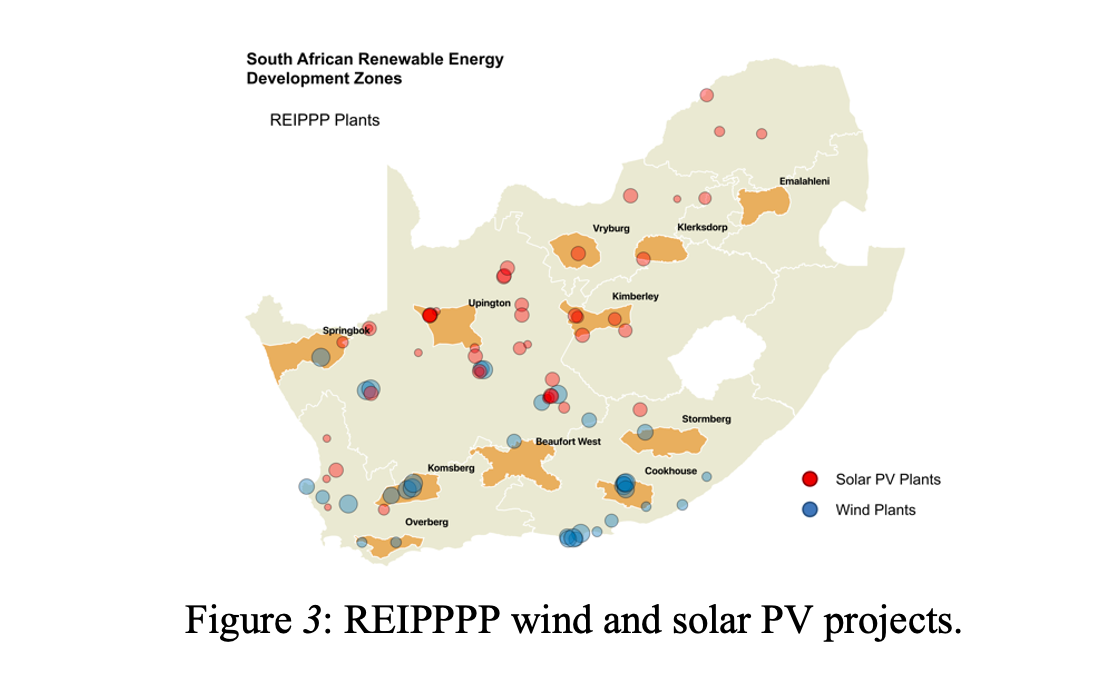
Figures 1 and 2 map the locations of the REDZ against the wind and solar PV resources of South Africa. It is clear that the REDZ identify the best wind and solar PV energy resources. The REDZ in the southern regions such as Cookhouse, Stormberg, Beaufort West, Komsberg and Overberg are where the best wind can be found. REDZ such as Springbok, Upington, Kimberley, Vryburg, Klerksdorp and Emalahleni are where the best solar PV potential is located. Figure 3 shows the locations of the Renewable Energy Independent Power Producer Procurement Programme (REIPPPP) wind and solar PV projects up to Bid Window 4. It is clear that wind and solar PV energy can be significantly extended in most of the REDZ.
 Grid Readiness
Figure 4 shows the power stations and Main Transmission System (MTS) associated with the national grid. The bulk of the generators, ie coal-fired stations, are located in the northeast of South Africa, mainly Mpumalanga. This is also, therefore, where the grid capacity is the most well developed and robust. However, if at least 27GW of renewable energy is to be constructed in the next 10 years (as per the current IRP) or more if the IRP is revised, the bulk of that will have to be built in the regions with the best wind and solar PV resources, namely the southern and central regions of the country.
These are also the regions where grid capacity is the weakest. This transition will, in short, result in a 180-degree spatial swing from the traditional energy generation heartland in the northeast to the southwestern, southeastern and central regions of the country where the wind and solar resources are considerable, but the grid infrastructure is limited. The electricity transmission zones and MTS substations mapped in Figure 5 show that the REDZ are, in fact, fairly well aligned with the existing grid infrastructure.
The Generation Connection Capacity Assessment of the 2022 Transmission Network (GCCA-2022) produced by Eskom is a good departure point for future developments in grid readiness. It is estimated that the overall cost to upgrade and reorient the grid to prepare for renewables in the short term will be about R20-billion. However, over the medium to longer term, up to R150-billion may be required to ensure grid readiness for the swing from coal-based to renewable-based energy generation. While this is much less than the total capital cost of the energy transition through to net zero by 2050, it is nevertheless a key investment that will have significant socioeconomic impacts at the local level.
 Demand and generation profile
The second question focuses on the impacts of a high penetration of variable renewable energy generation on grid operations. The future renewable energy fleet should ideally be deployed in a way that ensures supply is aligned with consumer demand despite the influences of weather and climatic conditions on power generation. This must include reducing risk of severe loss of generation due to extreme weather events. These factors should inform the geographical distribution of future renewable energy plants. The importance of these issues is recognised in the wind and solar PV resource aggregation study for South Africa conducted by the CSIR.
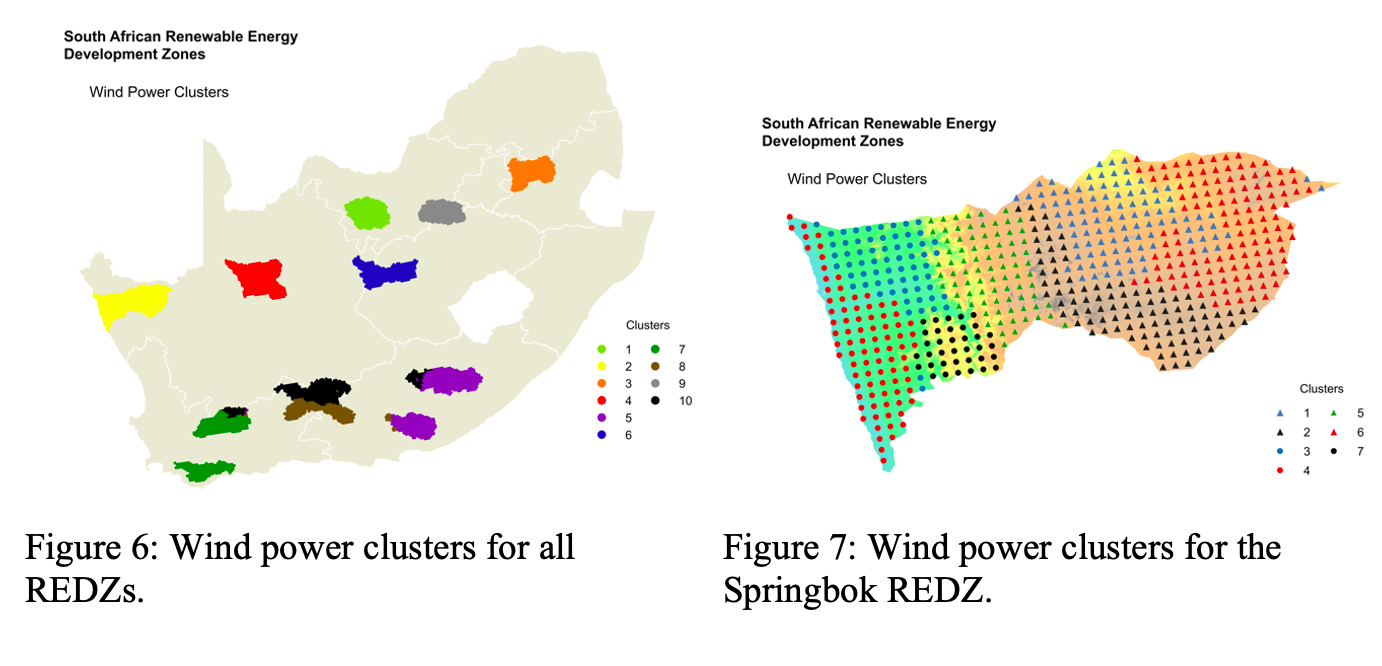
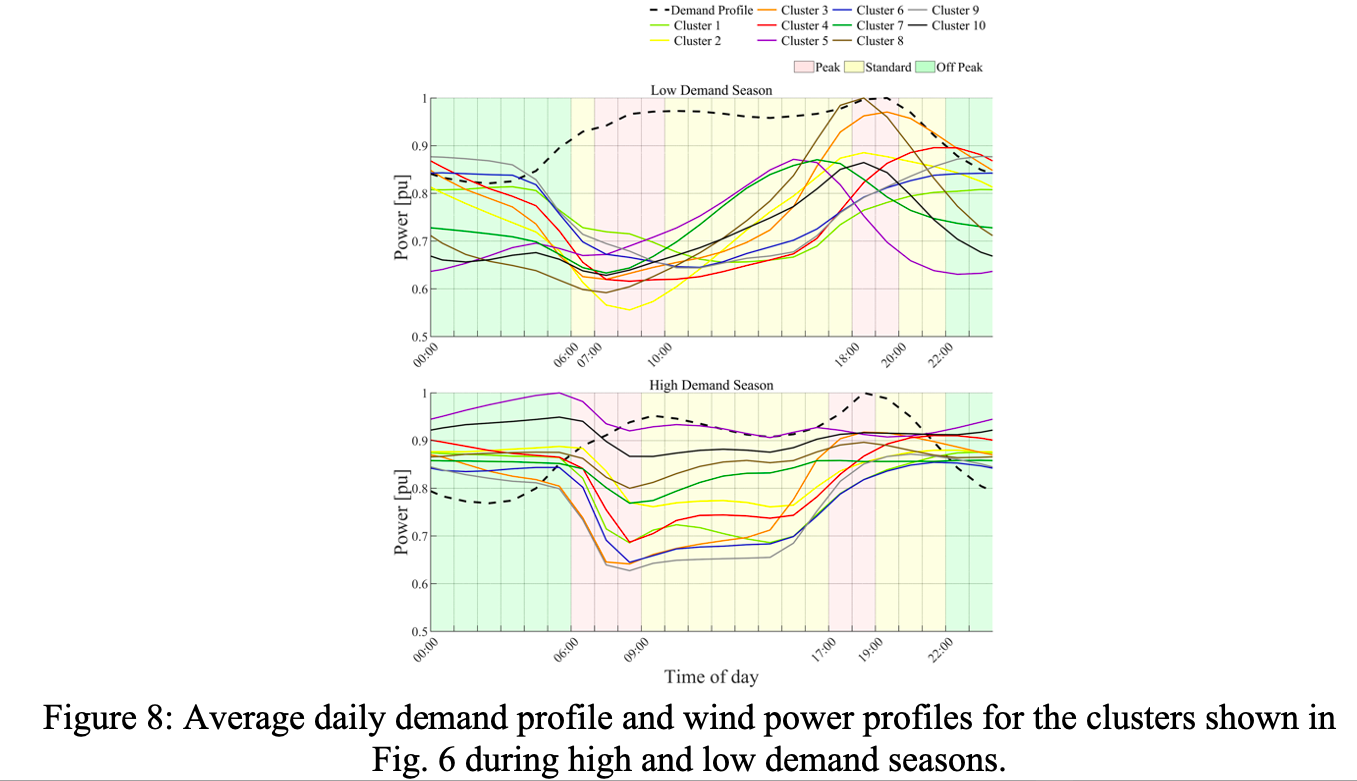
The wind generation profiles vary with geographical location and terrain topology. Figure 6 shows a map where geographical coordinates from the Wind Atlas of South Africa (Wasa) are clustered according to the similarity of the average daily wind power profiles. Figure 7 shows a similar map for the Springbok REDZ. The mean daily power generation profiles for the different clusters shown in Figure 6 for the low- and high-demand seasons are shown in Figure 8, along with the average daily national demand profile.
It is clear that the wind profiles for the different geographical regions align differently with the demand profile, and this alignment varies with the seasons. The wind power profiles associated with Cluster 5 in the Stormberg and Cookhouse REDZ, for instance, correlate well with the demand profile for the high-demand season, but not so for the low-demand season. It is also noticeable that wind generation does not support the demand profile well during the morning peak period in the low-demand season, and neither will solar PV generation.
Nevertheless, as happens elsewhere in the world where renewables are expanding fast, it is possible to optimise the geographical locations of future wind and solar PV plants such that grid support is optimised and the residual load (ie the difference between renewable energy generation and demand) is minimised. It is this residual load that must be carried by complementary energy sources, including batteries, natural gas and green hydrogen.
The present penetration of wind and solar PV energy represents less than 10% of the energy on the South African grid. This is relatively easily managed. When penetration rises to 30% or more by 2030, grid management becomes much more complex, requiring sophisticated data-rich decision-support systems. This may, for example, require the SO to predict how much renewable energy will be generated in the hours and days ahead in order to make decisions on which non-renewable power plants to start and stop to ensure the grid meets demand across all regions on a 24/7 basis.
Siting future solar and wind farms such that renewable energy generation aligns optimally with national demand for electricity will make things much easier for the SO. Furthermore, by aligning renewable energy generation with actual daily demand patterns, the capacity of non-renewable power plants required to meet the demand can be minimised.
Socioeconomic impacts
The third question is about the just transition — the socioeconomic impacts of solar and wind farms. South Africa has one of the most sophisticated systems for ensuring that local economies benefit from investments in renewables and local manufacturing benefits from local content rules. To build a renewable energy plant, regulations prescribe that a percentage of turnover and profits must be spent within the local area. As a result, the total socioeconomic development spend since 2011 amounts to R1.3-billion in local communities. Spending on local content by June 2018 was R42.1-billion and 55,217 jobs were created to construct just over 5GW of installed capacity. This is impressive, but a fraction of what is to come. Imagine the developmental impact of 5GW per annum! This could be SA’s biggest developmental and industrial investment since 1994. However, that is only part of the story.
The other part of the story is the impact on manufacturing and services businesses that will benefit from local content requirements (LCR) and servicing contracts (transport, repairs and maintenance, etc). LCRs are strict regulations that force developers to procure up to 60% of total infrastructure built from local companies.
Imagine R50-billion a year building solar and wind farms, with at least half spent locally to buy components, turbines, blades, solar panels, electronic gadgets, transport services, repair and maintenance services, etc. Western Cape wind turbine developer, Iwecon, claims that 2.5MW turbines can be built with 80% of all inputs sourced within South Africa. Where the solar and wind farms are located could affect, therefore, not just the local economies where these infrastructures are located, but also industrial and service sector value chains.
The key strategic question is, therefore, where best to locate wind and solar farms with respect to access to raw materials, skilled labour, manufactured inputs and customers. The REDZ answer this question in general terms. But the devil is in the detail. Which REDZ get prioritised and how local players act proactively is what really matters. Forward-looking local economic strategising by capacitated non-corrupted local governments will be key.
The way forward
Figure 3 above shows that the majority of solar and wind projects are located roughly in the southwestern part of the country, while the rest are scattered across different regions. Ideally, according to the CSIR and DFFE, all major renewable energy infrastructures should in future be located within these REDZ. As Figure 7 shows, many are not.
There is no evidence that the procurement criteria used by the IPP Office to adjudicate bids by Independent Power Producers (IPPs) during the bid windows include locational considerations other than the grid connection authorisation provided by Eskom. Instead, the criteria are primarily cost of energy (70%) and development impact (30%). Compare that to the criteria for demarcating the REDZ (resource availability, access to power corridors, environmental impact and development advantages), and it becomes clear that a mismatch exists.
This is unsurprising, because the criteria used by the IPP Office were developed back in 2010/2011 when the locational significance of a large-scale renewable energy programme was inconceivable. That has all changed now. The importance of locational criteria must now be acknowledged as the next logical step in maximising the benefits for South Africa from the forthcoming investments in renewable energy infrastructures.
Researchers at the Centre for Renewable and Sustainable Energy Studies and the Centre for Sustainability Transitions at Stellenbosch University are modelling the implications of having a 20-year future perspective on where renewable energy infrastructures should ideally be clustered over time.
The REDZ are a good start, but they need to be prioritised. Which REDZ, or areas within REDZ, should be the focus of Bid Window 6, for example? Which siting locations should the IPPO consider referencing in Bid Window 7? What locational criteria will Eskom (and Nersa?) use to approve the new crop of licence-exempt plants (unleashed by President Ramaphosa’s recent statement about lifting the cap on such plants from 1MW to 100MW), especially if “wheeling” across the grid is allowed in the upcoming Schedule 2 revisions?
In terms of grid readiness, forward planning of clustered investments will enable the grid planners and investors to anticipate what is coming so that they can do all that is necessary to upgrade and extend the grid to cater for future wind and solar farms in particular concentrated zones rather than spread out across the entire grid.
Grid expansion to ensure readiness for renewable energy connections is enormously complex work. It entails years of forward planning using sophisticated models (currently done by Eskom) and multiple negotiations for authorisations (especially servitudes) to develop public infrastructures across large swathes of privately owned land. Also, it takes time, skills and money to raise the capital investments required for these long-term grid readiness projects.
Imagine if grid planners and investors knew years in advance where the next major cluster of renewable energy infrastructures was going to be? Imagine the excitement this would generate among the landowners in a designated area who stand to gain financially (if they are cooperative and not too greedy), the local governments in the area who could benefit from expanded tax bases, and the unemployed who can get jobs from grid extension work and the construction and operation of solar and wind farms.
Dying small towns could be economically revived, and upstream industrial manufacturing and service sector industries would be catalysed in new regional industrial zones. Progressive community development groups can also prepare communities to benefit from skills development programmes and even the setting up of energy cooperatives for owning, constructing and operating wind and solar farms within these designated priority zones.
But most of all, it will enable public and private providers of renewable energy with secure knowledge that the zones where they intend to build will have the necessary grid infrastructure to evacuate the power they generate onto the national grid. This is crucial for building investor confidence.
In addition to these crucial grid planning and developmental impacts, there is also the longer future of a power system that is dependent on weather and climate-affected variable renewable energy generators supported by large storage capacities (batteries, pumped storage hydro and/or green hydrogen).
As many other countries have discovered as their energy transitions progress, this means accepting that the national grid will become a highly complex system that must be managed in the public interest by a dedicated and autonomous publicly accountable SO. Grid support systems, including forward planning and new daily system operation routines and data flows, will be required. Publicly available open-source user-friendly data systems will be essential to ensure maximum forward-looking transparency for communities, local governments, developers and investors.
To achieve this outcome, the criteria used by the IPPO to adjudicate bids by IPPs during bid windows will need to be modified to take into consideration the spatial location of wind and solar farms. As we have argued, this will mean taking into account three key sets of criteria for enabling locationally appropriate investments, namely (a) grid readiness in the shorter term; (b) grid support over the longer term; and (c) just transition impacts.
Furthermore, as Eskom divisionalises, the new publicly owned Transmission Entity will also need to take into account these criteria so that it can introduce a combination of incentives, inducements and restrictions that will have the desired clustering outcomes. Alignment between the IPPO criteria and the Transmission Entity’s criteria will therefore be critical.
Maybe it is time to imagine a prosperous future without load shedding, where enough energy is supplied by an affordable energy system that catalyses a large-scale industrialisation programme.
As we gaze across the landscape, we will see optimally located clusters of solar and wind generators (backed up by storage where required), new fast-growing development nodes in small towns previously excluded from the benefits of economic growth, clean healthy air where coal-fired power plants have been replaced by renewable generators, a new green hydrogen economy in our water-rich and coastal areas to provide the back-up fuel required to stabilise a grid dependent on variable renewable energy, and a mushrooming set of manufacturing and service industries in a string of industrial zones benefiting from the build out of optimally located renewables for many decades into the future.
This is the emergent developmental vision an appropriately managed and funded national grid makes possible. DM
Comments
Scroll down to load comments...