


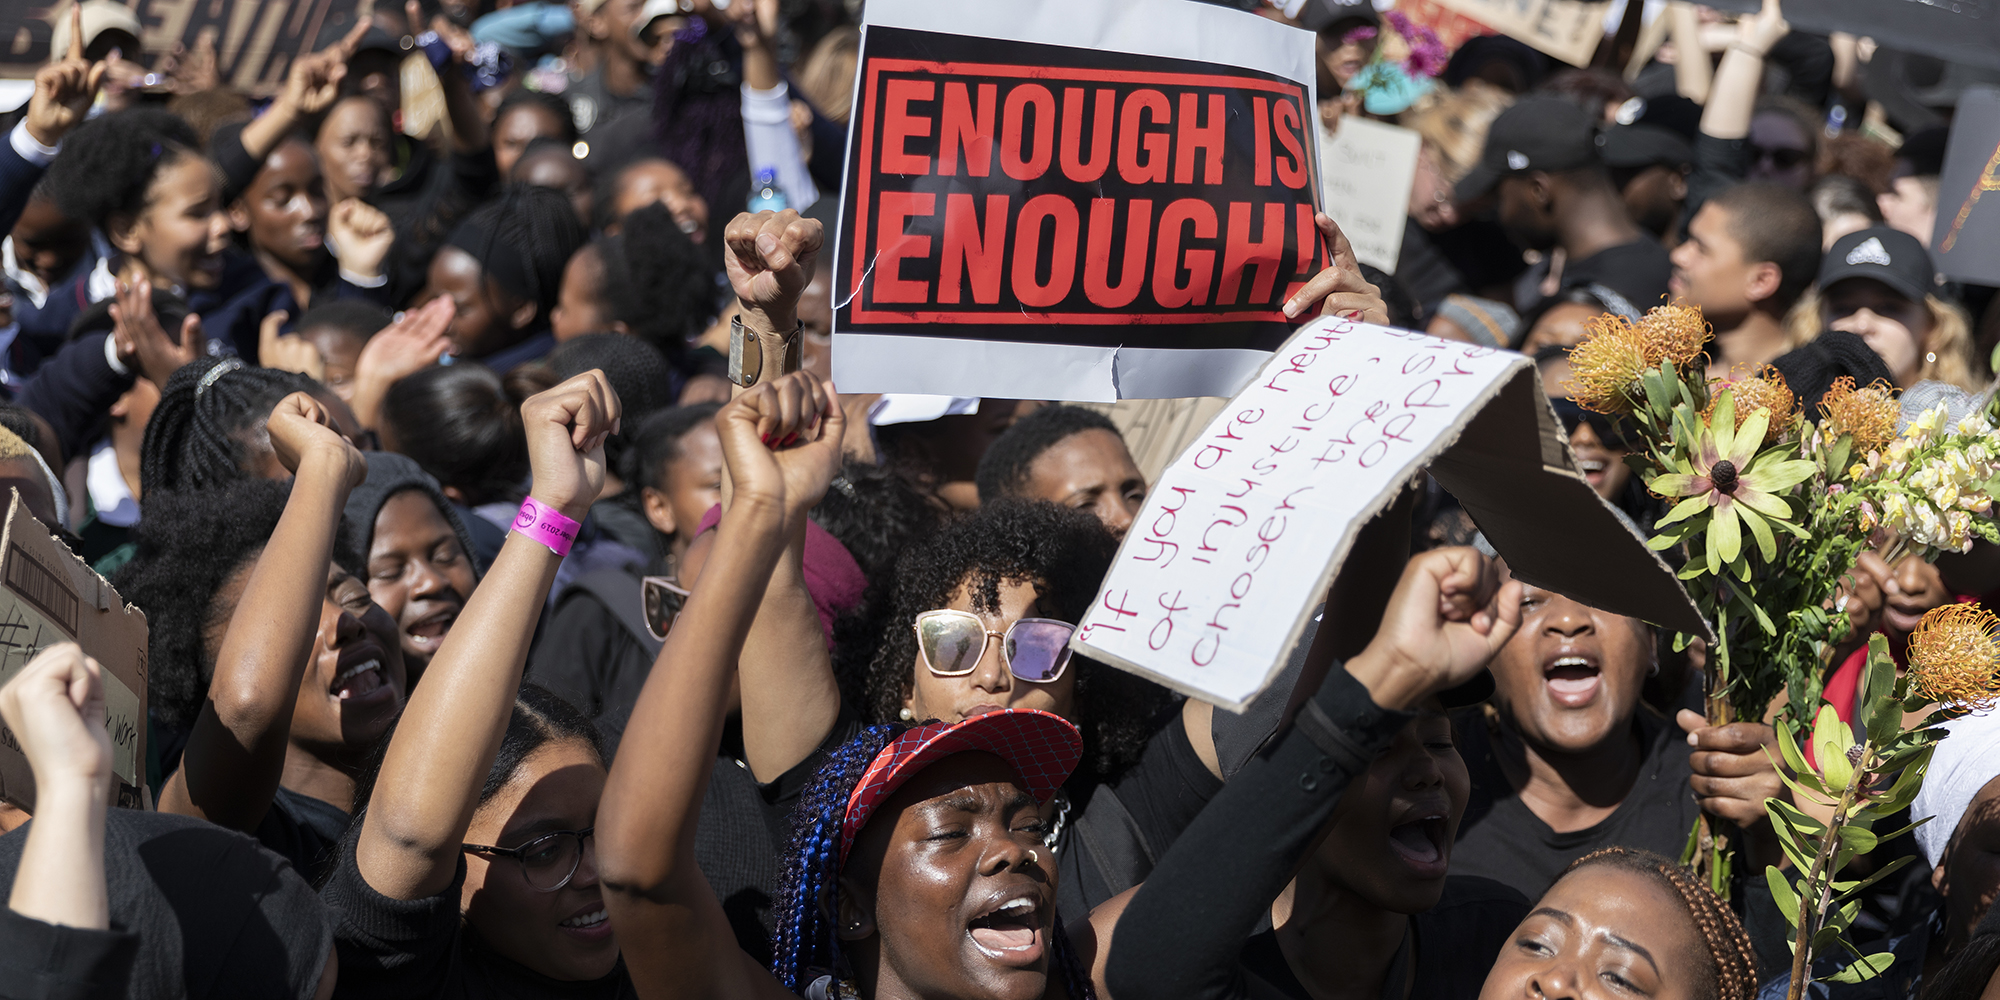
 Tens of thousands protest against gender-based violence outside Parliament in Cape Town on 5 September 2019. (Photo: EPA-EFE / Nic Bothma)
 Look carefully at the SA Police Service’s list of 30 gender-based violence hotspots, released last September, and you see that violence has a geography: places where it concentrates and intensifies over time; places where it breaks apart and subsides.
Why is this so? The list cannot say, because it offers information rather than understanding and limits our ability to do much about reshaping this violent landscape. To understand why the geography looks the way it does, and what to do about it, we need to go beyond simply naming a particular place a hotspot.
First, it’s important to be clear about why a particular locale is designated a hotspot. One reason is that it is recording very high levels of violence. Another is that it demonstrates a consistent increase in violence recorded over time.
While the police rape statistics illustrate both trends, the service ranks its hotspot stations in order of magnitude only. But both kinds of analyses are needed, as they produce different, but equally important, results.
Police data shows just a partial picture of violence – but we can still learn from it
The police statistics for rape, set out in annual crime reports, list the 30 stations around SA recording the highest number of rapes. While these numbers are imperfect — they don’t capture the extent of underreporting or control for population size — they do allow for some rough and ready, back-of-the-envelope calculations.

The table above highlights the five SA police stations where the most rapes were recorded in 2019/2020 and compares this with their reported figures from 2010/2011. While the trend is generally down, stations in the KwaZulu-Natal towns of Inanda and Umlazi have consistently topped the list for nine years. Mthatha in Eastern Cape, however, is showing an upward trend.
Mthatha is not the only station recording a steady increase: the table below lists nine of the 30 stations where reports of rape have increased by more than 10% over the same nine-year period.

Even accounting for a possible recording error, Diepsloot in Gauteng has witnessed a significant increase in rapes over the years. (The 37 rapes in 2010/2011 recorded seem surprisingly low in comparison to subsequent years.) Given the percentage increase, it should, along with Lusikisiki (Eastern Cape) and Delft (Western Cape), be a top priority for intervention.
The why and the where: Consider poverty and hunger in behaviour-change projects
Taken together, the tables make it clear that rape is not a static phenomenon. The extent of its perpetration changes over time and in both directions (increasing and decreasing). Comparing the two could help broaden our understanding of what makes rape more or less possible, and thus what could be done to limit the conditions for violence.
This is key to deepening and enriching interventions to prevent rape that, for the most part, focus on behavioural change to undo destructive gendered norms. But, because they are applied generally, rather than in ways that respond to the particular conditions of specific places, they, too, may be missing the mark.
Again, Diepsloot is a case in point. The Sonke Gender Justice’s Community Health Action and Norms for Gender Equity (Change) programme showed some promise in changing men’s attitudes and reducing women’s experiences of domestic violence in Bushbuckridge, Mpumalanga. But it demonstrated few benefits when repeated in Diepsloot in 2016/2017.
Researchers found no real difference in the behaviour of men who had been through the programme and those who hadn’t. In fact, while the least violent men in the programme seemed to reduce some of their violence, some of the most violent increased their use of violence.
This disconcerting finding could be explained by challenges to the implementation of Change in Diepsloot that were nonexistent in Bushbuckridge. But the more important explanation may be the very different context. Located at the nexus of urban poverty and multiple forms of deprivation, Diepsloot is marked by poor infrastructure, housing instability and a significant degree of informal housing, as well as high levels of crime and violence generally.
Food insecurity — a euphemism for going hungry and thus a marker of poverty — featured prominently among men who used violence, especially towards their female partners.
Many of these social conditions can be found in Delft, which also suffers gang violence. Lusikisiki may well share elements of this context, too, but as a small town serving a number of rural villages, it has its own particularities.
Gendered norms are therefore not independent of the social conditions they are shaped in. Because they interact in complex ways that have not been well understood, behaviour change programmes will be insufficient under these circumstances.
In the final analysis, identifying a particular place as a hotspot for rape doesn’t automatically explain why more violence occurs there. But it does encourage us to start asking the right questions about the relationships between rape, time and place. And in those questions may lie the answers that enable us to reshape our geographies of violence. MC
Lisa Vetten is a research and project consultant at the University of Johannesburg, where she works on the “Gendered Violence and Urban Transformation in India and SA” study.
This story was produced by the Bhekisisa Centre for Health Journalism. Sign up for the newsletter.
![]()
Comments
Scroll down to load comments...