


 Left to right: Matric pupils Ruan Rossouw, Kimberleigh Julius, Jade Solomons and the twins Marina and Johan van der Hoven at Sand du Plessis High School in Bloemfontein. (Photo: Gallo Images / Volksblad / Mlungisi Louw)
 Matric results are out. A rousing round of applause to all the teachers, markers, district officials, exam setters, moderators and learners who pulled this off. The Class of 2020 can be proud of what they have achieved.
I have no interest in the pass rate. I have made it clear that National Senior Certificate (NSC) passes have little to no meaning. On Monday 22 February 2021, Education Director General Hubert Mweli joked about the 30% pass mark – and pointed out that 0% of the Class of 2020 attained matric at this lowest level.
I am pleased to see that attention is shifting to the quality of passes. The Class of 2020 obtained certificate, diploma and bachelor’s degree passes which they can use to enter the world of work or further study.
When looking at the NSC results, there are several metrics which I find really useful to focus on. Most importantly, tracking these allows us to monitor our progress at the end point of the schooling system over time.
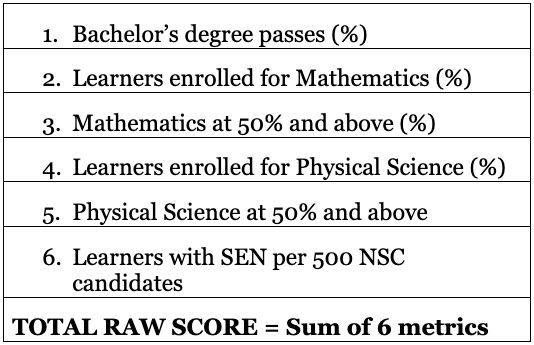
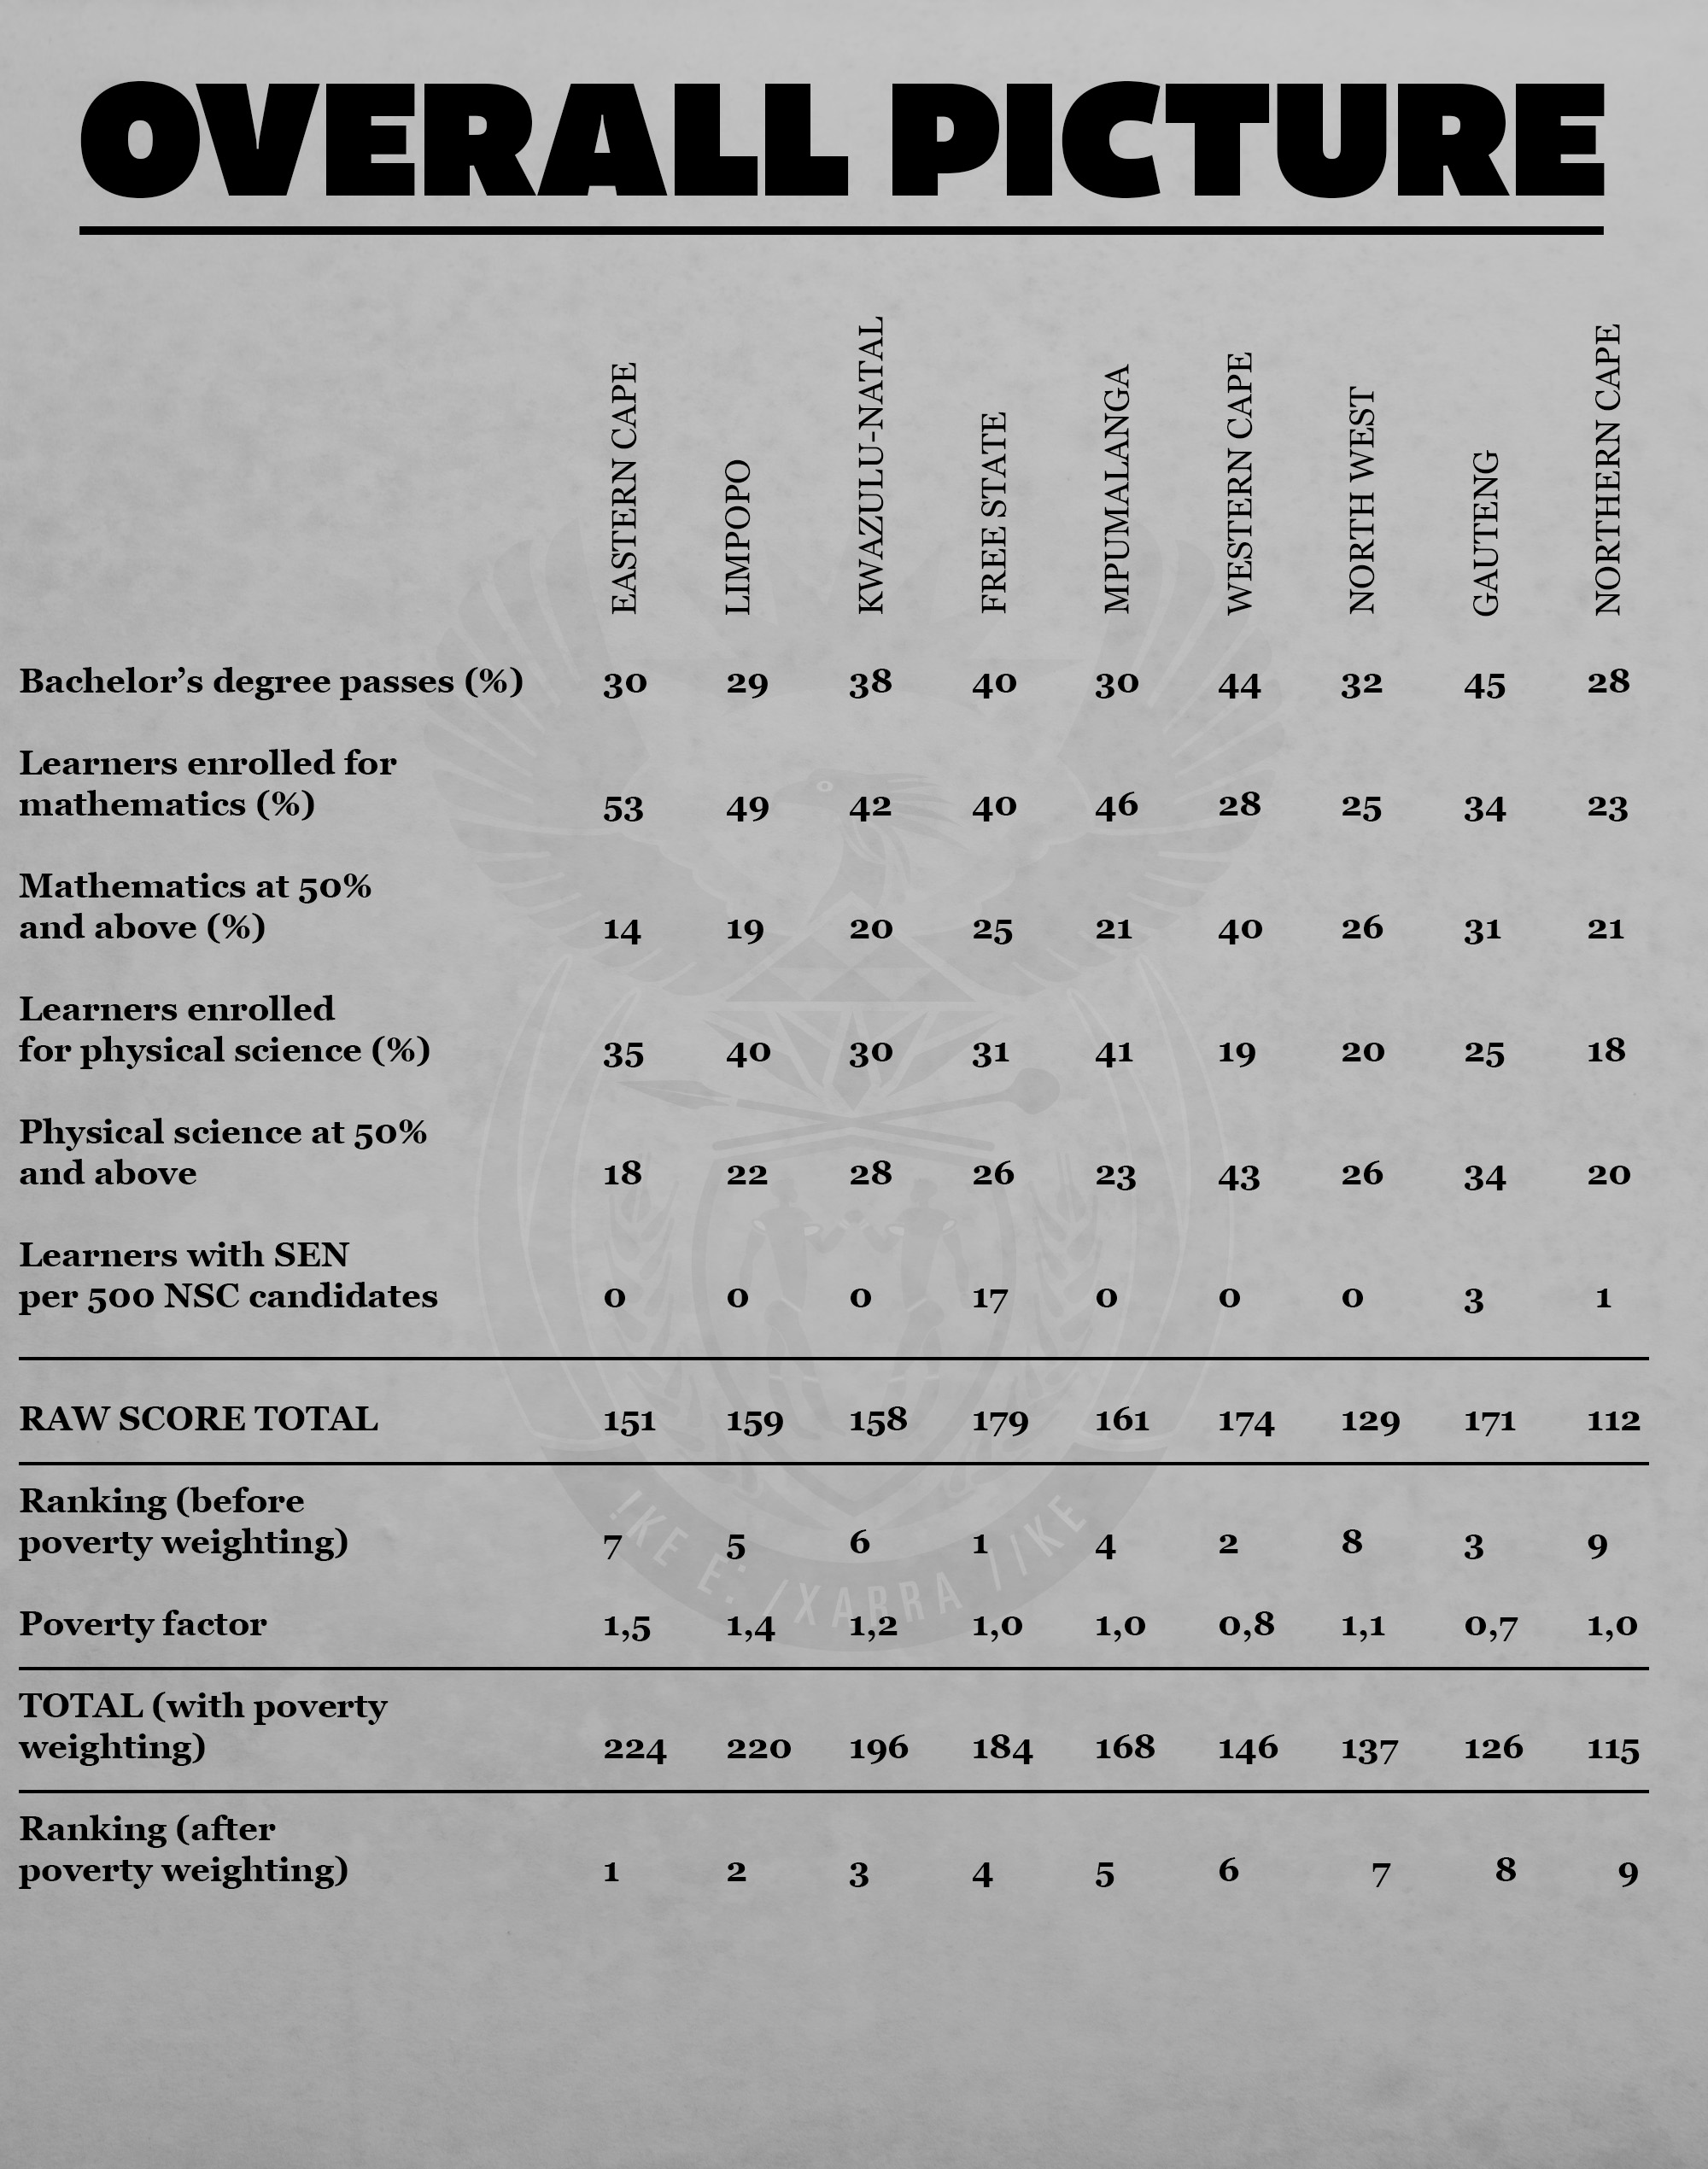
As an alternative to the “pass rate” provincial rankings, I offer provincial report cards using six metrics.
Metric 1: Percentage of bachelor’s degree passes measures the percentage of the matric learners who obtained the highest quality of pass (at the bachelor’s degree level).
Next I turn to the quality of mathematics passes. Here two metrics are of interest: enrolment and passes at 50% or above.
Metric 2: Percentage of learners enrolled in mathematics (rather than mathematics literacy or technical mathematics) is important as it offers a proxy of how mathematics is valued. In order to get a better report card, provinces and/or schools may discourage enrolment in mathematics (which is not in the national interest).
Then this is complemented by Metric 3: Percentage of learners obtaining over 50% in mathematics, which offers a measure of the quality of mathematics passes. Over 50% is a meaningful pass level for access into science, technology, engineering and mathematics (STEM) related degree programmes.
I repeat the same for physical science, another critical gateway subject for STEM programmes.
So Metric 4: Percentage of learners enrolled in physical science is accompanied by Metric 5: Percentage of learners obtaining over 50% in physical science.
As the last metric, I have selected the number of learners writing NSC with special educational needs (SEN). It shocks me that we have so few SEN learners writing their exams.
I have chosen as Metric 6: Measure of the number of SEN candidates per 500 NSC candidates. The unit of per 500 learners is arbitrary, but this at least draws attention to the seemingly very low identification (and hence support) for learners who face barriers to learning.
So I have chosen six metrics that I consider important when judging the attainment of the Class of 2020:
For each metric, I offered a “very good” comment to metrics that were higher than one standard deviation from the average across provinces, and a “very poor” comment to metrics that were lower than one standard deviation from the average.
Next I calculated a “poverty factor” for each province. There are very few global undeniable truths about education. One of them is that learning attainment correlates strongly with socioeconomic status (the wealthier the neighbourhood, the higher the results). We cannot ignore this.
The poor and rural provinces have a much steeper hill to climb than the urban richer provinces. Think roads. Think electricity. Think hunger and employment. Think about distances, access to devices, access to data, photocopiers, parents who are educated. Family members who are employed.
Because the poorer rural provinces have the odds stacked against them, I apply a poverty factor to their performance. Now, how I work out a poverty factor may be rebutted and hopefully improved. I know there are people far more competent in stats and economics than I am. I hope they use what I do as a straw dog and push against it – so we have a more robust poverty factor to use in future.
Now hold onto your seats. Breathe. This is how I worked out a crude provincial “poverty factor”.
I took the GDP per capita figures for each province. The ones I could find quickly from StatsSA were from 2017. That was when the Class of 2020 was in Grade 8, just entering secondary school. Good enough, I guess. I don’t think we have wild swings in relative GDP per capita per province. I then took the ratio of the provincial GDP per capita, to the national GDP per capita. I inverted this so that it changes from a wealth factor to a poverty factor.
Need an example? Okay.
Let’s compare Gauteng to Eastern Cape. Our national GDP per capita is R81,875.
Gauteng’s GDP per capita is R111,171.
So the Gauteng wealth factor is “111,171 divided by 81,875” = 1.4.
Gauteng is wealthier than the national average by x1.4.
The Gauteng poverty factor is 81,875 divided by 111,171 = 0.7.
Eastern Cape’s GDP per capita is R55,094.
So the Eastern Cape wealth factor is “55,094 divided by 81,875” = 0.7.
The Eastern Cape poverty factor is “81,875 divided by 55,094” = 1.5
To take into account the socioeconomic status (SES) of each province, I then applied the poverty factor to their TOTAL RAW SCORE (the sum of the six metrics). Because Gauteng is wealthy, its raw score is adjusted downwards (by x0.7). Because Eastern Cape is poor, its raw score is adjusted upwards by x1.5.
And now… Ta da! I can present my provincial report cards for the Class of 2020.
Comments:
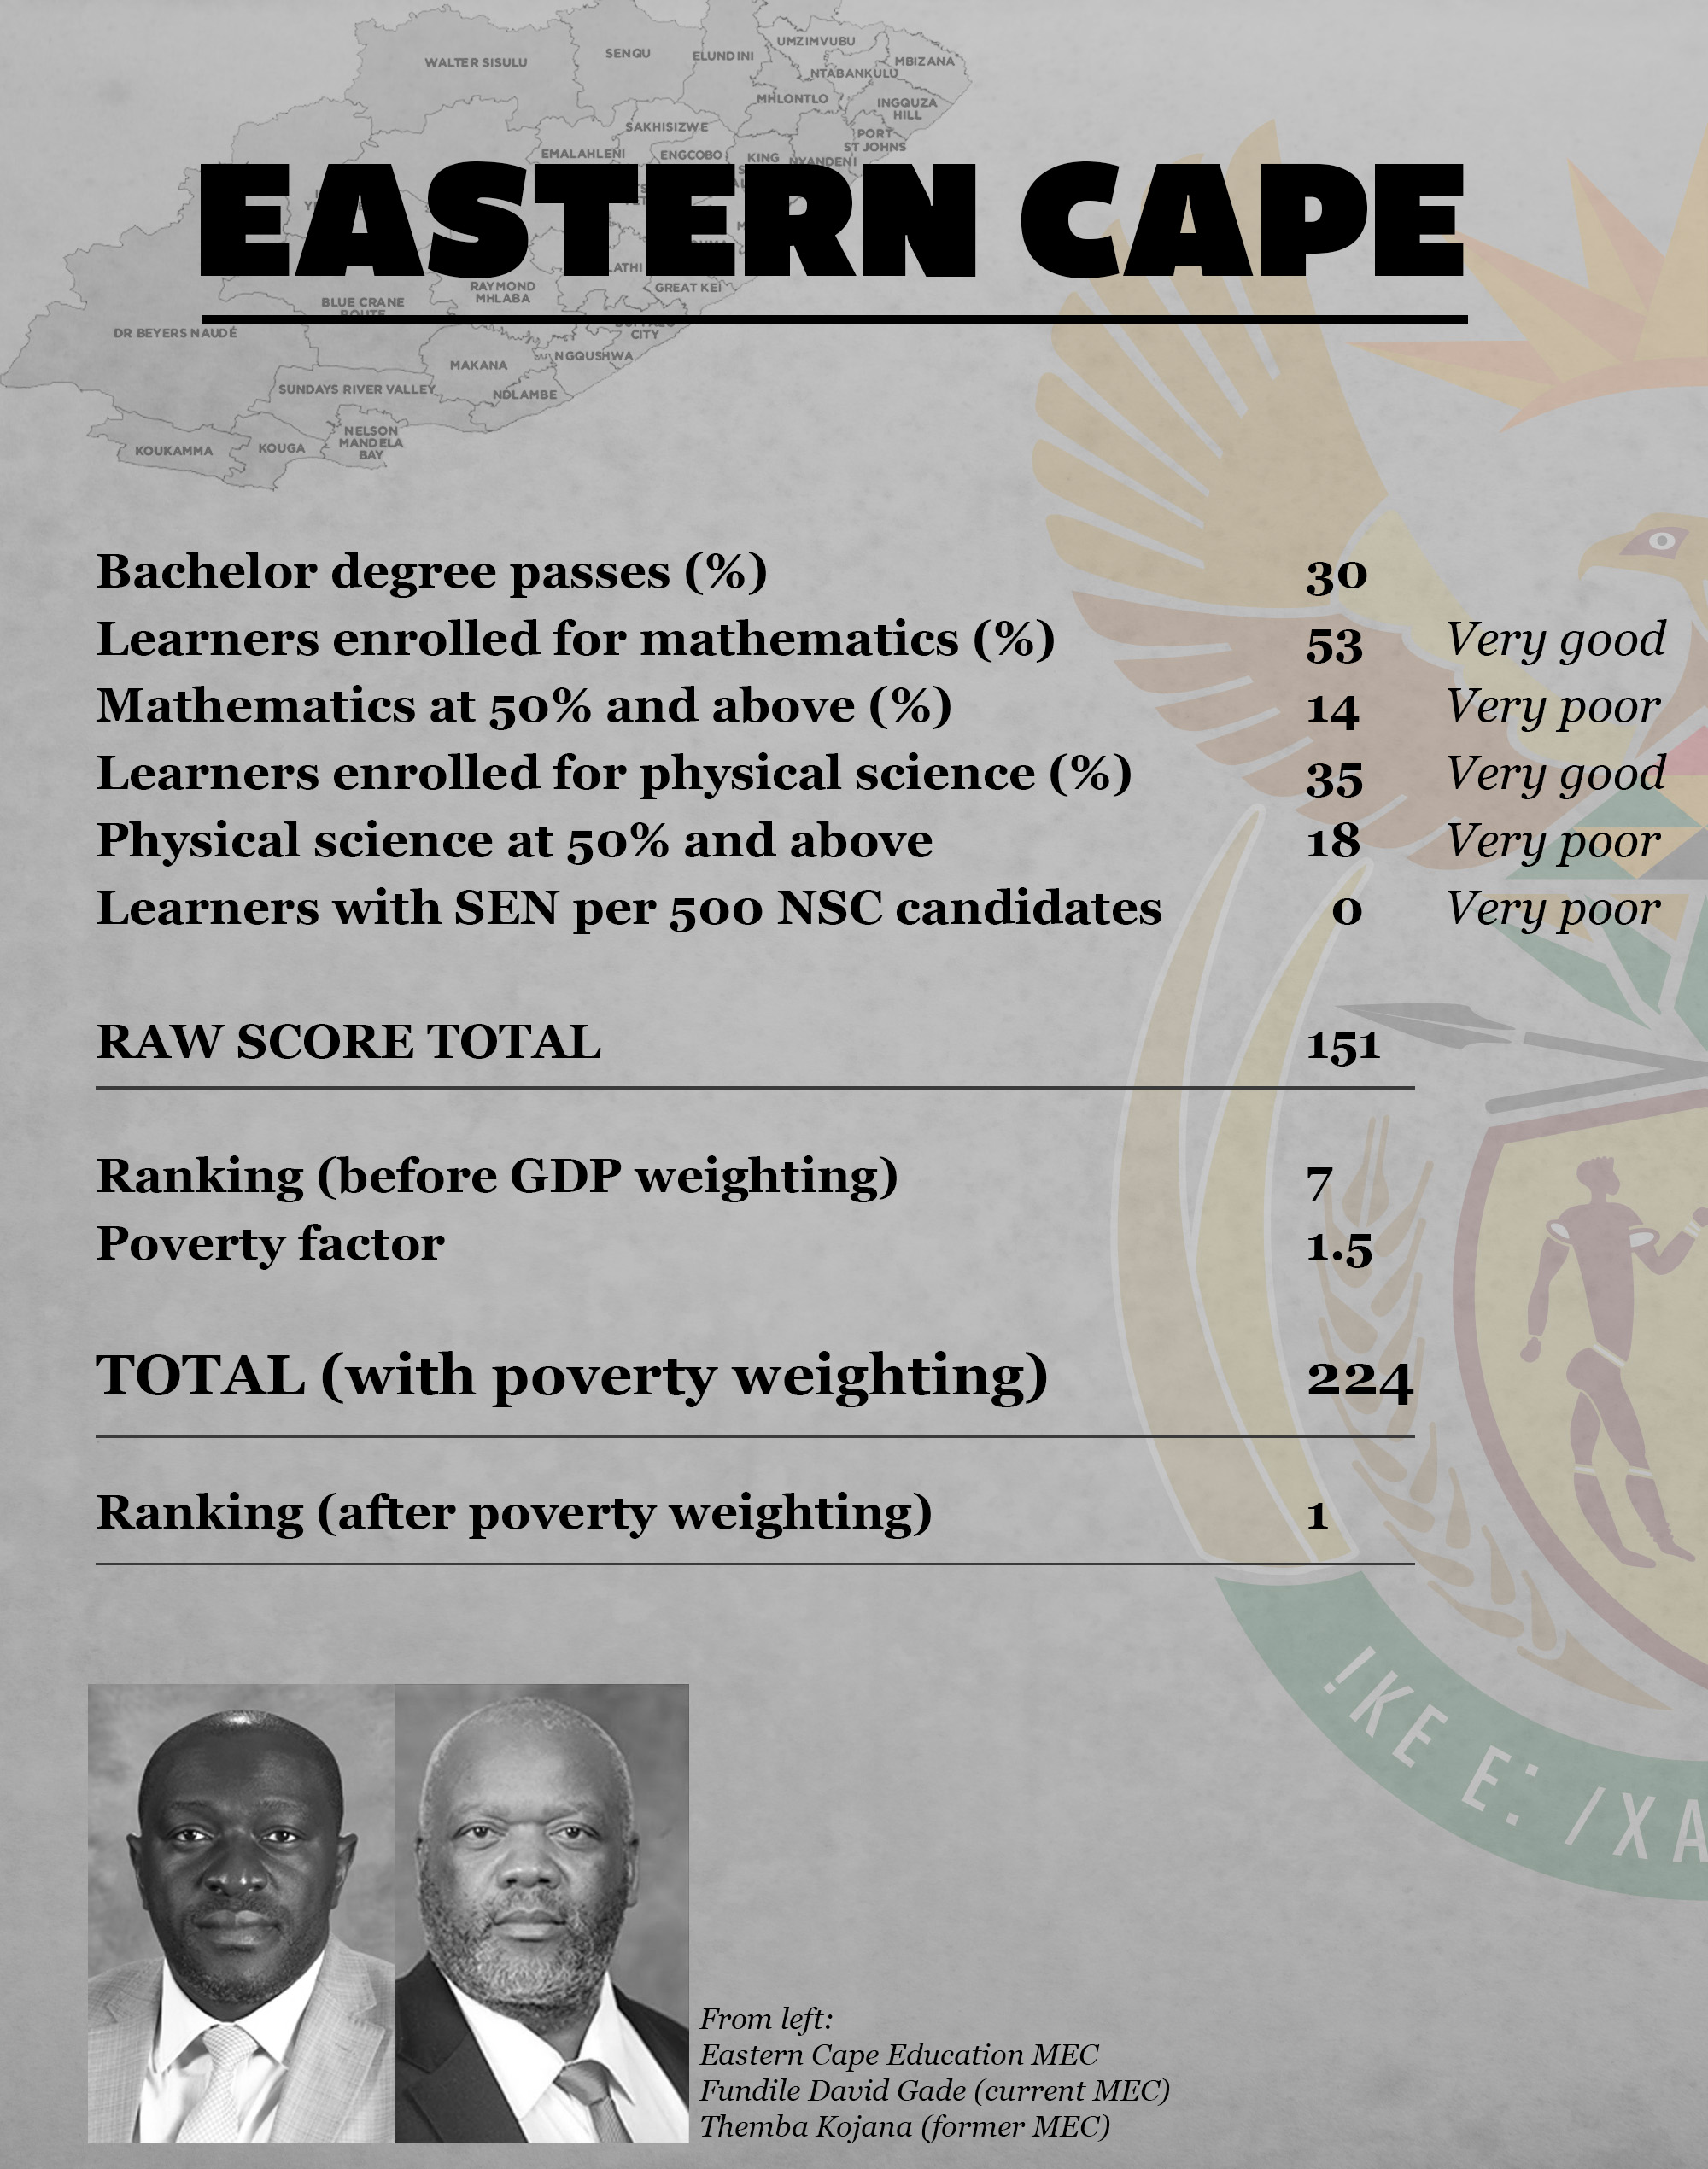
Eastern Cape has claimed the #1 position in the provincial rankings this year. Congratulations.
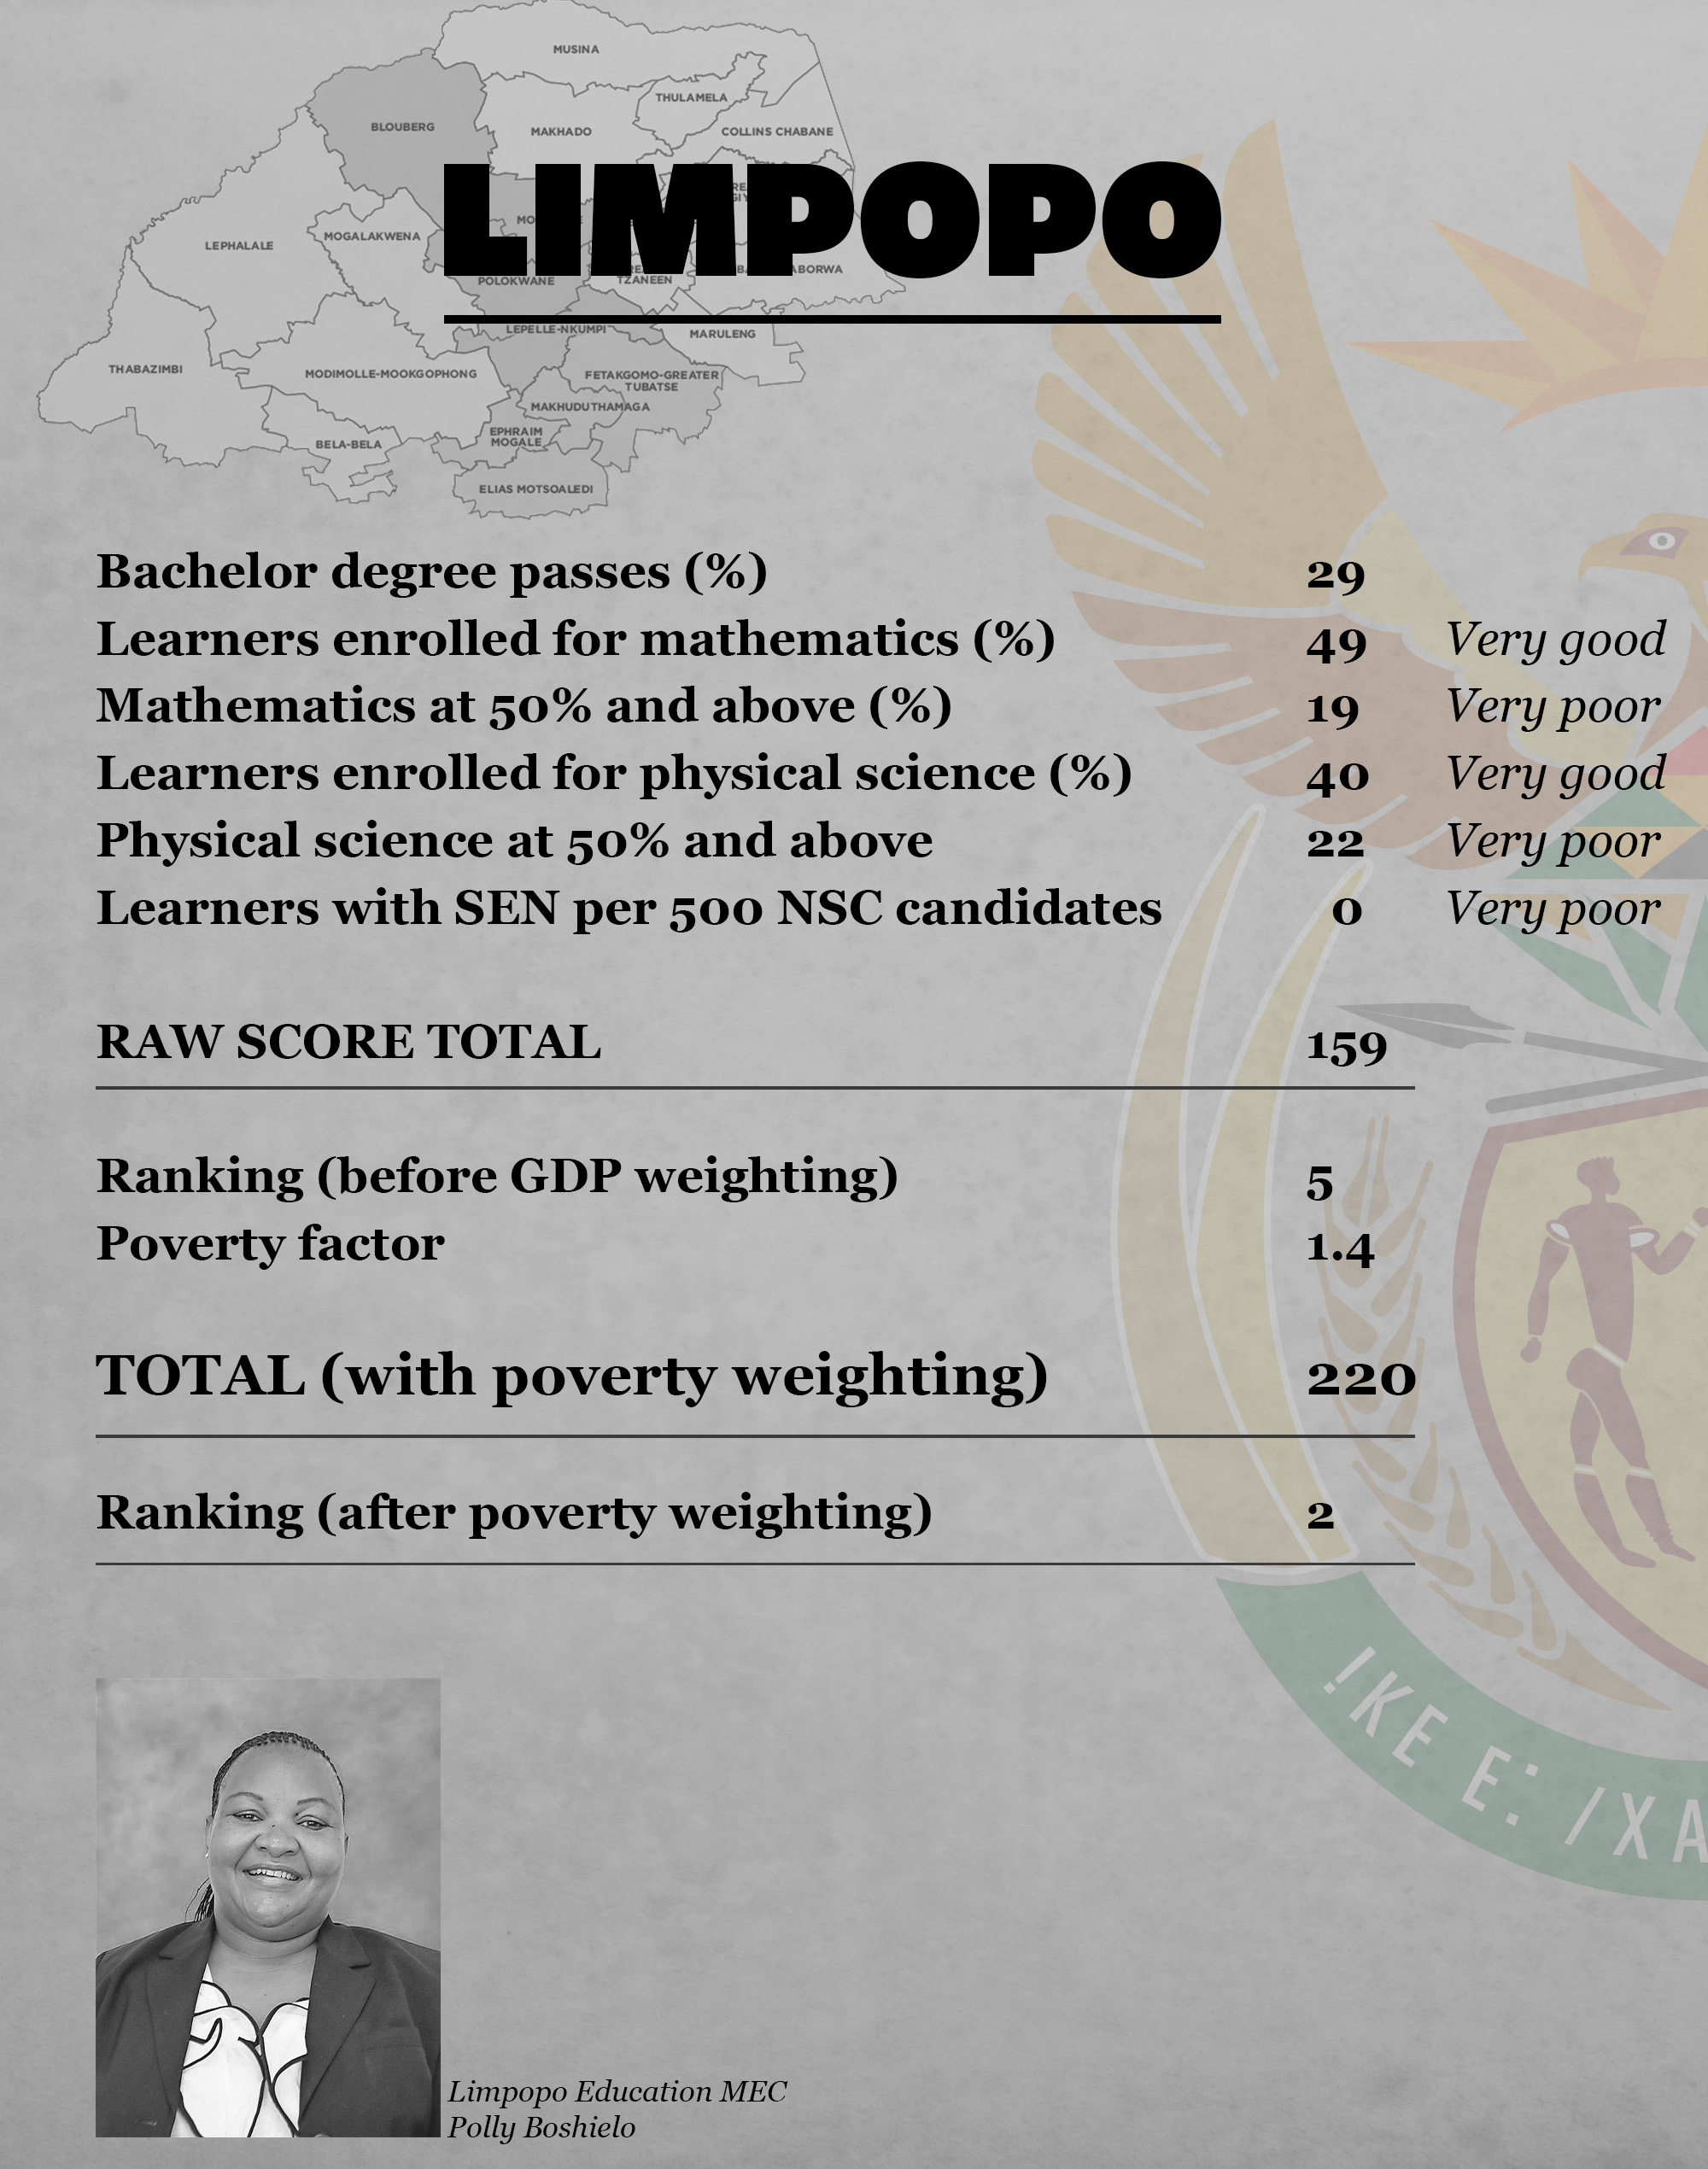
Don’t get too comfortable though, Eastern Cape. Limpopo is very close behind.
Eastern Cape has encouraged learners to stay enrolled in mathematics with an excellent 53% of candidates taking maths. Quality passes in this lag behind, however.
Similarly, enrolments in physical science are high nationally, but once again the quality of passes is disappointing. There is also serious concern about the low numbers of learners identified for SEN support. I hope to see a big improvement in this next year.
In future I would like to see their proportion of bachelors passes from no-fee schools to reflect on their redress targets. I am also interested to see how their bilingual (isiXhosa/Sesotho and English) NSC assessment pilot is working, and expect this to be embedded into their system over time.
MEC Themba Kojane, you were well loved and will be dearly missed. Hamba kakuhle.
Comments:
Limpopo has done well in relation to enrolments for mathematics and physical science. However, the quality of its passes in these subjects is poor. There is also serious concern about their low numbers of learners identified for SEN support. I hope to see a big improvement in this next year.
Considering its socioeconomic status, Limpopo has fared well, having been ranked second this year. I think Limpopo could claim first place if it focuses on improving quality maths and science passes.
I would like to see their proportion of bachelor’s passes from no-fee schools to reflect on their redress targets.
Comments:
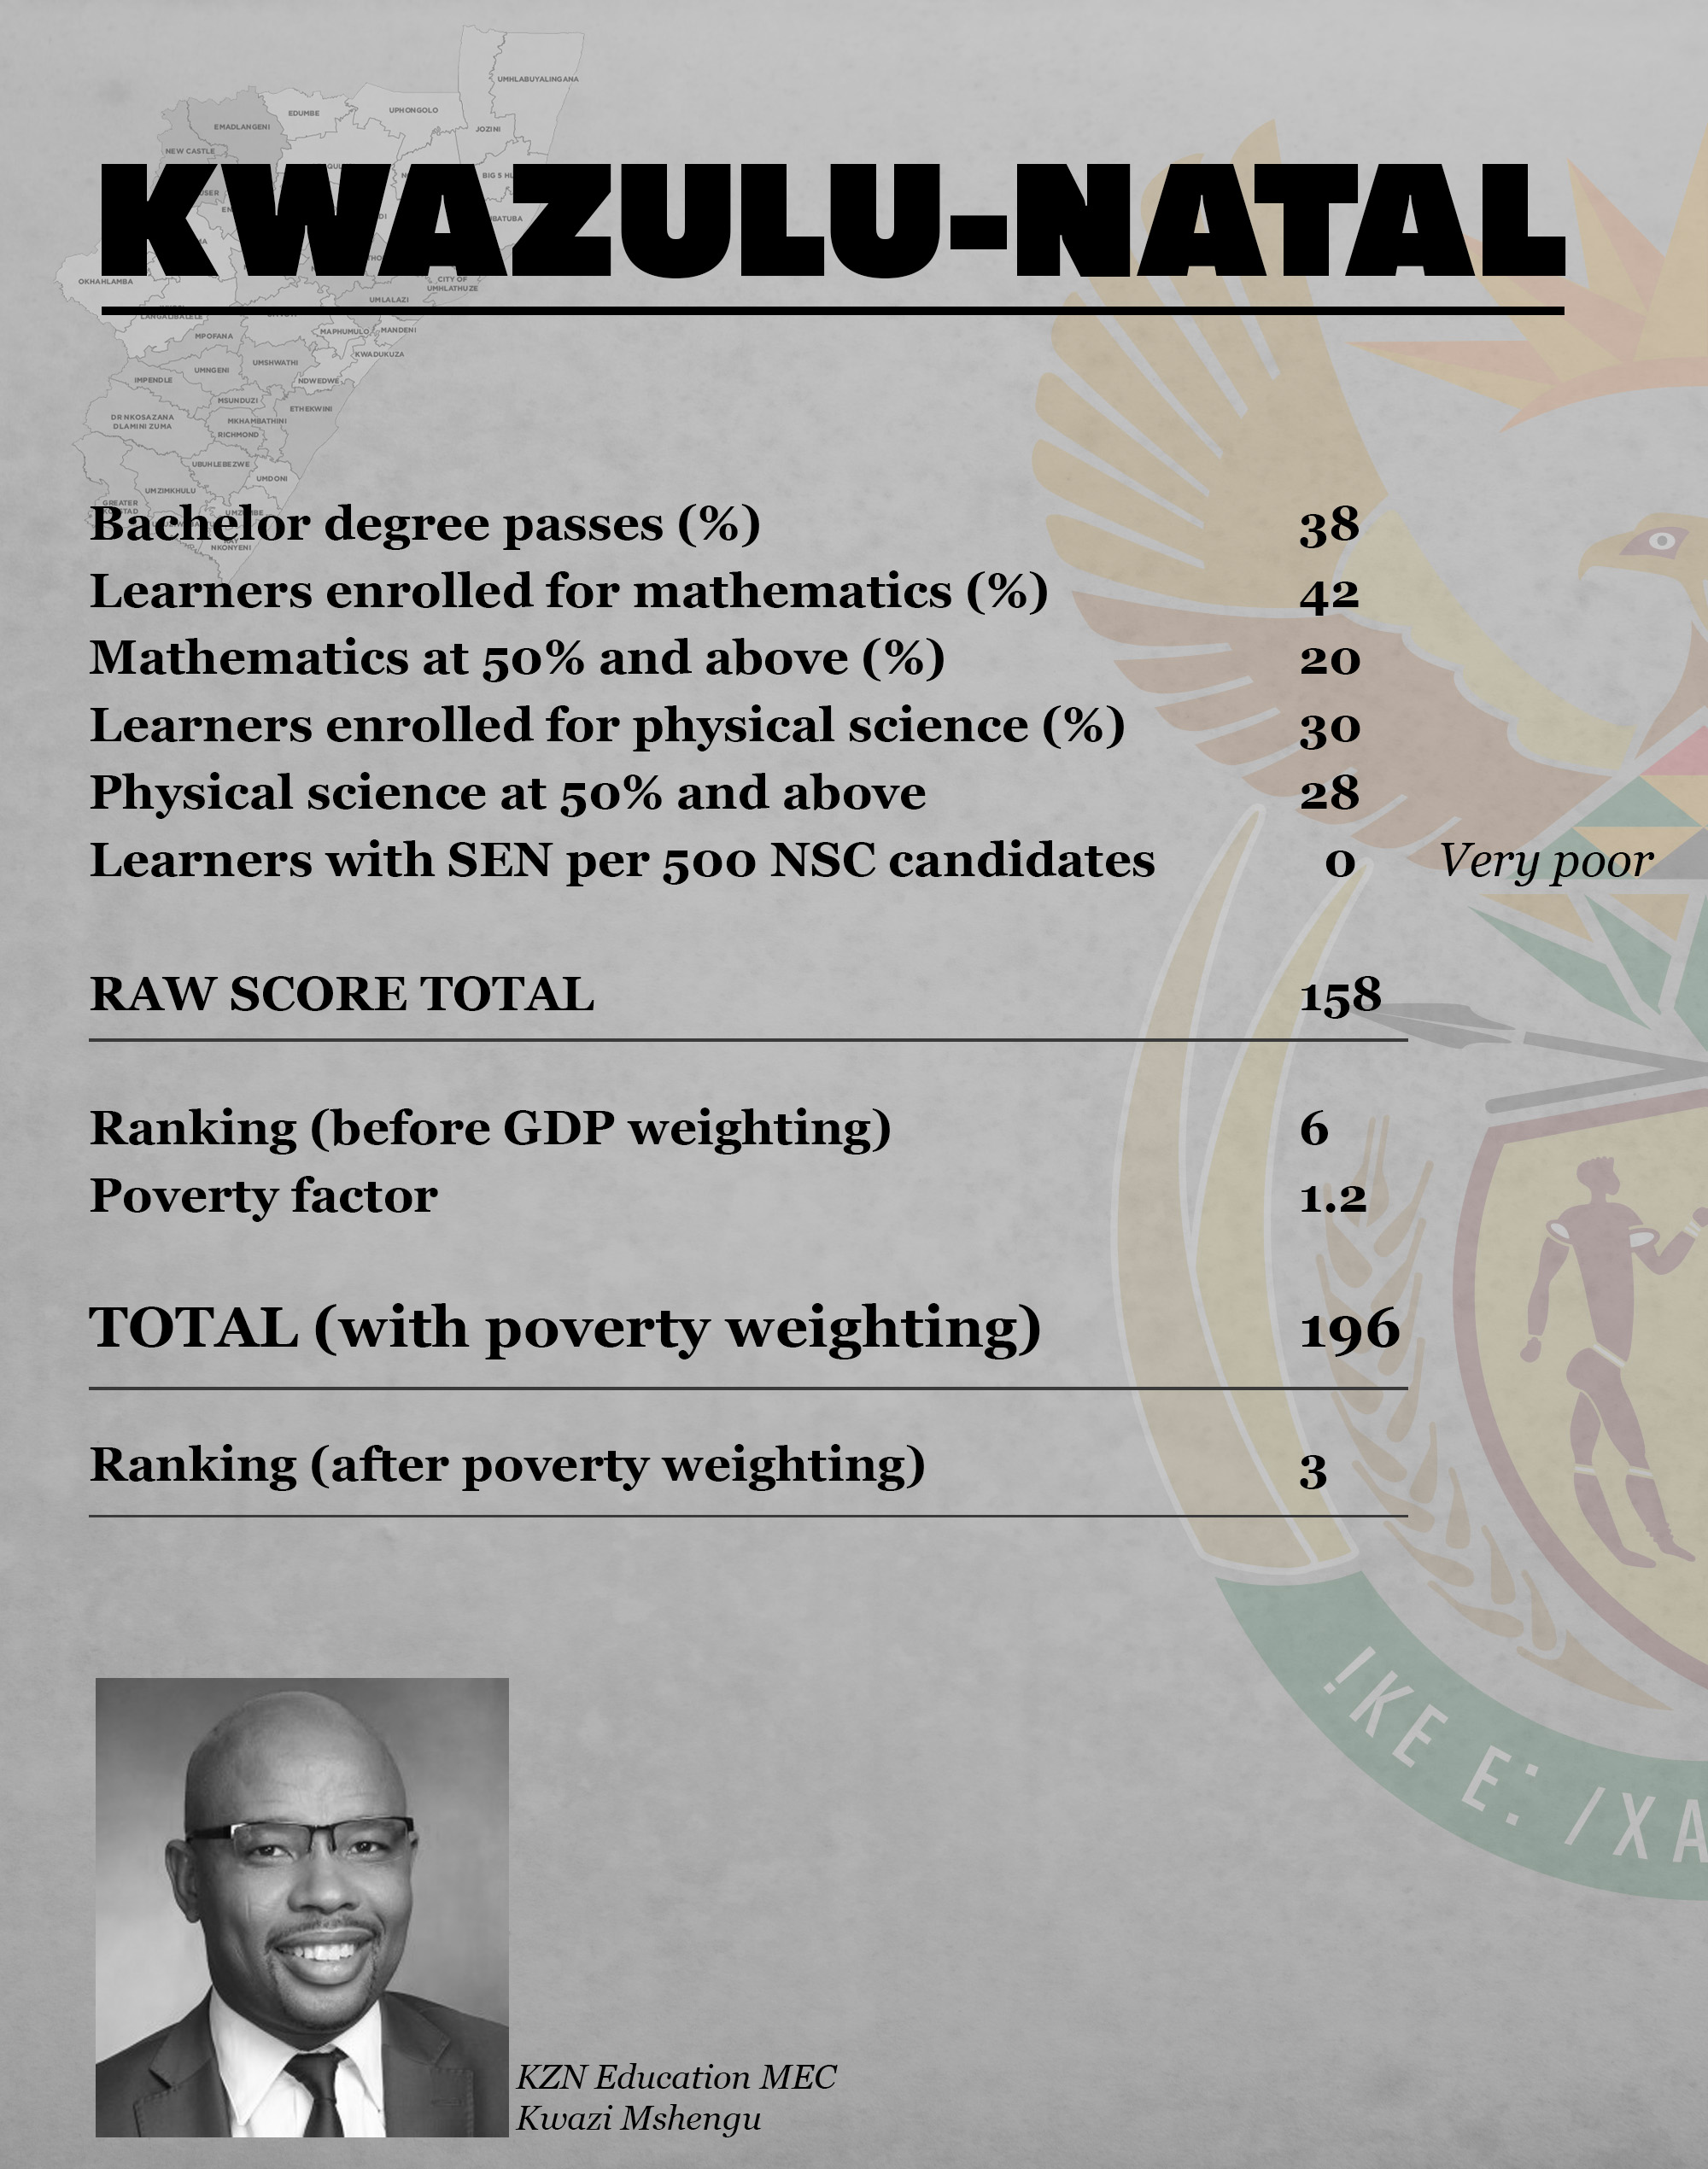
KZN can be proud of its proportion of bachelor’s degree passes. I hope to see it break the 40% mark in future.
KZN has encouraged learners to stay enrolled in mathematics with 42% of candidates taking maths. Quality passes in this lag behind, however.
Similarly, enrolments in physical science are high compared with nationally, but once again the quality of passes is disappointing. There is also serious concern about their low numbers of learners identified for SEN support. I hope to see a big improvement in this next year.
In future I would like to see their proportion of bachelors passes from no-fee schools to reflect on their redress targets. Considering its huge size and socioeconomic status, KZN has done well – although there is nothing particularly exceptional (as in either very poor or very good).
Comments:
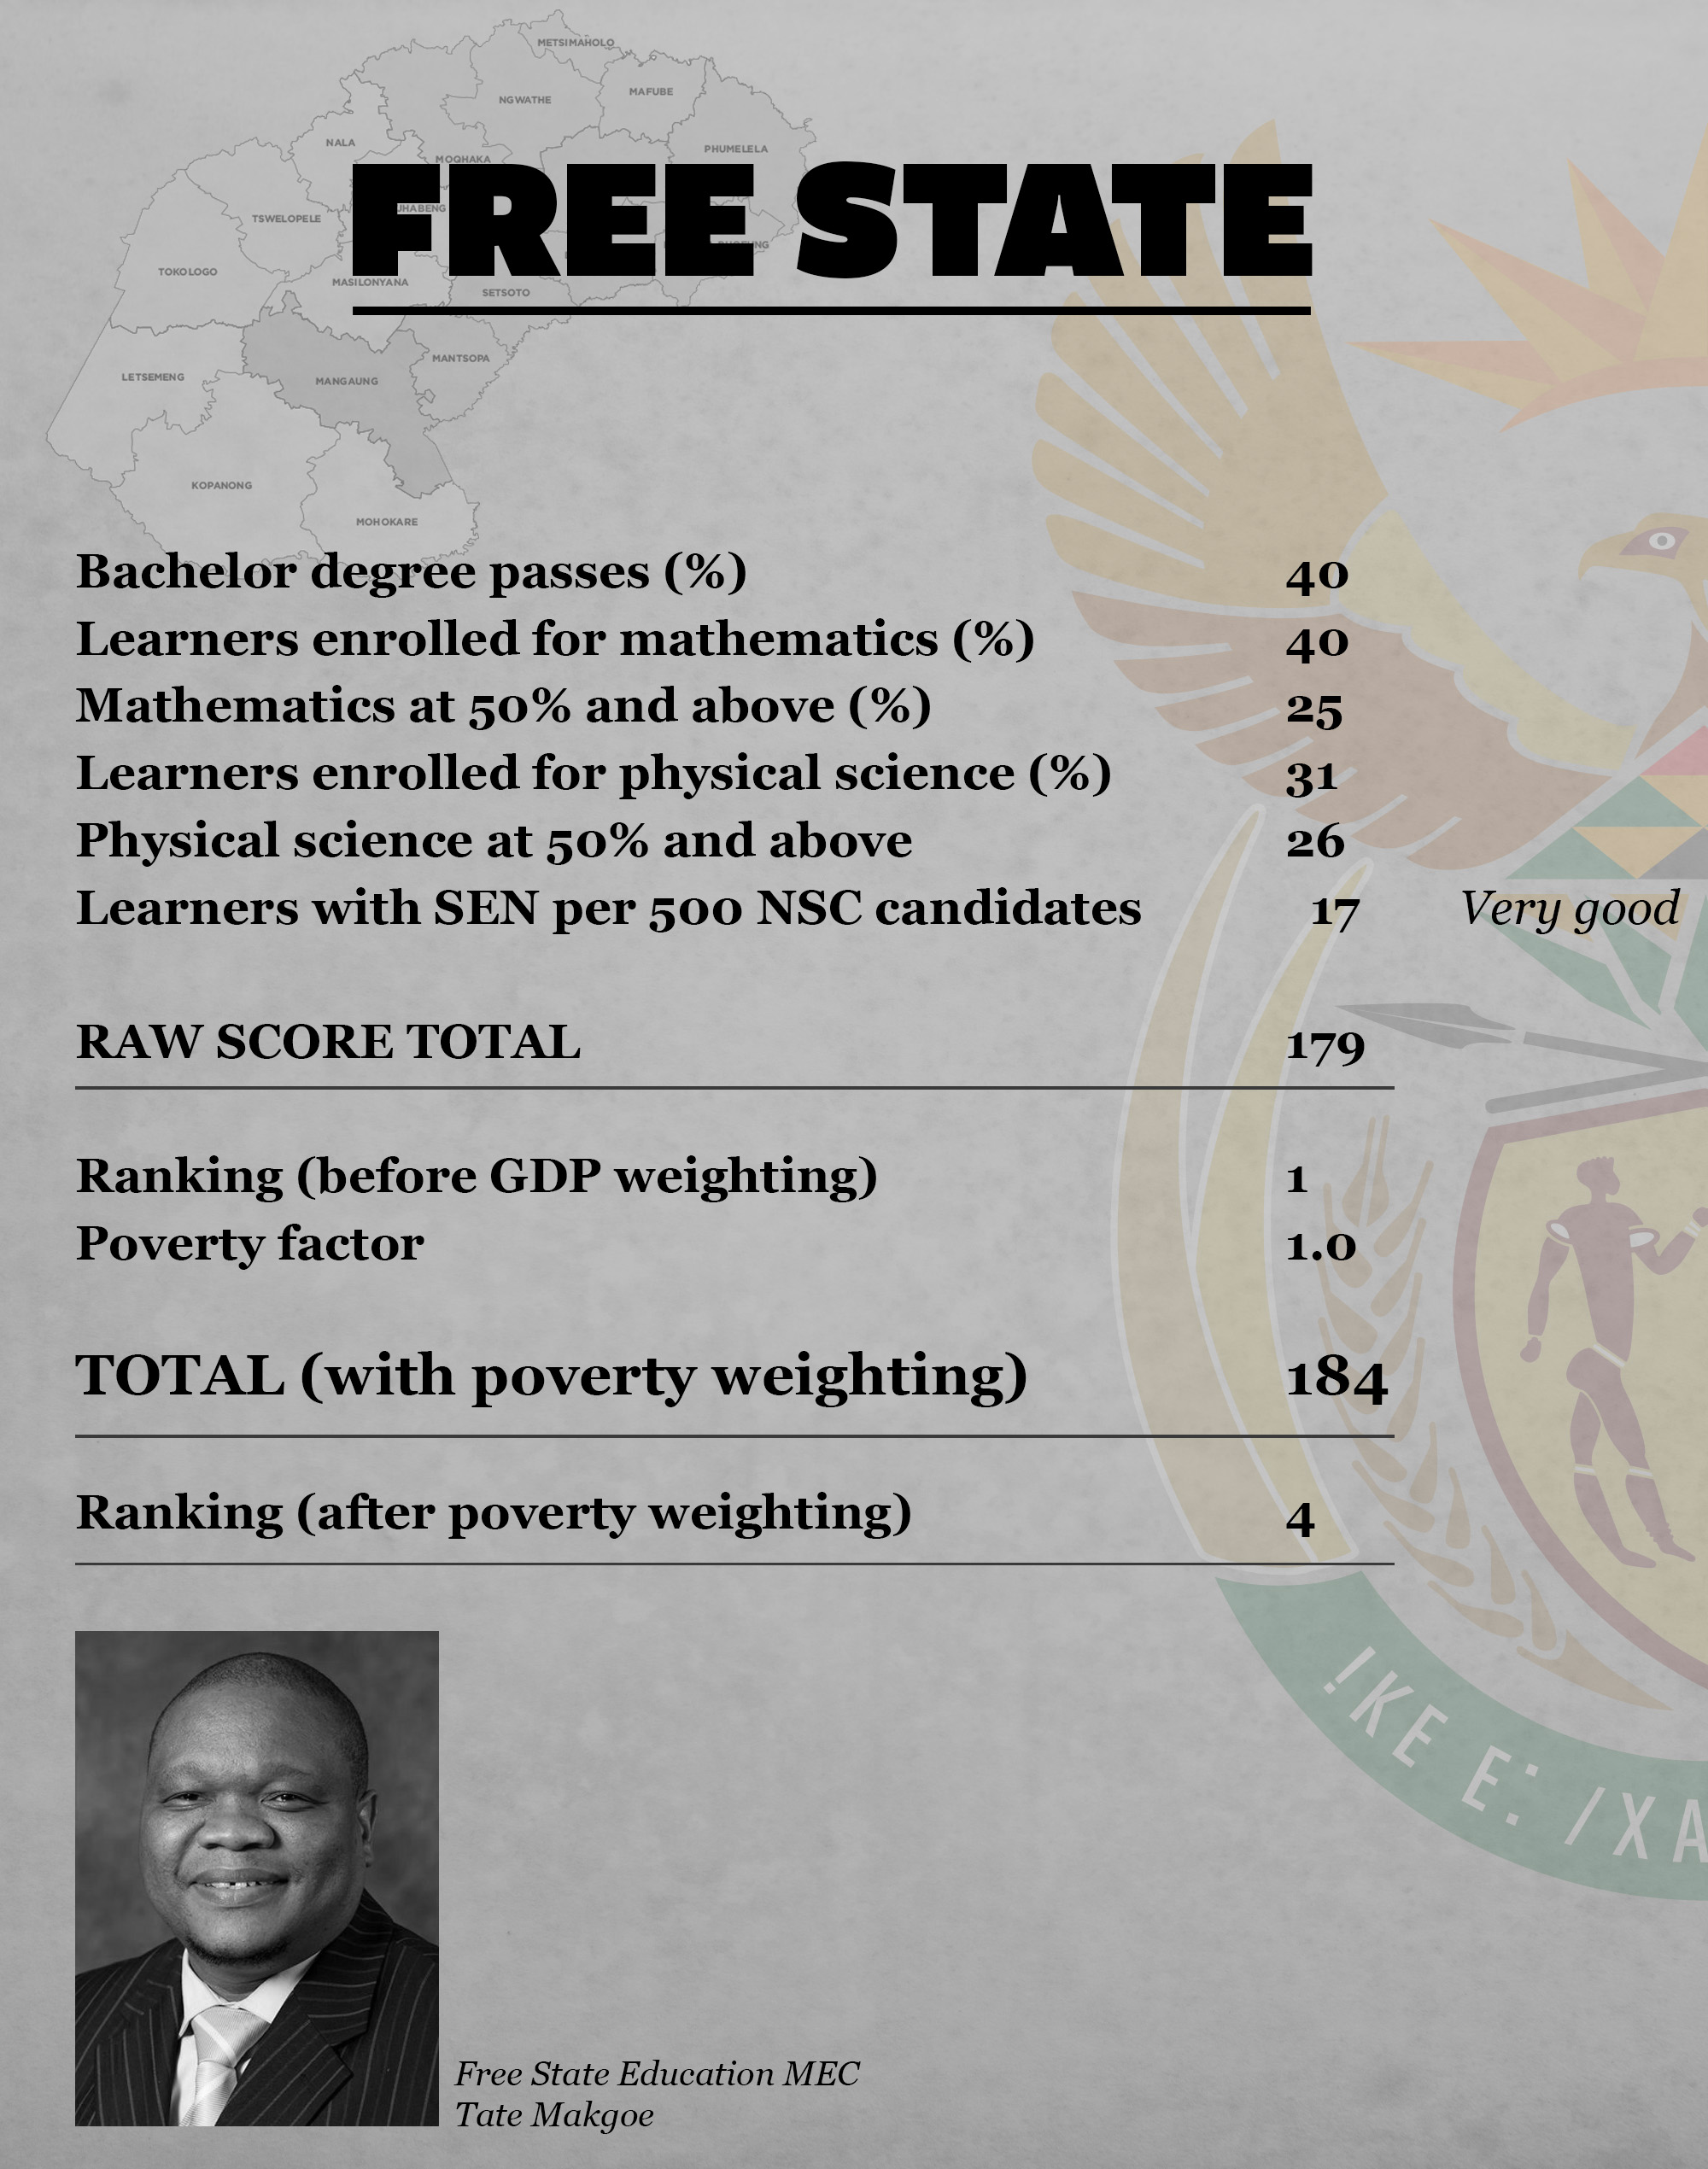
Free State represents the national average and punches above its weight. It has 40% of its learners getting bachelor’s degree passes. Its poverty factor of just more than 1 is the same as that of Mpumalanga and Northern Cape, and yet it does far better. It places comfortably in the top half of provinces.
It has too many (60%) learners taking maths literacy or technical maths, and should aim for a higher mathematics enrolment. That said, it is getting better quality passes than the more rural provinces.
Its enrolment for physical science is concerning at only 31%, and again quality of passes are concerning.
Where Free State leads the pack is in identification of SEN learners. Please help the other provinces in this area.
In future I would like to see their proportion of bachelors passes from no-fee schools to reflect on their pro-poor targets.
Comments:
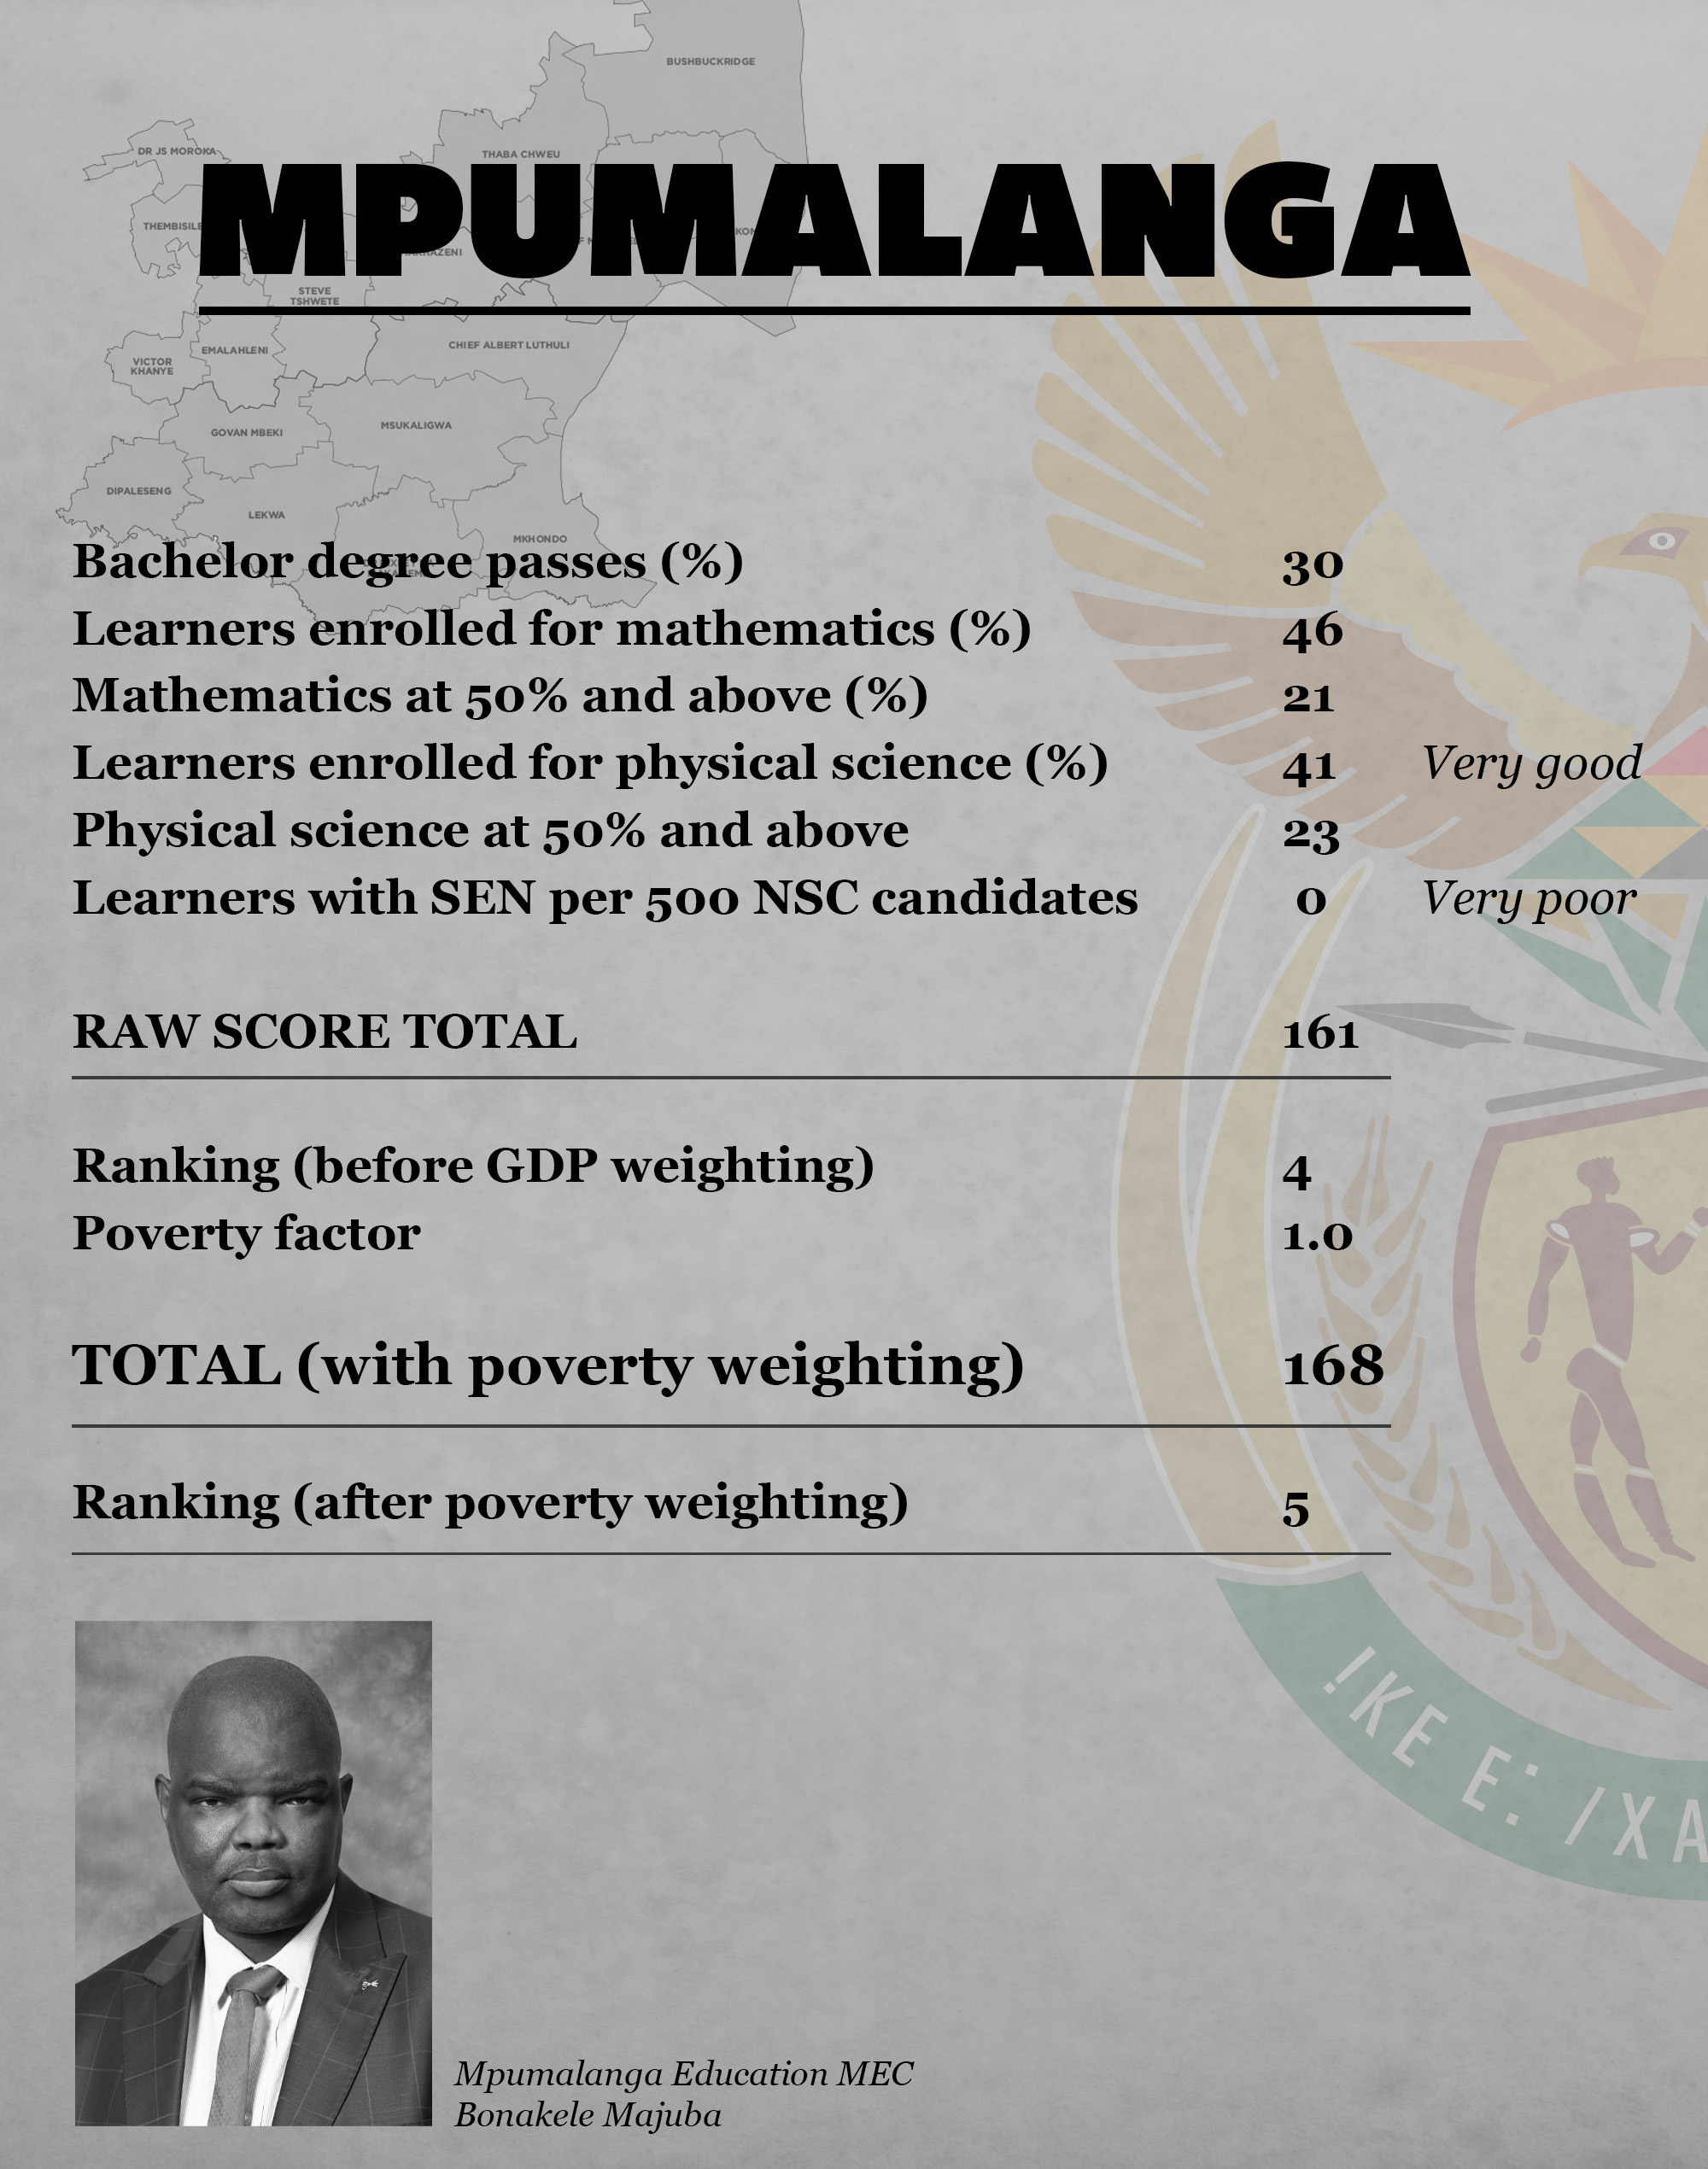
Mpumalanga represents the national average for socioeconomic status, but it lags behind Free State (which has a similar SES context). 70% of its learners fail to get a bachelor’s degree pass.
It’s enrollment in maths and physical science is okay, but ought to be over 50%. And the quality of passes in both subjects is concerning. There is also serious concern about their low numbers of learners identified for SEN support. I hope to see a big improvement in this next year.
In future I would like to see their proportion of bachelor’s passes from no-fee schools to reflect on their redress targets.
Comments:
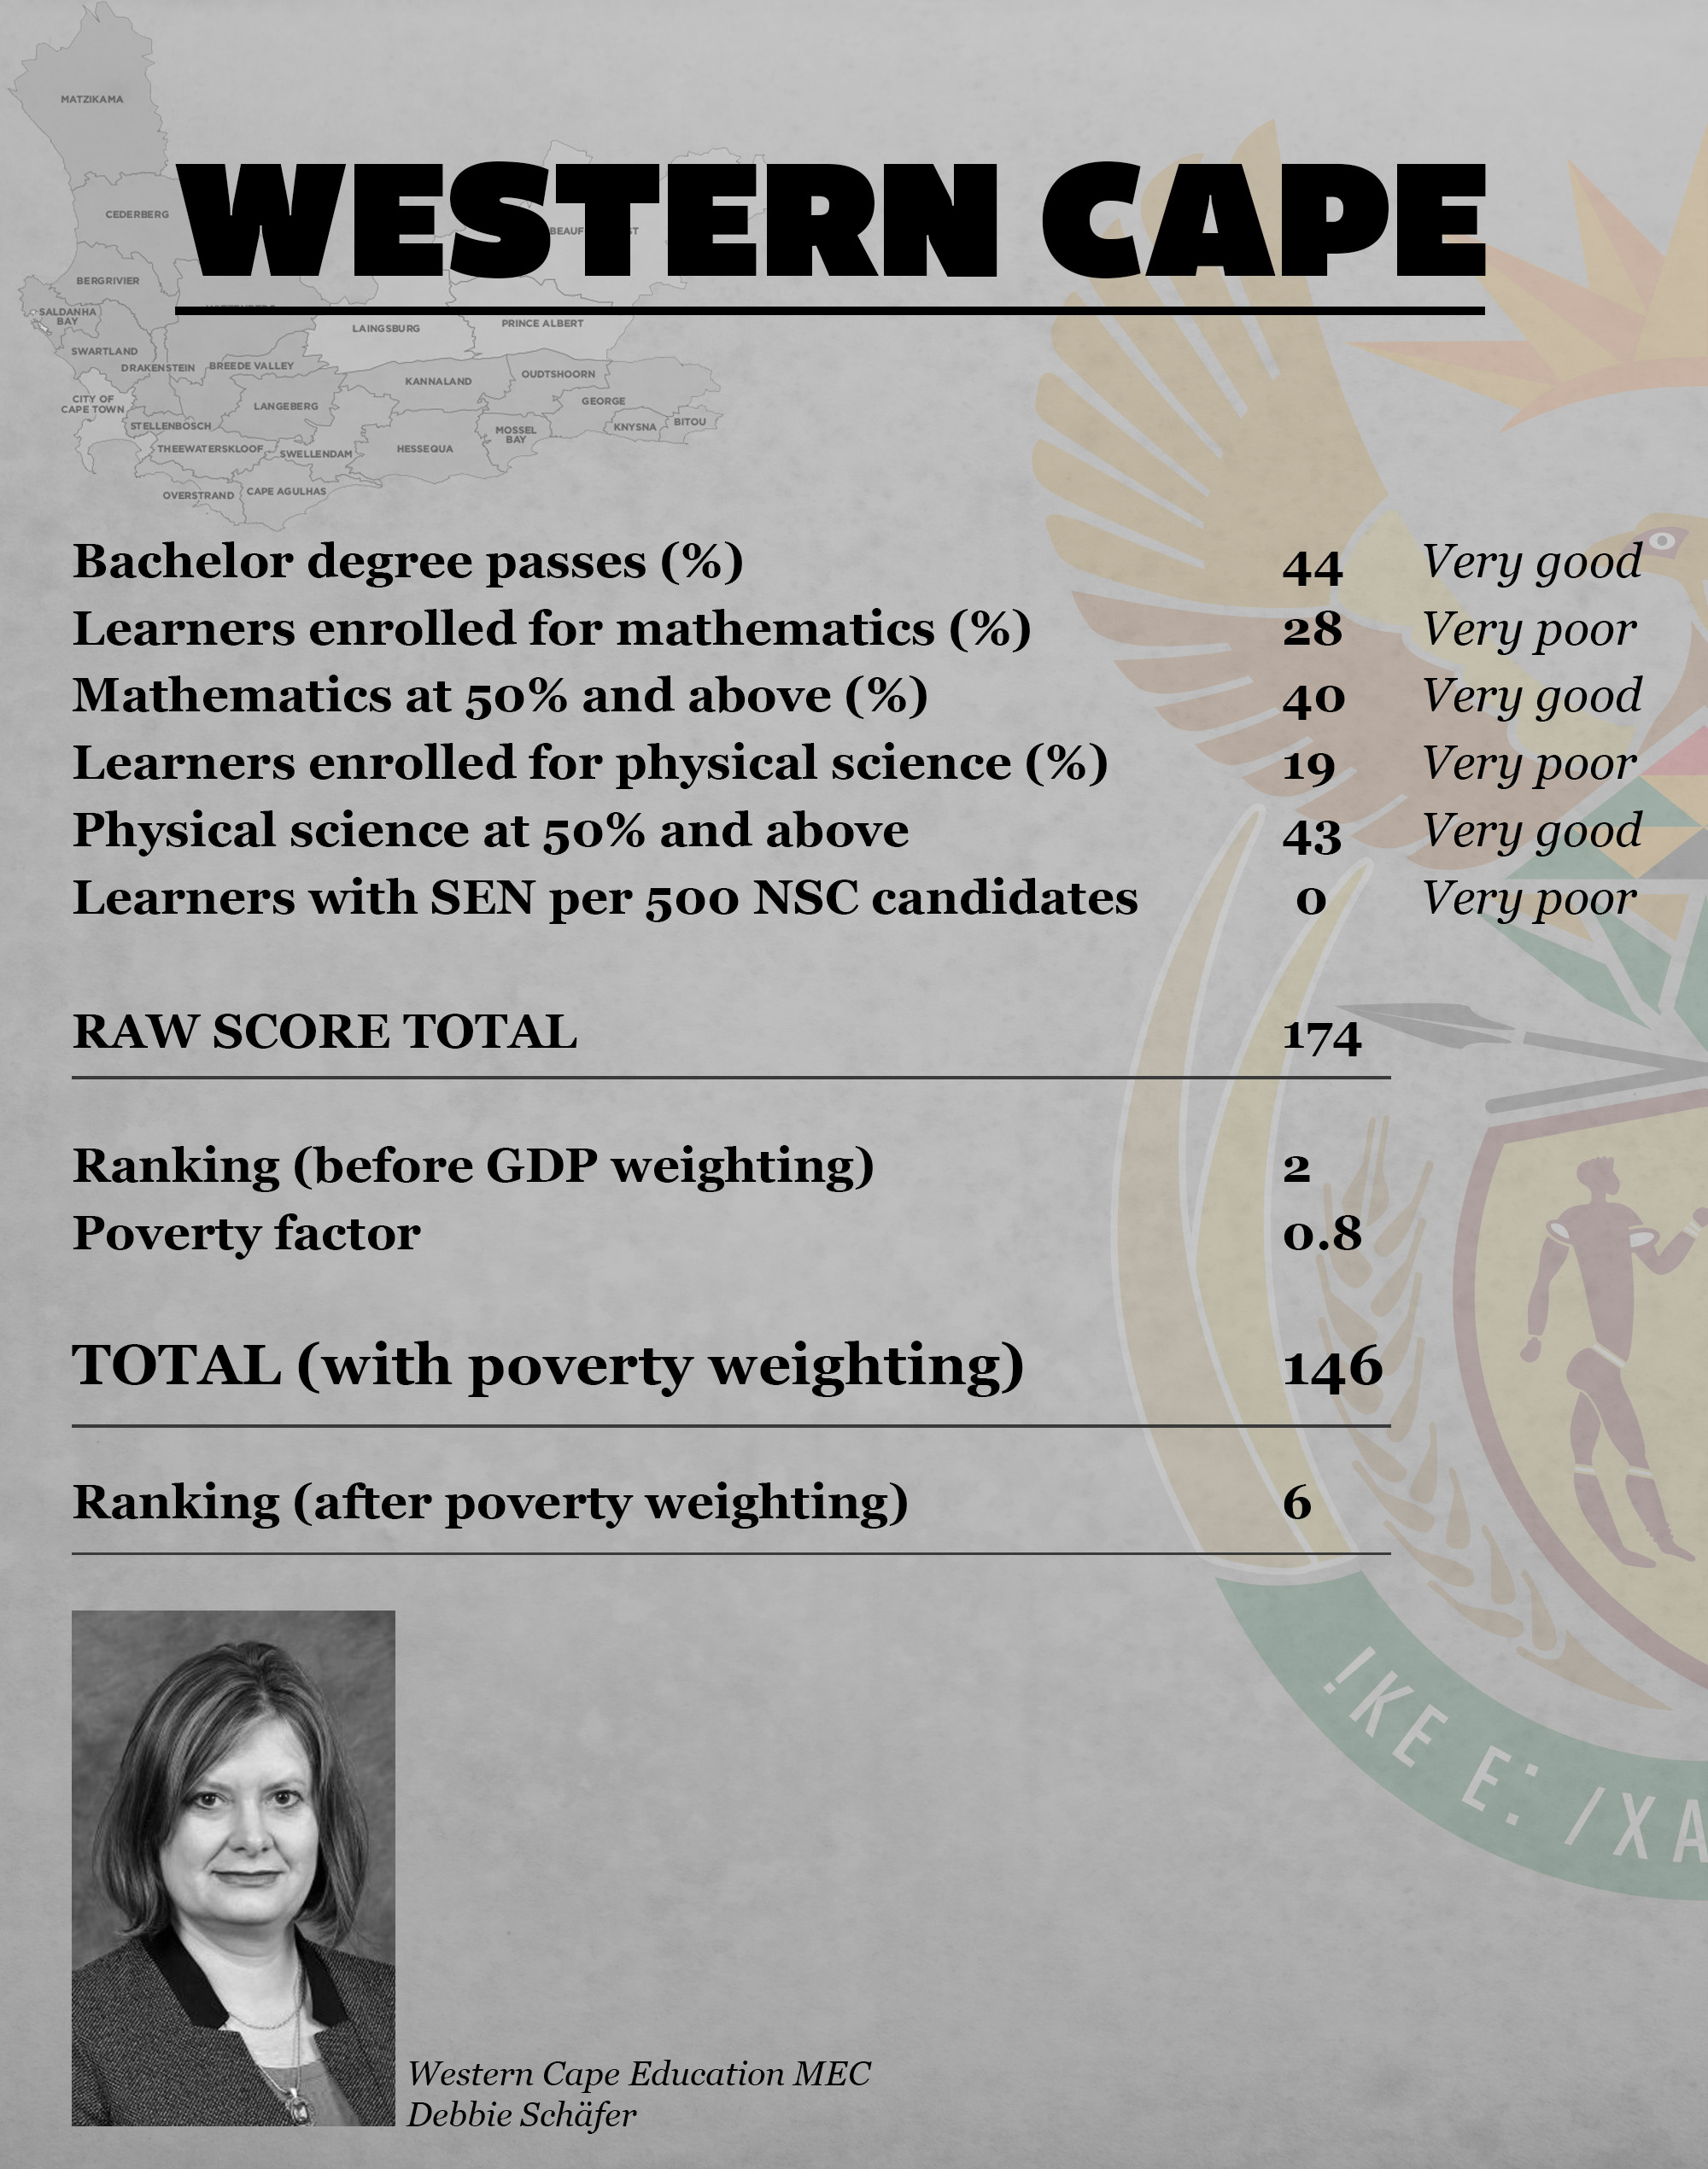
Western Cape is a province of extremes. It’s second-best in the proportion of bachelor’s degree passes, but Western Cape if one of the worst in terms of mathematics and physical science enrolment.
WCED, I hope you are not encouraging your learners to drop maths and physical science for easier options?
And I see historic data on “coloured” enrolments in these key gateway subjects is putrid. What is being done in Cape Town to narrow the gap between the Cape Flats and the suburbs? Whatever it is, it’s not enough.
In future, I would like to see their proportion of bachelor’s passes from no-fee schools to reflect on their redress progress.
There is also serious concern about their low numbers of learners identified for SEN support. I hope to see a big improvement in this next year.
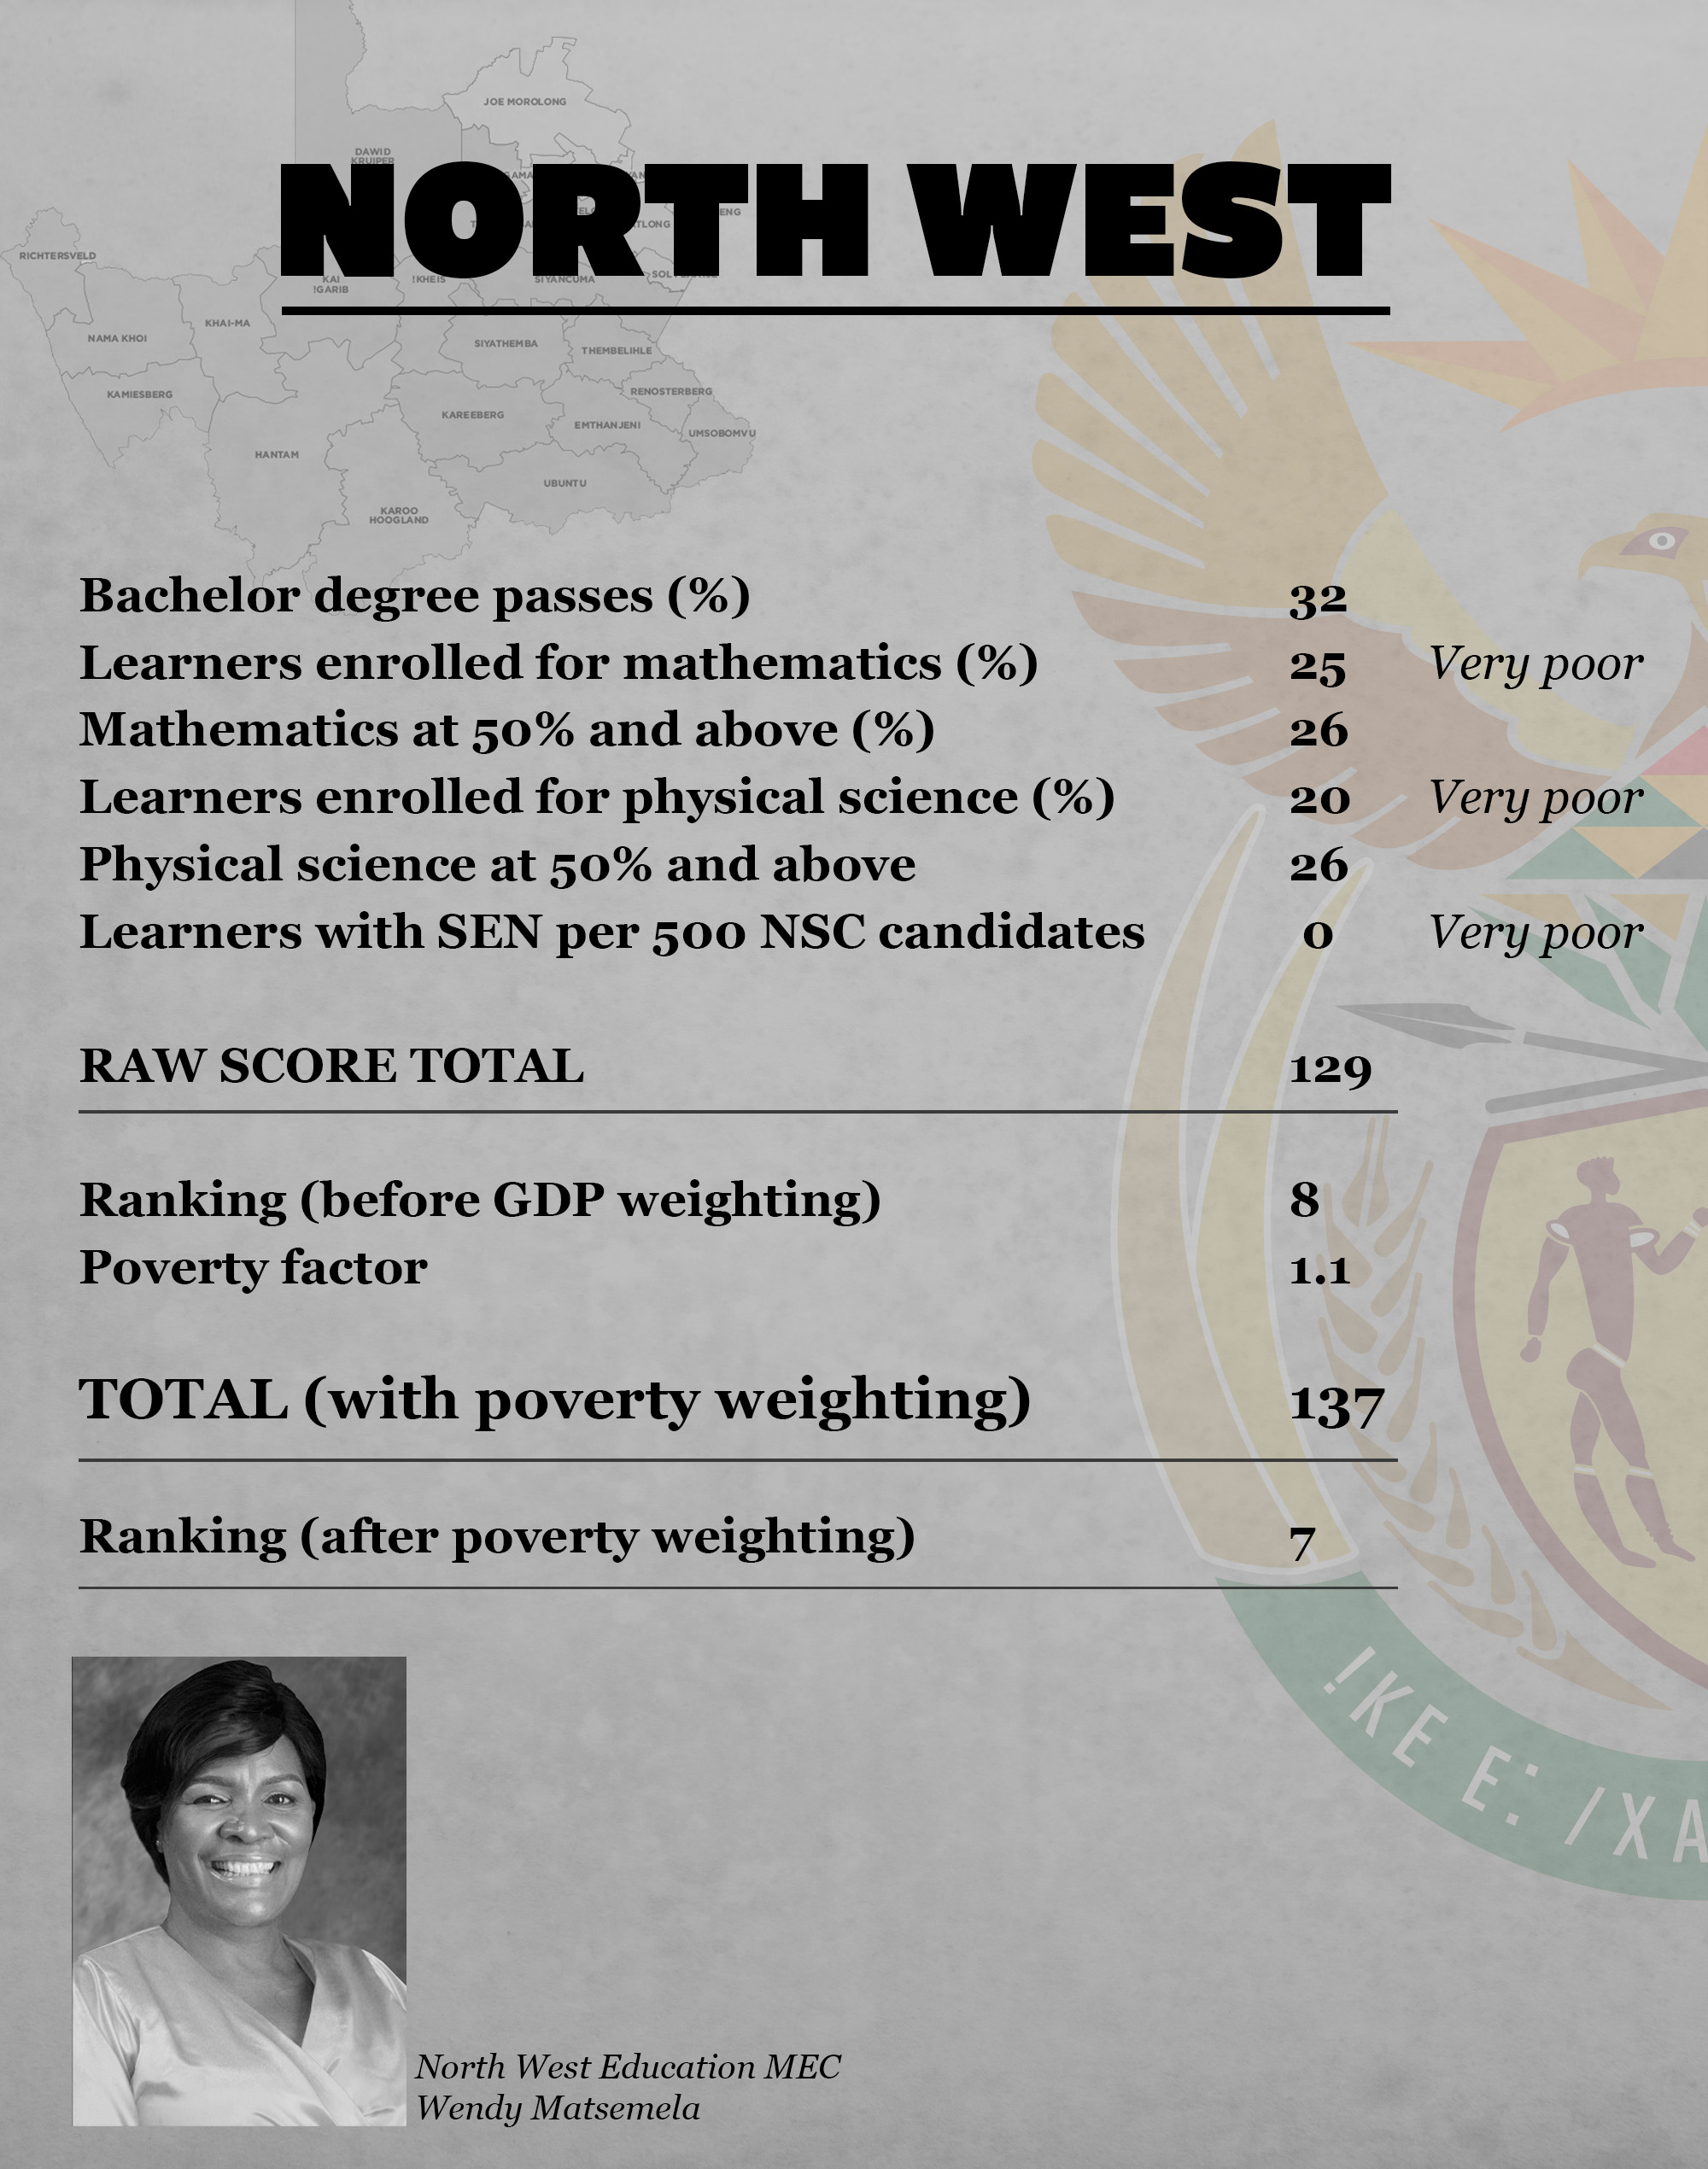
Comments:
North West has more minuses than pluses this year. We expect more. With a poverty factor of more than 1, we expect higher proportions of learners getting bachelor’s passes. 32% is on the higher end, but Free State has not broken the 40% mark – can you do it?
Very low enrolments in mathematics and physical science, and not great proportions of quality passes in these subjects either.
Please get some lessons from Free State on how to identify and support your learners with SEN.
Perhaps when I analyse your proportion of bachelor’s passes from no-fee schools, things will look better.
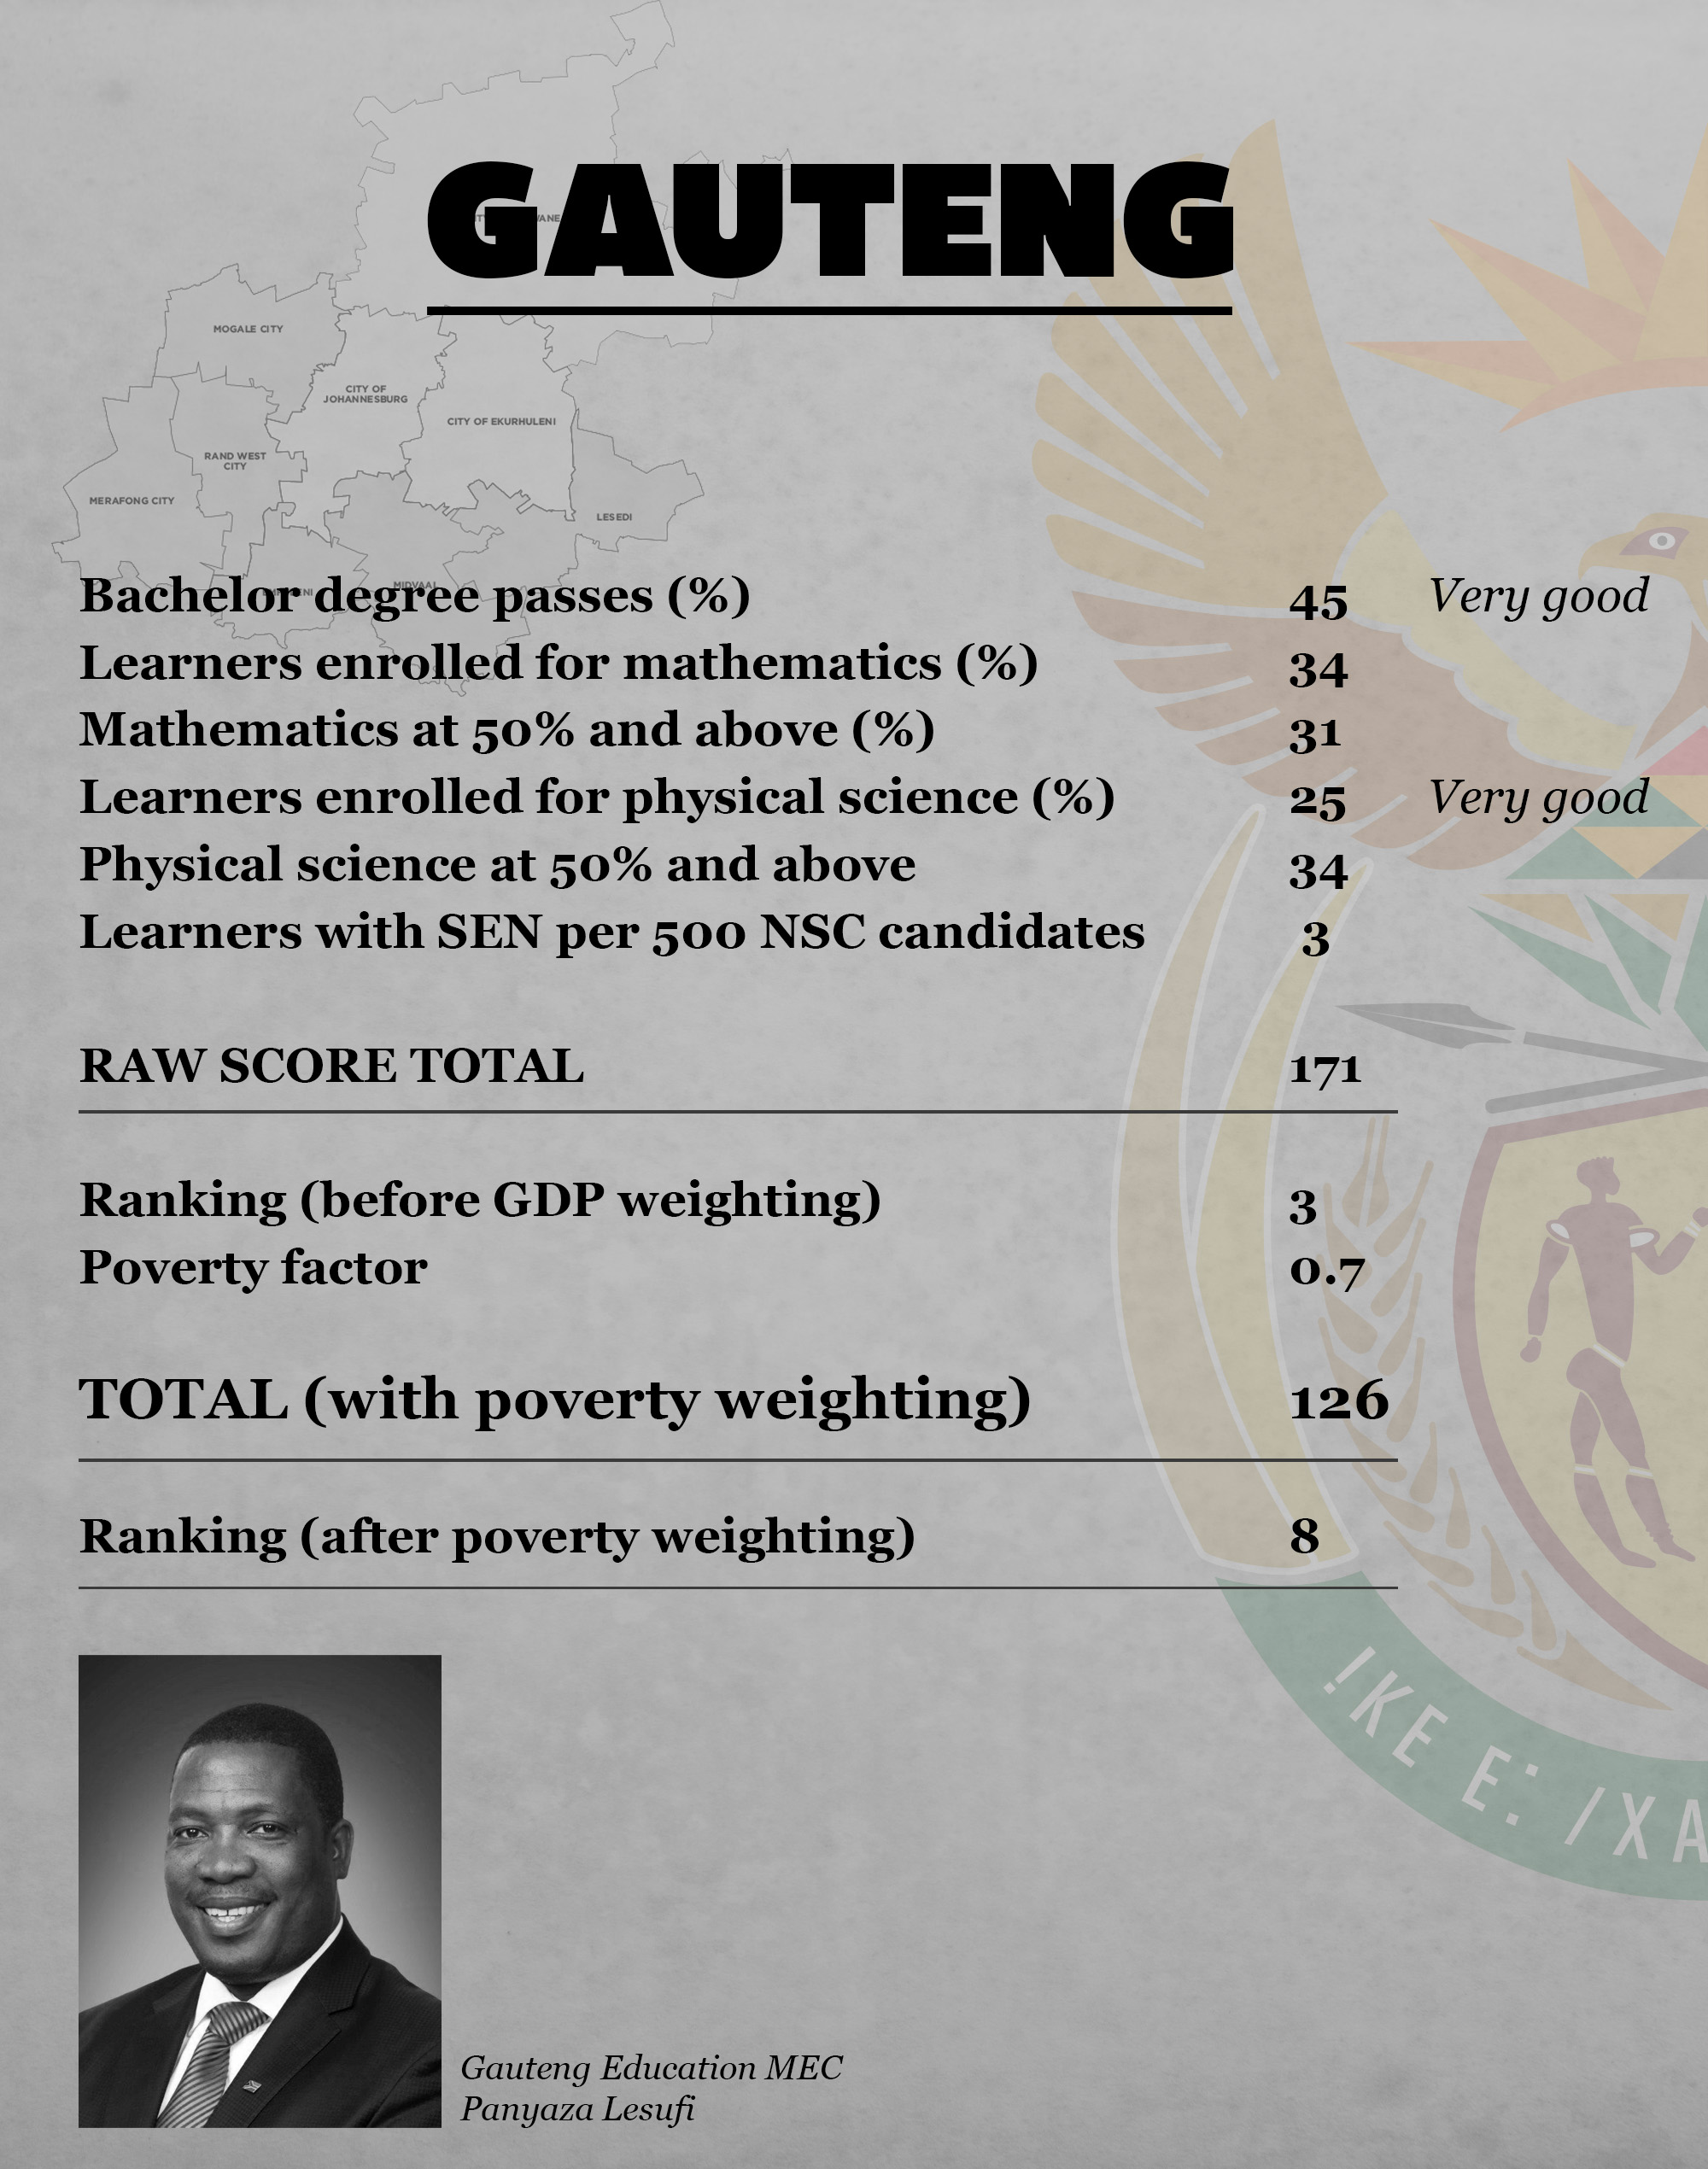
Comments:
I expect much from Gauteng, given its size, SES and infrastructure. I am therefore pleased to see it leading the pack in proportions of bachelor’s degree passes. Its district level performance is also excellent.
Gauteng also has a very good proportion of learners obtaining quality physical science passes. I would however like to see higher enrolment in the subject.
It also has some processes for identifying learners with LSEN, although, as with all provinces, this is an area where I expect improvement.
I hope to see progress on redress when looking at the proportion of bachelor’s passes from no-fee schools.
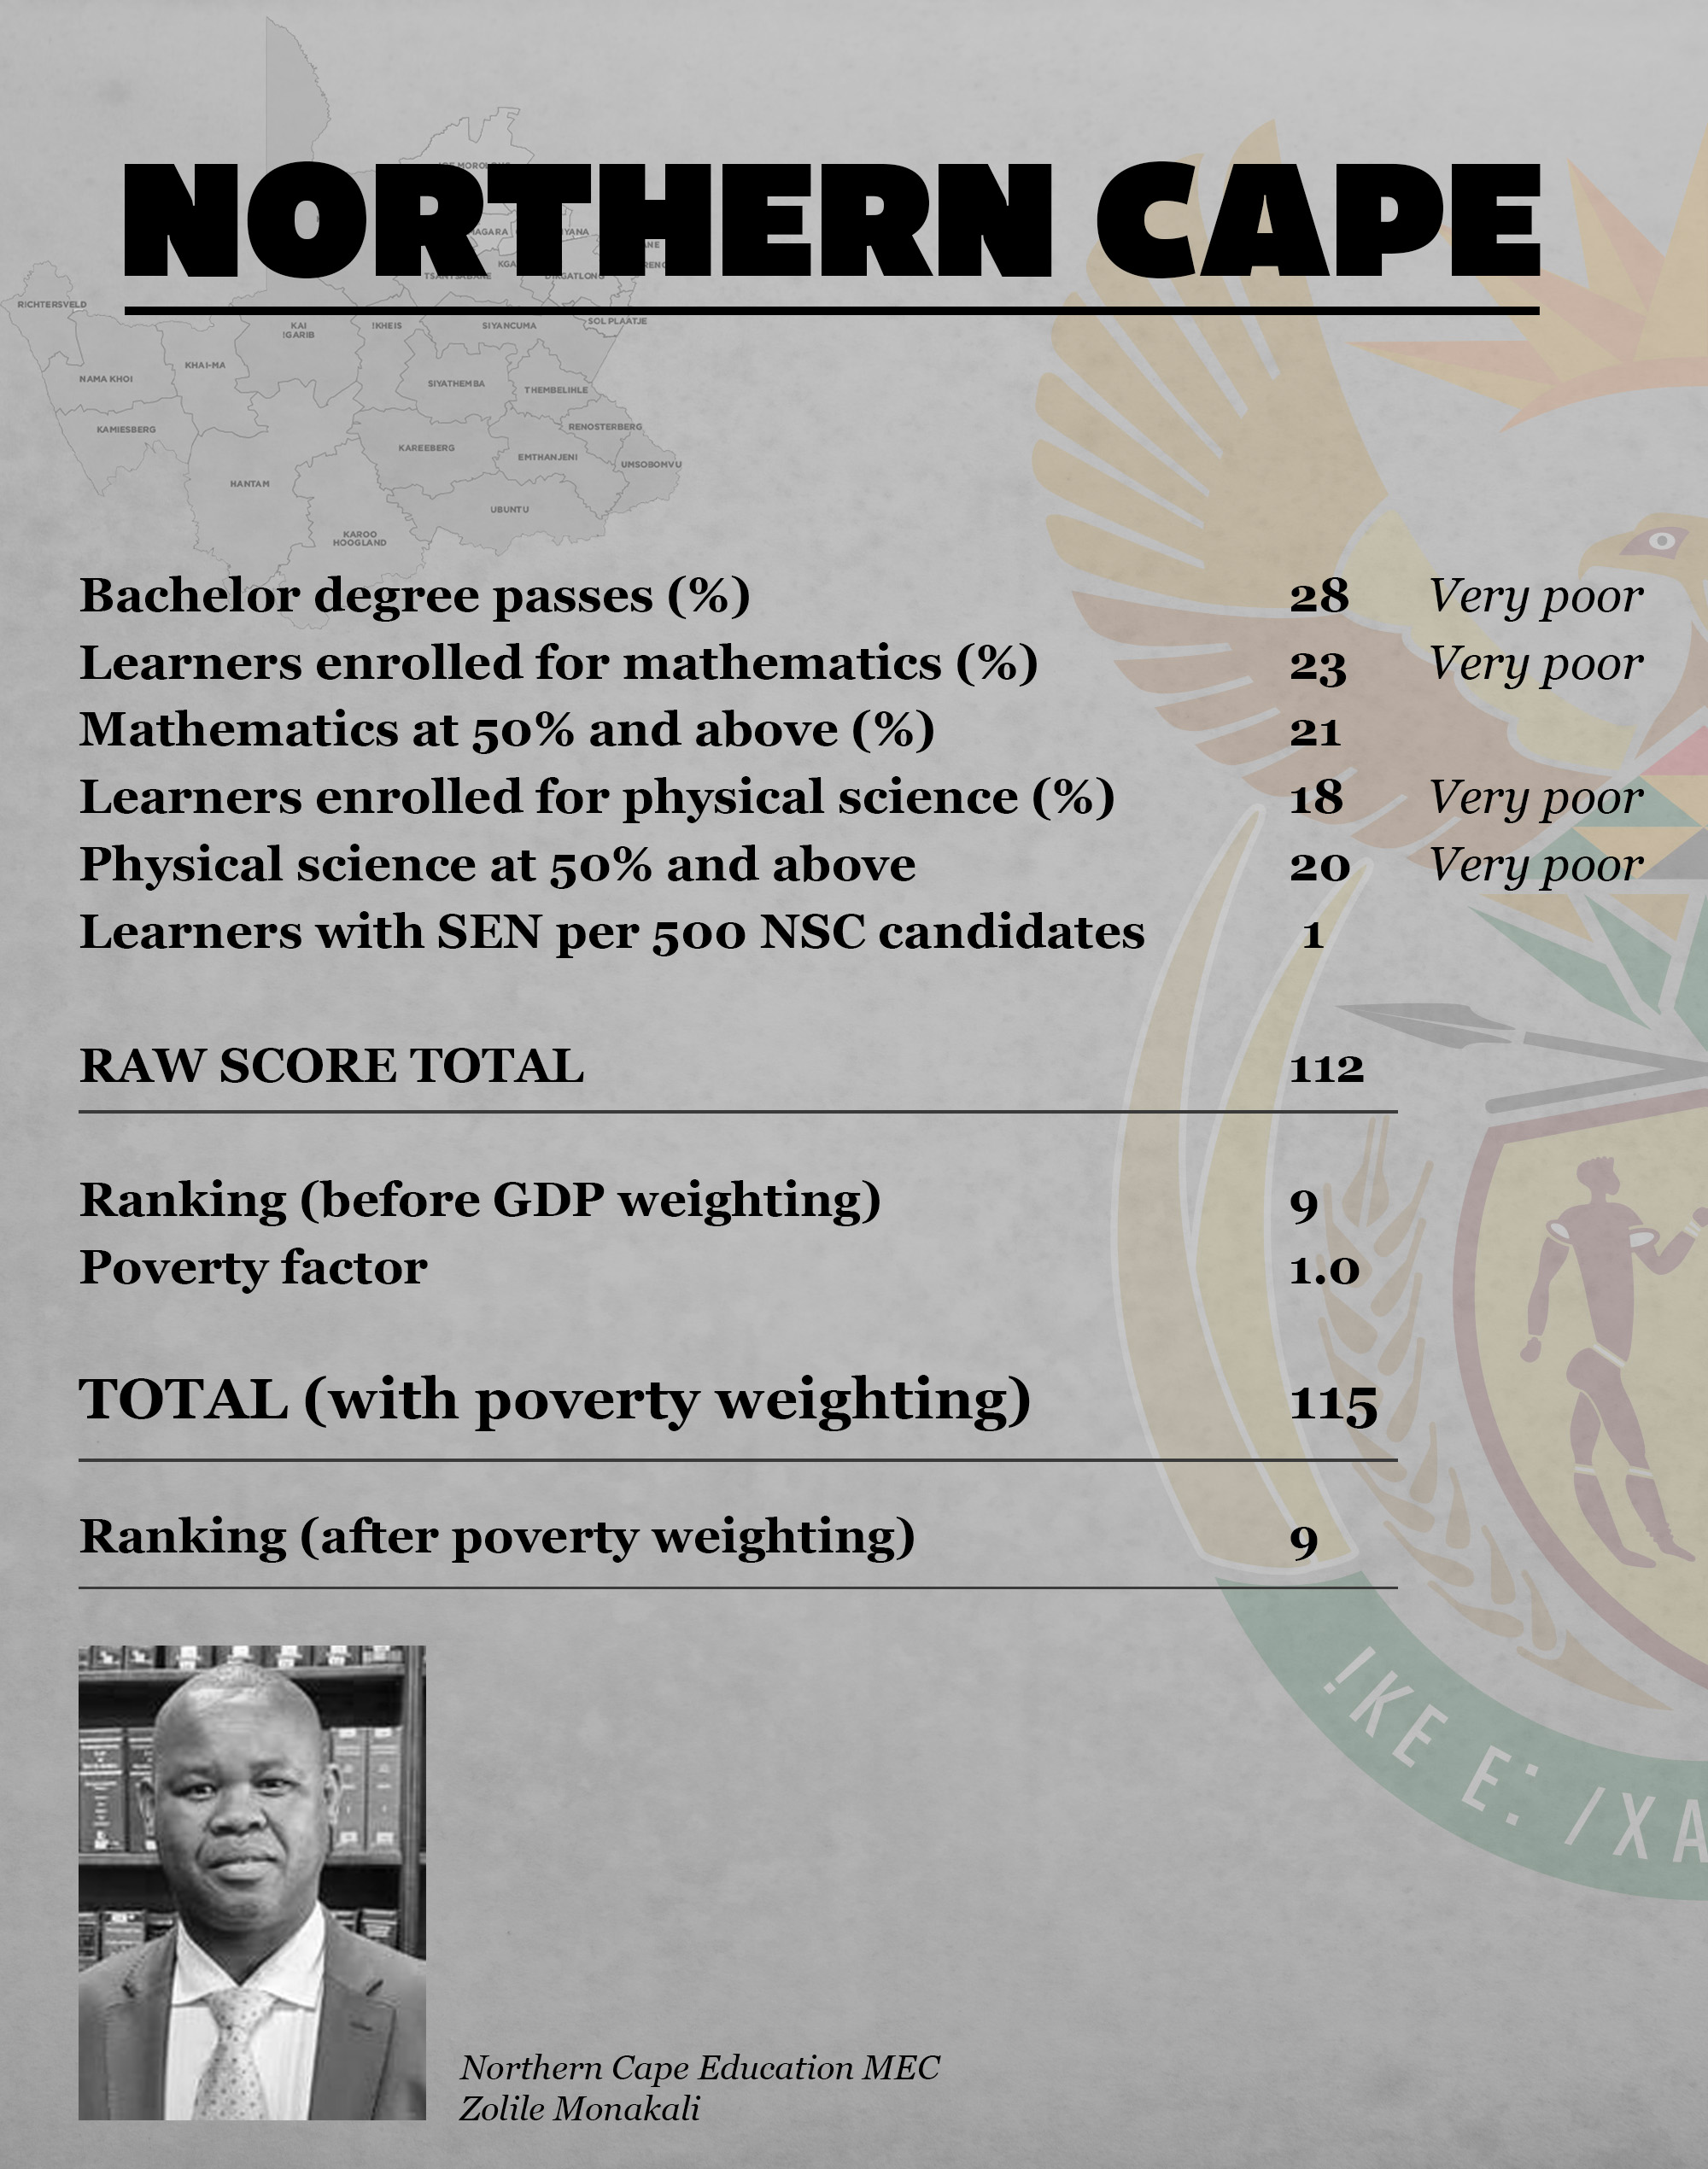
Comments:
Northern Cape, I expect to see you performing at the level of Free State and Mpumalanga (all with a poverty factor of about 1). But this seems to have been a dreadful year for you.
What is going wrong? Is it the distances? Is it the heat? What’s happening?
Quality of passes are poor all round. But I am especially concerned with your physical science – both enrolment and quality passes are very poor.
Let’s hope that your report improves when I consider the proportion of bachelor’s passes from no-fee schools. Perhaps you are making progress on redress?
Conclusion:
I know that this reporting is flawed.
Hopefully these provincial reports will help to direct attention to some important quality indicators. I thought if we are going to keep having provincial competition, let’s at least take into account SES, and consider the added value that provinces are offering. Here is a summary for the Class of 2020:
I think the best way of comparing provinces is actually over a period of time, which is against their own benchmarks. 2020 was a tough year. Thanks to all who helped keep learning open.
But our Class of 2020 was in fact quite protected from the impact of Covid-19. The NSC exam measures two years of learning. The Class of 2020 was taught as normal in 2019.
So it’s the Class of 2021 I worry about. They missed school, had a trimmed curriculum and did not write exams. And of course, our Grade 2s and 3s have missed out on learning to read and lost confidence with numbers.
To reflect on redress, I wanted to consider the ratio of NSC passes at certificate, diploma and bachelor’s degree level from no-fee schools to fee-paying schools. Unfortunately redress data (at provincial level) was not provided by the DBE in their technical report.
I am very pleased to see the DBE reports that:
- “249,162 candidates from ‘no-fee’ schools obtained an NSC compared to 141,433 from ‘fee-paying’ schools” (DBE, 2021, p.90); and
- “216,075 of the 387,717 ‘no-fee’ learners have access to a higher education study, with 115,444 having attained admission to bachelor studies and 100,631 having attained admission to diploma studies.” (DBE, 2021, p.8)
At a national level, for every five bachelor’s passes from “fee-paying” public schools, there were seven bachelor’s passes from “no-fee” public schools. This is an improvement on 2019, where the ratio of bachelor’s passes from “fee-paying” schools to bachelor’s passes from “no-fee” schools was 5:6. This shows that our outcomes are improving, and our inequality narrowing.
But I fear that the impact of Covid-19 and our rising poverty is yet to be evident in our school results.
We must urgently address food security and nutrition – we cannot expect stunted children to get bachelor’s passes in 10 to 15 years’ time.
A basic income grant must now urgently become a reality.
We must release spectrum and prioritise ICT investments into rural communities, with public primary schools as our connectivity hubs. We need zero-rates data for health and education.
Without aggressive pro-poor policies, we will not maintain this improvement trajectory and we will lose ground in reducing inequality. DM
Nicky Roberts is an Associate Professor in maths education in the department of Childhood Education, University of Johannesburg, Soweto campus. She has a PhD in mathematics education (Wits), and a master’s in international perspectives in mathematics education (Cambridge). She writes in her personal capacity.