


 South Africa and the global recovery are set to remain in uncharted territory for some time to come. (Image: Adobestock)
 High-frequency economic indicators are confirming that the V-shaped recoveries that have manifested in many economies emerging from lockdowns may be losing momentum as we head towards the fourth quarter.
Given the nature of the Covid-19 pandemic, where certain economic activities have been much harder hit than others, the recovery is understandably proving patchy across sectors, but conditions are changing quickly. For that reason, analysts have widened their scope of indicators to a broad range of alternative, high-frequency data that gives them a more immediate picture of where economies are showing signs of life and where they are not.
Conventional economic data tends to show what happened a few months ago, which is not as helpful as indicators that capture what is happening in the here and now. Manufacturing, mining, and electricity data released recently, for instance, only showed what happened in July. Retail sales and wholesale sales for July are due for release this week. Next week, tourism accommodation figures for July should be available. Then, the August credit and money supply data, which are vital indicators, will only be published at the end of the month.
For more recent data that indicates how the economy is faring, Sanlam Investments economist Arthur Kamp says his go-to statistics are the Purchasing Managers’ Index (PMI) series, which gives him an early indication of economic trends; car sales, also a popular leading indicator; air passenger numbers, useful in a Covid-19 context, and, less well known, the BankservAfrica Economic Transactions Index.
The PMI output index recorded a strong bounce from May through to August. So too did the ratio of PMI new orders to inventory, Kamp says. Car sales were positive month-on-month in August but remained well below their pre-pandemic level, he points out. The number of domestic air passengers increased from zero in May 2020 to 372,813 in August 2020. But, he notes, this remains a long way off from the 2.5 million recorded in August last year.
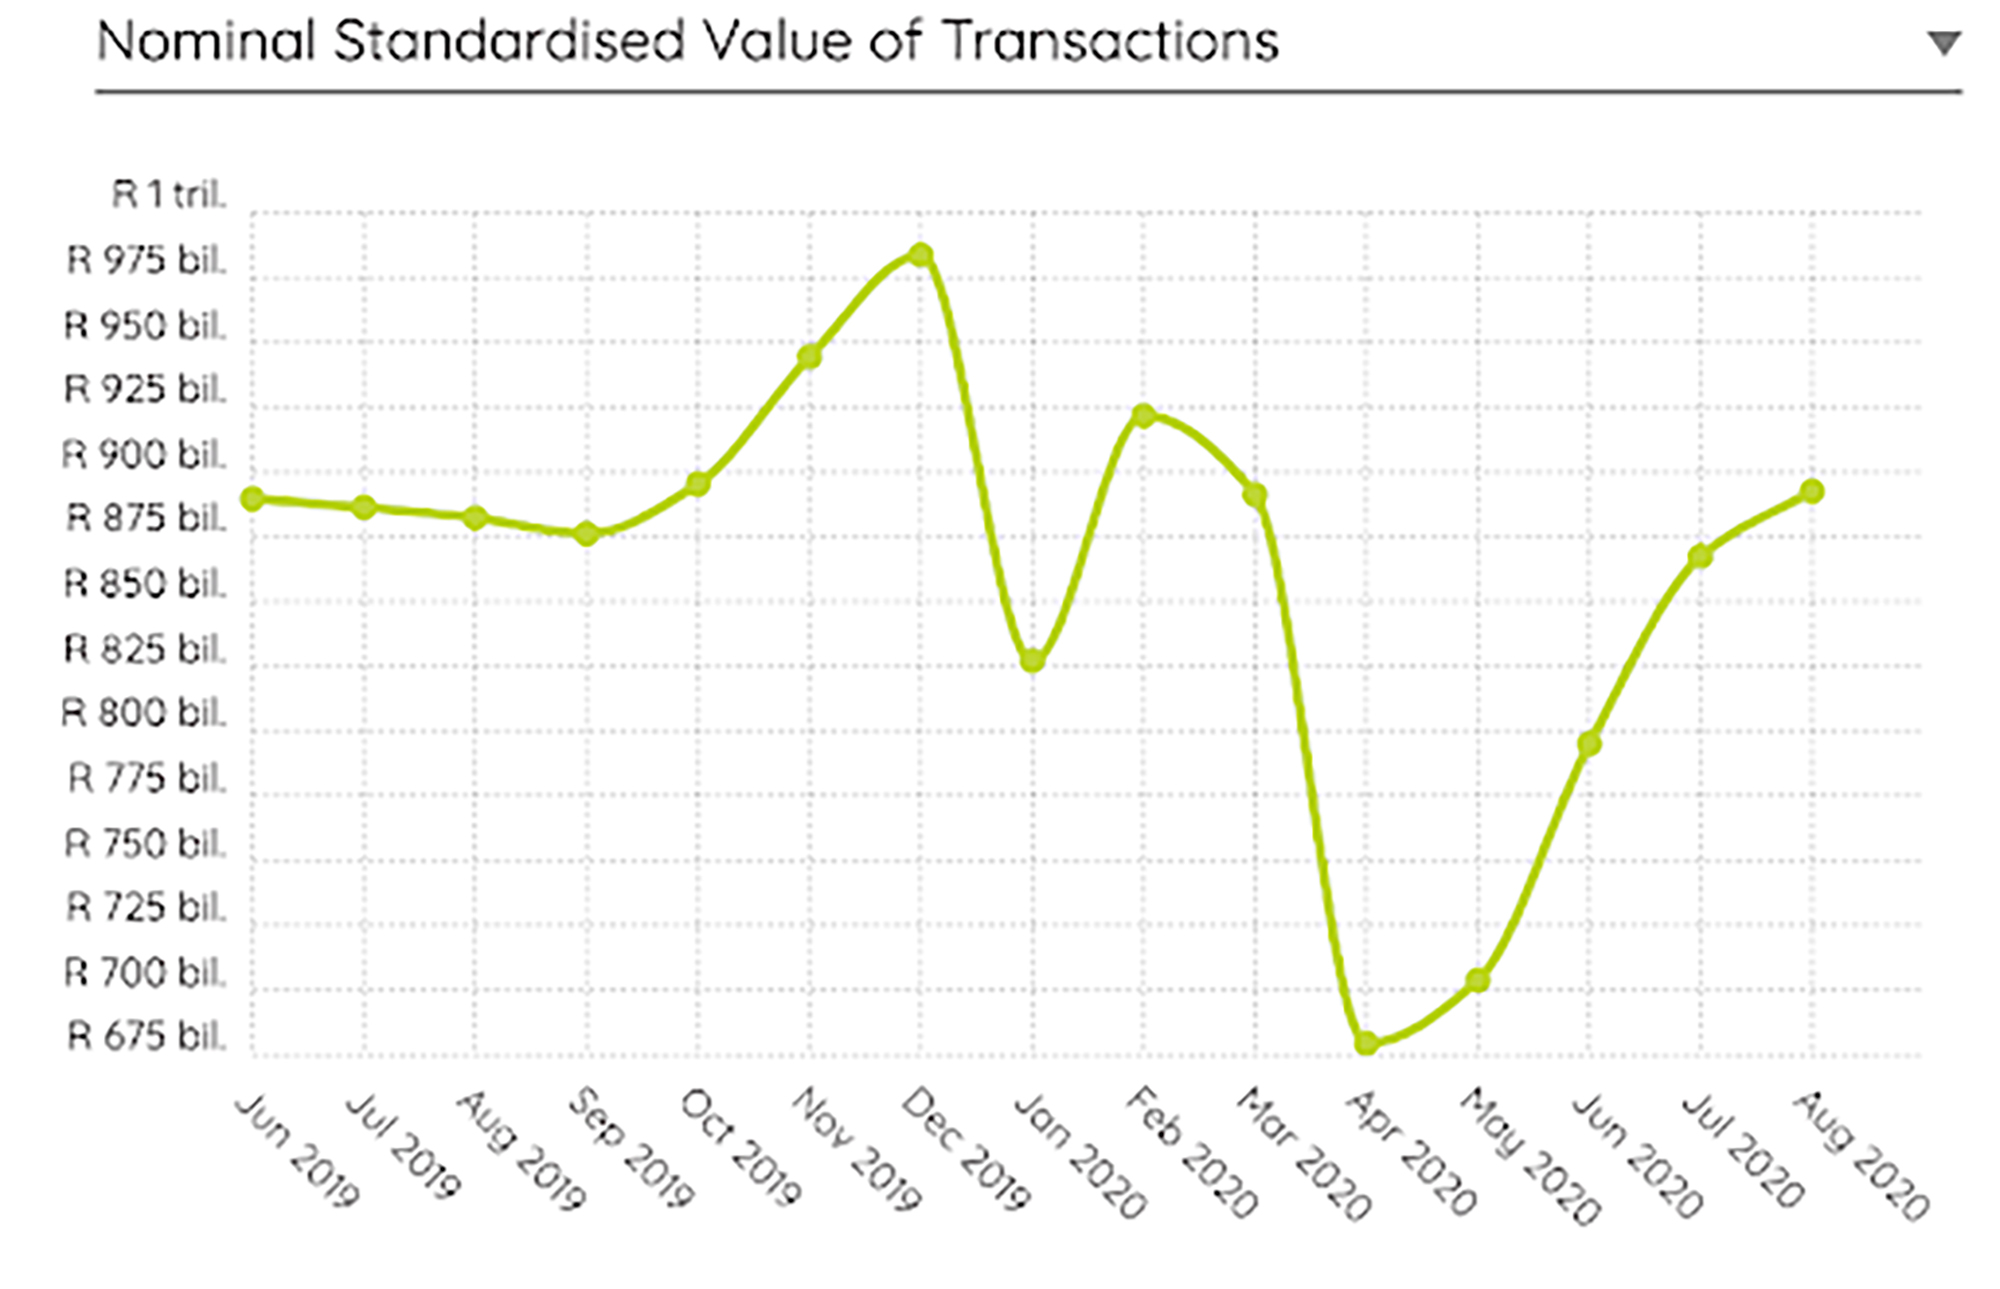
The BankservAfrica Economic Transactions Index reflects transactions that have been processed through the national payments system. Kamp says that since May the index has shown solid increases in transactions, rallying from its April low, when the value of transactions bottomed at R679.4-billion. It has since increased to almost R900-billion in August. (Graph1)
For even more up-to-date data, Kamp uses Google Community Mobility Maps. He notes that the data is just a few days old and gives a reasonable idea of what is happening in September. It tracks retail and entertainment, pharmaceutical and groceries, workplaces, transport hubs, parks and residential.
“Generally, the data points to a strong bounce, notably in retail, including groceries and pharmaceutical, beginning in May, although momentum has slowed following the initial gains.”
Overall, he says, the data points to a strong bounce in the third quarter after the second-quarter collapse. But activity and income levels are likely to remain below their pre-pandemic levels for an extended period. One key sector that is still lagging behind the broader economic rebound is tourism and accommodation.
Investec economist Annabel Bishop agrees that the SA economy is “showing a few green shoots”. Recently released mining and manufacturing data already herald recovery off the lows reached in the second quarter; however, year-on-year increases are still “materially weakened”. For the first two months of the third quarter, she notes, South Africa’s PMI has been well above 50, signifying neutral levels of economic activity.
Looking ahead, BNP Paribas economist Jeff Schultz has a particularly sombre view of South Africa’s economic outlook, saying it is more pessimistic than the consensus on both the extent of the economic downturn and the pace of recovery.
He hasn’t changed his growth forecast, expecting an 8.5% GDP contraction in 2020, followed by a modest 2.5% increase in 2021. Schultz doesn’t expect GDP to return to pre-crisis levels until 2024, attributing the long road to recovery on “weak ‘animal spirits’ (keeping fixed investment weak for longer), unstable electricity supply and a large knock to an already fragile labour market”.
Looking further afield, global indicators are signalling V-shaped recoveries in several respects. Still, momentum seems to be slowing after the bounce-back from the tremendous lows reached during second-quarter pandemic lockdowns.
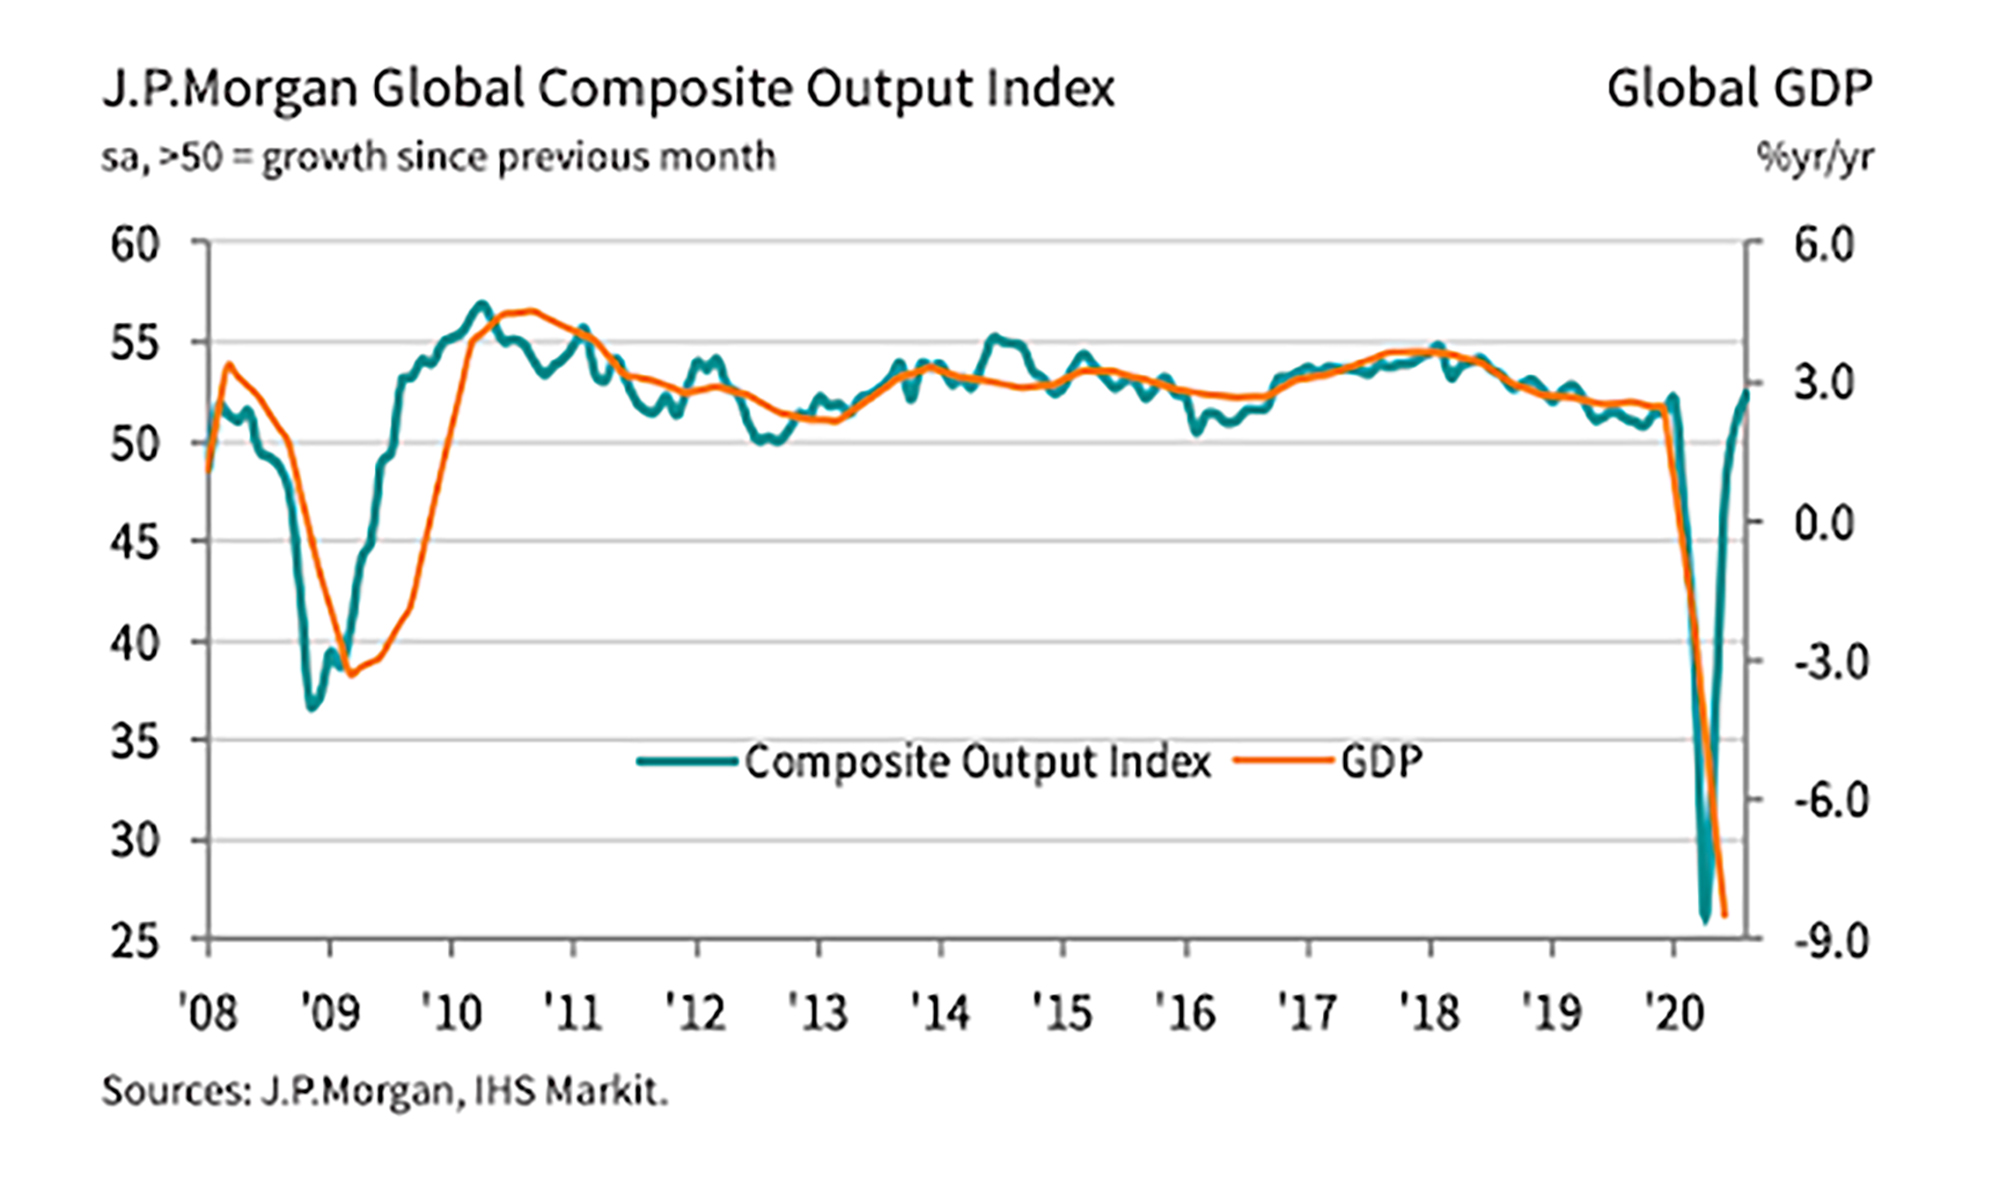
For instance, the JP Morgan Composite Output Index shows a distinctly V-shaped recovery to pre-pandemic levels of just above 50. In August, the all-industry output sub-indices rose in the US, mainland China, the eurozone, the UK, Brazil and Russia. So much so that growth in the US had reached a 17-month high, China a two-month high and the UK a six-year high. The eurozone, by contrast, saw output rise at a slower pace after reaching a 25-month high in July, while Japan contracted. (Graph2)
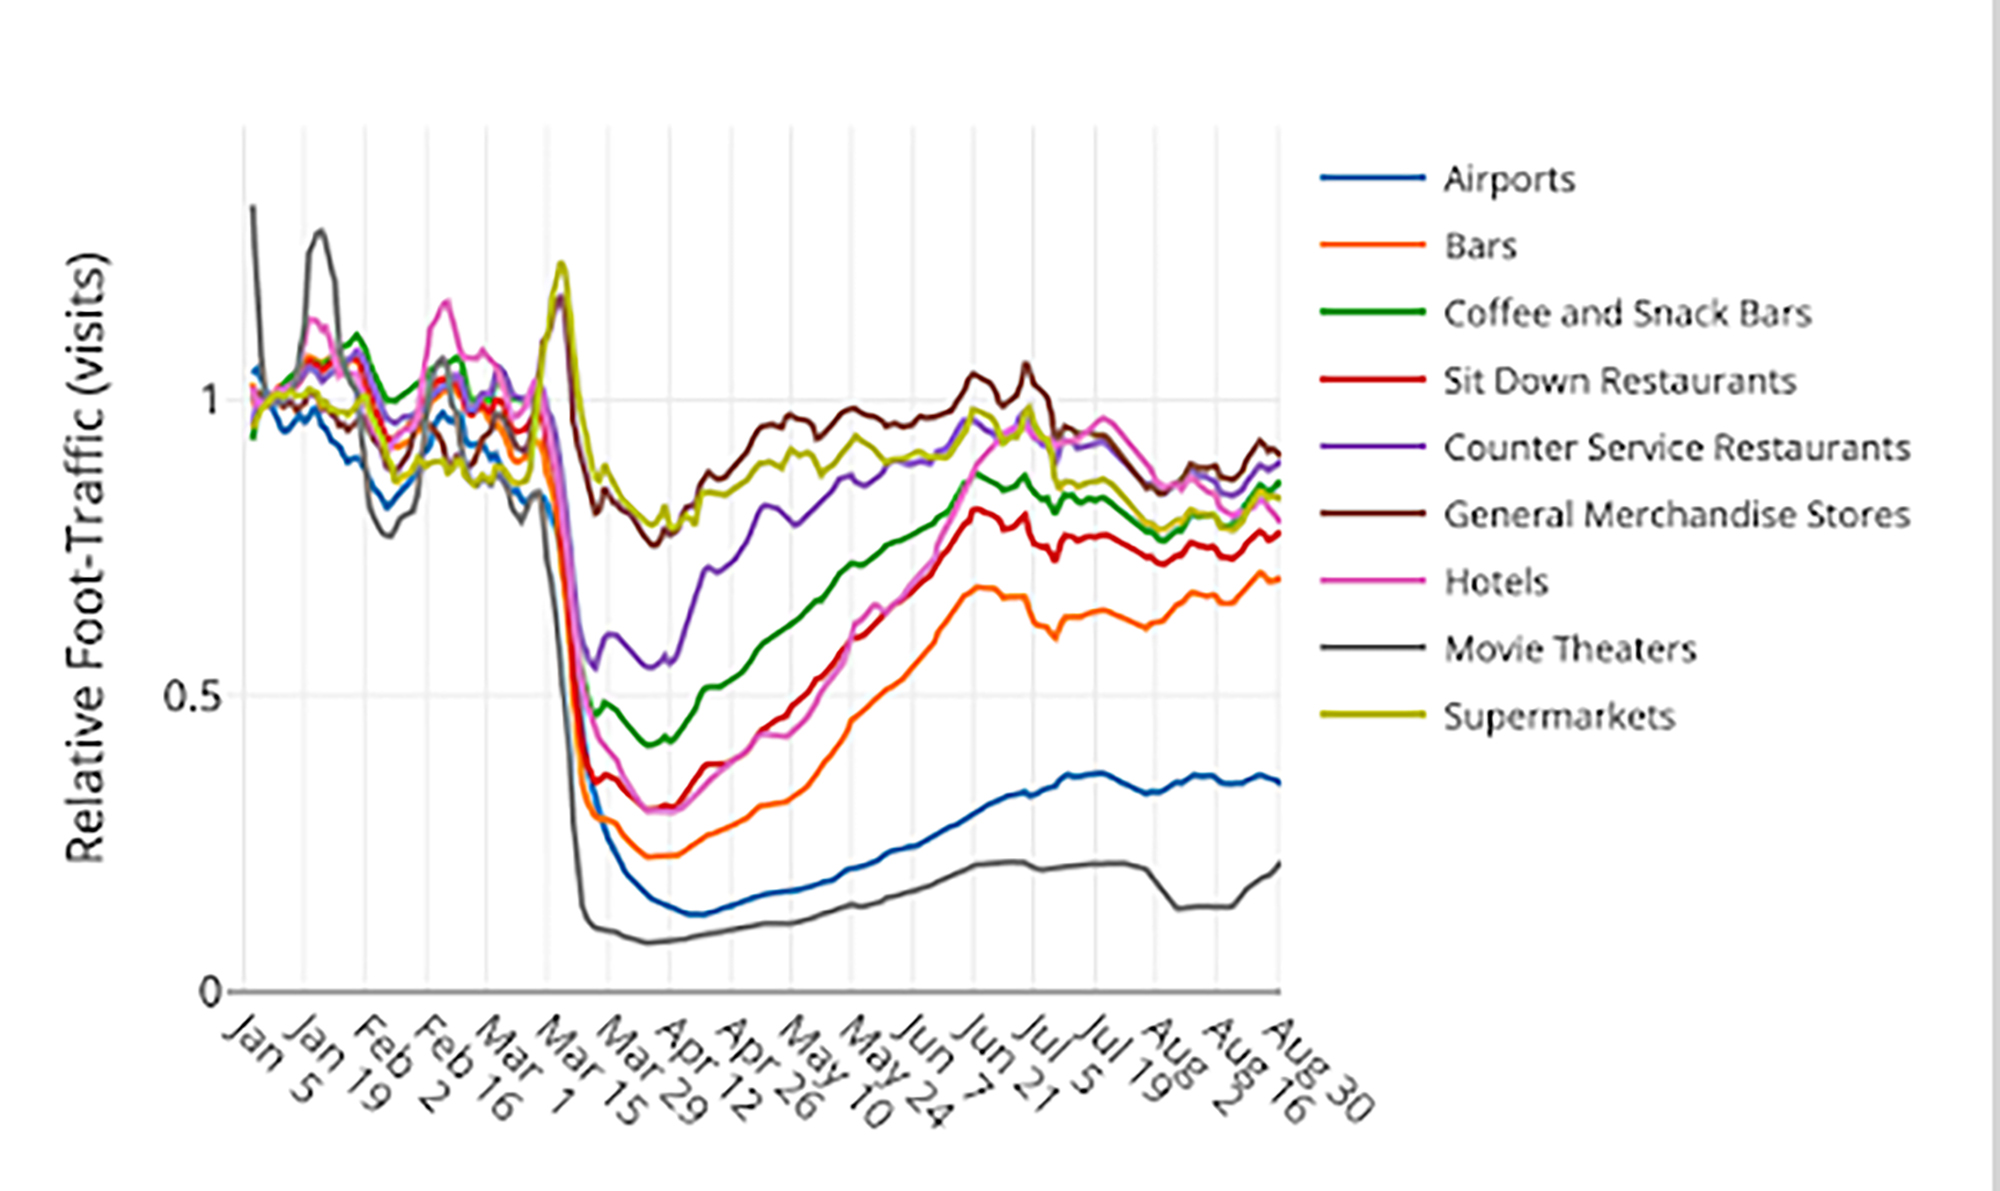
However, other less conventional data, namely mobility data, shows that momentum may be slowing in the US and Europe. Safegraph captures foot traffic to businesses and consumer points of interest, as shown in the graph below. It is evident that after an initial bounce, the levels of activity had flattened or retreated somewhat by the end of August. (Graph3)
Meanwhile, in Europe, JP Morgan produced the graph below, drawing on Google mobility data. It shows a similar pattern, flattening out after recovering gradually from the April low. Both remain below their pre-pandemic levels. (Graph4)
 BNP Paribas macro quantitative strategist Kris Gjini sees alternative, high-frequency data as providing “more timely and granular data, allowing us to gain quicker insight into the economic recovery”. As such, the bank monitors the four core alternative indicators reflected in the table below and finds that, overall, alternative data confirms a slowdown in the economic recovery.
Gjini notes that mobility has plateaued in many countries.
“After a return to modest levels (20-30% below baseline), most countries have seen mobility at transit stations plateau or fall.”
By contrast, public concern around the pandemic, which feeds into spending and investment decisions, has moderated.
“The figure has fallen to below 5% (seven-day average) for many countries, suggesting that despite isolated outbreaks and a rising risk of second waves in several countries, the public appears unfazed overall. At the peak of the crisis, many countries saw concern scores of more than 80%.”
Consumer confidence surveys outside China have also plateaued. However, electricity demand, which signals supply-side activity, has continued to rise in most countries, according to Gjini.
Another high-frequency indicator, the Oxford US Economics Recovery Index, which is updated weekly, suggests a swoosh-shaped recovery is underway, with the combined index plateauing in response to the resurgence of the virus in many countries and concerns that winter will see a further rise in infections. (Graph5)
/file/dailymaverick/wp-content/uploads/BM-Sharon-oped-economicMo-Graph5.jpg "Google data suggest economic momentum lacking")
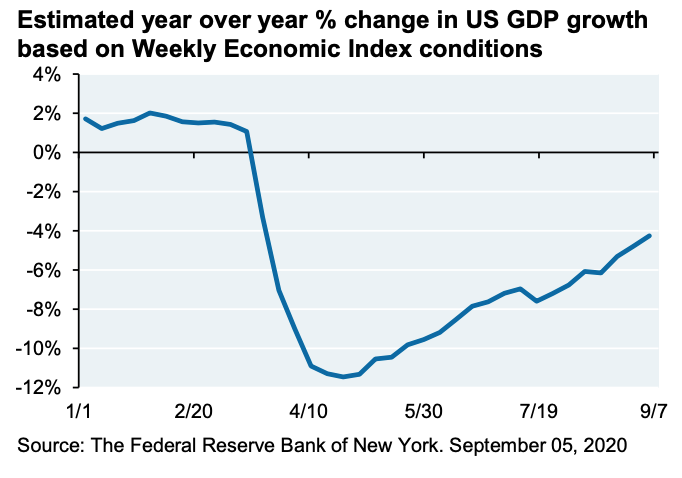
Yet another high-frequency indicator, created by the Federal Reserve Bank of New York, the Weekly Economic Indicator (WEI), also shows a slowdown in the pace of the economic recovery. The WEI represents 10 different daily and weekly series representing consumer behaviour, the labour market, and production. It came in at -4% in the first week of September, well off its -12% nadir in April, but if maintained means that fourth-quarter growth will contract by 4%. The WEI is scaled to the four-quarter GDP growth rate, and if the current level of the indicator is maintained for the quarter, GDP growth could be expected to come in at that level. (Graph6)
 BNP Paribas, for one, expects the rebound to slow sharply and has factored this into its economic forecasts, as reflected in the graph below. (Graph7)
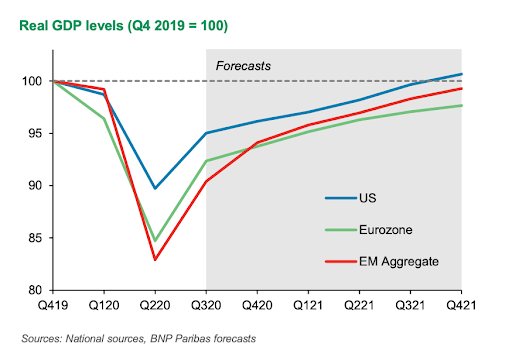
Luigi Speranza, BNP Paribas chief global economist, says: “While the economic recovery from the second quarter’s slump in activity is likely to continue, we expect it to slow sharply over the next few months.” He attributes this slowdown in pace to a number of factors including fading fiscal support, a possible second wave of Covid-19 contagion during winter, continued uncertainty weighing on consumption and investment, high unemployment “for a long time”, and geopolitical uncertainty.
The consistent upside surprises of the past few weeks are unlikely to continue, he says and expects economic data to become more mixed as we move into the fourth quarter. Speranza says this will act as a reminder that the lingering impact of the crisis will be felt for many quarters to come.
If these conventional and more colourful indicators show one thing, it’s that South Africa and the global recovery are set to remain in uncharted territory for some time to come. The dazzling array of high-frequency indicators, with only a handful featured here, do offer early indications of what’s happening in the economy. More conventional, lagging data will be particularly useful when we look back for lessons that could help us navigate future crises. DM/BM