


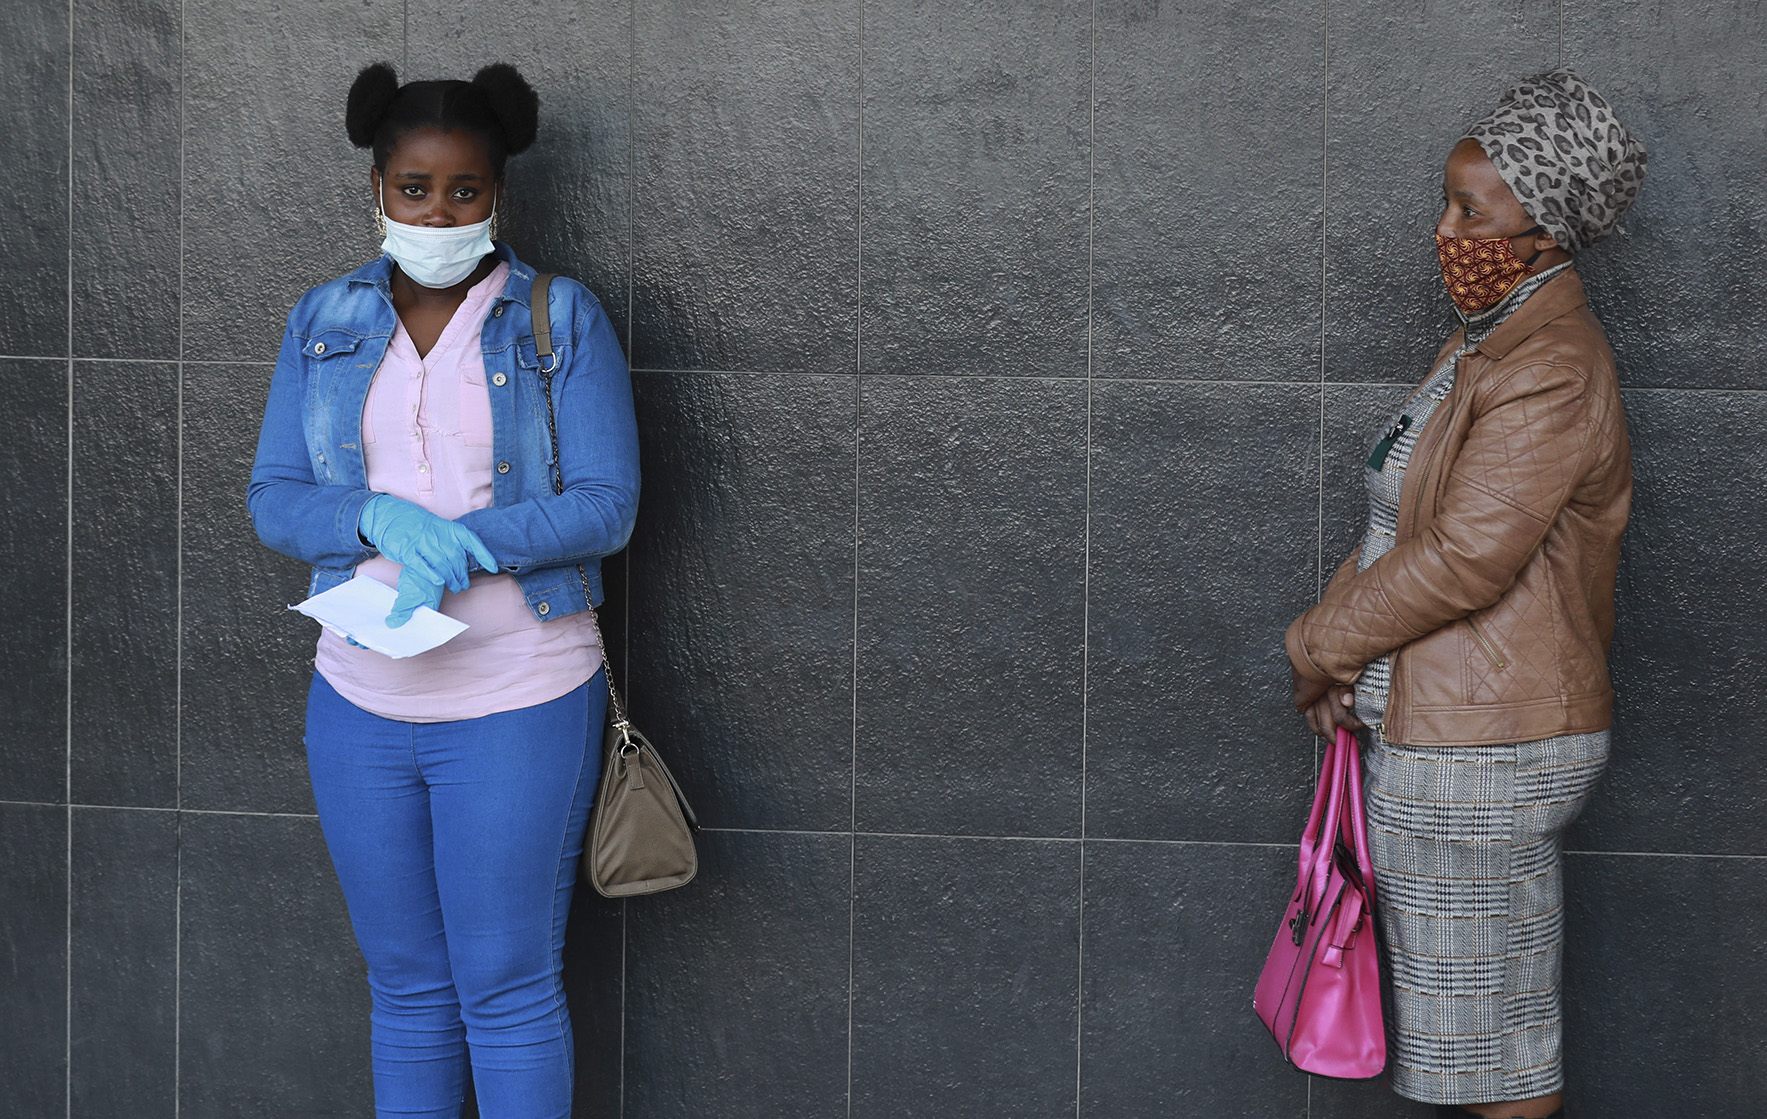
 CAPE TOWN, SOUTH AFRICA - MAY 04: People queue at the Department of Labour to claim money from the unemployment insurance fund on May 04, 2020 in Cape Town, South Africa. The government began a phased easing of its strict lockdown measures in a bid to cut down on the spread coronavirus. (Photo: Nardus Engelbrecht/Gallo Images via Getty Images)
Working Paper Series
NIDS-CRAM Wave 1
- Spaull et al. NIDS-CRAM Wave 1 Synthesis Report: Overview and Findings.
- Burger, R., Christian, C., Maughan-Brown, B., Rensburg, R & Rossouw, L. (2020) COVID-19 risk perception knowledge and behaviour.
- Burger, R., Nkonki, L., Smith, A., Rensburg, R., & van Schalkwyk, C. (2020) Measuring the public health cost of COVID-19 control efforts.
- Casale, D. & Posel, D. (2020) Gender & the early effects of the COVID-19 crisis in the paid & unpaid economies in South Africa.
- Jain, R., Budlender, J., Zizzamia, R., & Bassier, I. (2020) The labour market and poverty impacts of COVID-19 in South Africa.
- Köhler, T. & Bhorat, H. (2020) COVID-19, social protection, and the labour market in South Africa: Are social grants being targeted at the most vulnerable?
- Nwosu, C. & Oyenubi, A (2020) Estimating income-related health inequalities associated with COVID-19 in South Africa.
- Posel, D. & Casale, D. (2020) Who moves during times of crisis? Mobility, living arrangements and COVID-19 in South Africa.
- Ranchhod, V. & Daniels, R. C (2020) Labour market dynamics in the time of COVID-19.
- Rogan, M. & Skinner, C. (2020) ‘The COVID-19 crisis and the South African informal economy: ‘Locked out’ of livelihoods and employment’.
- Van der Berg, S., Zuze, L., & Bridgman, G. (2020) Coronavirus, Lockdown and Children: Some impacts of the current crisis in child welfare using data from NIDS-CRAM Wave 1.
- Wills, G., Patel, L., Van der Berg, S., & Mpeta, B. (2020) Household resource flows and food poverty during South Africa’s lockdown: Short-term policy implications for three channels of social protection.
All papers are available for download at https://cramsurvey.org/reports/
The NIDS-CRAM data is freely available for download at the Data First Open Data Portal: https://www. datafirst.uct.ac.za/
1. Foreword & Introduction
The coronavirus pandemic is the largest social and economic shock in our lifetime. The rapid spread of this virus around the world and the economic devastation it has left in its wake is unlike anything we have seen before, at least not in our lifetimes. The local and international landscape is constantly morphing and changing in unpredictable ways making policy formulation and implementation as hard as it can possibly be. Policies that are helpful and sensible today may be harmful and illogical tomorrow. Every month seems to yield new information and consequences that were unforeseen even six weeks before. Indeed, “There are decades where nothing happens, and there are weeks where decades happen” (Lenin).
It is within this context that we have convened a national consortium of 30 social science researchers from five South African universities to conduct the National Income Dynamics Study (NIDS) Coronavirus Rapid Mobile Survey (CRAM) over the course of May – December 2020. Because decision-making is only as good as the data on which it is based, the NIDS-CRAM project exists to collect, analyze and disseminate data on a broadly representative sample of South African individuals, and to report on their employment and welfare in light of the COVID-19 pandemic.
Given that all in-person data-collection activities have ceased, the decision was made to conduct a telephonic follow-up survey of a pre-existing nationally representative household panel survey; the National Income Dynamics Study (NIDS*). With the permission of the South African Presidency and after ethical clearance**, the NIDS-CRAM research team was granted access to the sampling frame and telephone numbers of all individuals surveyed in NIDS 2017. The first wave of NIDS-CRAM ran from the 7th of May to the 27th of June and used 50 call-center agents to survey a representative sub-sample of 7,000 respondents from NIDS 2017. Among many other topics, the 20-minute survey asked respondents about their current and retrospective employment, household hunger, receipt of grants, COVID-19 risk perceptions, knowledge and behavior, among many other questions. This synthesis report presents the key findings from the 11 papers summarized into three main sections: employment, hunger, and health.
* That study ran between 2008 and 2017 with a nationally representative sample of over 28,000 individuals in 7,300 households across the country following the same household members over time and reporting on their livelihoods and wellbeing. The latest round of in-person data collection (Wave 5) was conducted in 2017 (SALDRU, 2018). The current follow-up telephonic survey (NIDS-CRAM) was available in 10 official languages.
**Ethical clearance. was granted by both the. University of Cape Town (REC20202/04/017) and the University of Stellenbosch (REC15433).
During the course of 2020 there will be at least four further waves of data collection following the same individuals (a panel study). In that way the NIDS-CRAM study can be seen as a type of ‘barometer’, assessing how firms and families are being affected by the lockdown, the pandemic and the recession, but also reporting on the reach and efficacy of government’s social and economic relief efforts in the coming months. For further information on the conduct of the study please see Section 5 of this report as well as the following three technical documents: (1) the questionnaire (Spaull et al., 2020), (2) the Sampling and Weighting Report (Kerr, Ardington & Burger, 2020) and (3) the Panel User Manual (Ingle, Brophy and Daniels, 2020). The NIDS-CRAM Wave 1 data is freely available for download and use on the Data First Open Data Portal (NIDS-CRAM, 2020).
The Wave 1 employment questions ask respondents about the period February to April 2020, while many of the welfare questions (such as the presence and extent of hunger) reflect on the month of April as well as the ‘last seven days’. The month of April was an especially hard time in South Africa as the country was experiencing its most severe form of lockdown. Many South Africans income and employment was severely affected, and government relief efforts began in earnest in May (with the top up to existing government grants) and in June (with the progressive roll-out of the Special COVID-19 Social Relief of Distress Grant. We believe that the results of the NIDS-CRAM Wave 1 study included here are a helpful baseline from which to compare changes over time, and hopefully shed light on who is being affected, how they are being affected, and how might government and civil society respond to this unfolding crisis.
The aim of this synthesis report is to present an overview of the high-level findings from the NIDS- CRAM Working Paper Series which is made up of 11 papers. All of these papers use the NIDS- CRAM Wave 1 data as their primary source and report on various aspects related to employment, poverty, hunger, grants, migration and adherence to COVID-19 prevention strategies. All papers have undergone peer-review. The papers and the data on which they are based are all freely available for anyone to download and use.
Interpreting the results included in this synthesis report
Reviewing the findings presented in the 11 papers reveals that there is a high degree of agreement between researchers on what the key findings are; that employment has declined substantially and that the effects of this are largest for the most disadvantaged. Inequalities along traditional lines of race, gender, occupation, earnings, location and education, have all grown significantly. An already unequal national situation has been made much worse as a result of the COVID-19 pandemic and the local and international responses to it.
Where there are differences among authors in how these results should be interpreted, or what appropriate policy responses might be, we have made that clear. There are limitations to what one can say with this data, limitations we readily and freely acknowledge. We are not trying to preach certainty where there is none. What we have written here is not the first or the last word on the issues of employment or hunger, or even on the NIDS-CRAM dataset itself. We invite others to read, comment, critique and re-analyze the data. All the data and our do-files are freely and publicly available on https://cramsurvey.org/reports/ allowing others to replicate the results we report here.
Larger and more representative datasets on employment (such as StatsSA’s Quarterly Labour Force Survey) and other important issues will, in time, become available. Yet for now, this is the best available data we have on employment and welfare in South Africa. While there are health warnings around extrapolation and the level of representivity of the data, foregrounded no less by the researchers themselves, we can say with some confidence that this is the most representative survey of South African individuals and households in 2020 that currently exists. Furthermore, the true value of the NIDS-CRAM data lies in the fact that it is a panel survey and follows the same individuals over this turbulent time. Recognising who is entering and leaving employment and what this means for their household’s livelihood is a critical issue that can only be answered with panel data. Similarly, identifying who is receiving new and existing grants, and what that receipt means for their welfare, is information government needs in order to see how its policies are being taken up on the ground, and what that take up means for firms and families.
I would like to thank the funders of NIDS-CRAM study for moving so quickly and decisively; the Allan and Gill Gray Philanthropy, the FEM Education Foundation and the Michael & Susan Dell Foundation, as well as the Steering Committee for their strategic guidance and oversight; Anthony Farr, Haroon Bhorat, Ingrid Woolard, Leila Patel, Michael Sachs, Murray Leibbrandt, Ndivhuwo Manyonga, Servaas van der Berg and Thabo Mabogoane.
Lastly, I am incredibly proud of this team of some 30 researchers and what we have collectively managed to achieve in such a short time. In the space of just three months we have produced a broadly representative panel survey of South Africa, a public good whose value will only grow over the coming months. The levels of cooperation, collegiality and good will between these researchers, even in these difficult times, has been a source of encouragement for all of us.
On behalf of all of the researchers in the NIDS-CRAM consortium I would also like to personally thank Reza Daniels, Tim Brophy and Kim Ingle whose tireless and meticulous work in managing the data collection has been nothing short of heroic. Without them this data would not exist.
Nic Spaull
Principal Investigator
2. Employment
An overview of results from NIDS-CRAM Wave 1 2020
Caution in generalizing NIDS-CRAM 2020 results to the population: The NIDS-CRAM 2020 data is sampled such that it is representative of NIDS 2017. It is important to note that NIDS 2017 had a higher employment rate to start with (55%) compared to StatsSA’s QLFS 2017 (48%) (Ranchhod & Daniels, 2020). Therefore, the employment results reported in NIDS-CRAM should be seen relative to the NIDS employment data rather than the QLFS employment data. Furthermore, NIDS itself had been run four times since the first round in 2008, tracking the outcomes of the original 2008 respondents and their families. To the extent that the original NIDS sample had become less representative of South Africa over time, this would imply further uncertainty in the decline in employment between February and April 2020 estimated from NIDS-CRAM. There are also operational challenges in conducting telephone surveys and understanding how telephonic survey responses compare to in-person survey responses. These challenges will almost surely also be experienced by any other survey group attempting to collect similar data*. That being said, at present there is no comparable or alternative source of data that can be used to understand contemporary labour market dynamics in South Africa, and there is currently no information about when the StatsSA QLFS-2020-Q2 data will be released. Given that the QLFS sample will be considerably larger than the NIDS-CRAM sample, and more representative of the 2020 population, it will be a better source of information to obtain an overall profile of the South African labour market than NIDS-CRAM. That being said, NIDS-CRAM is currently the only ongoing panel study looking at labour-market dynamics over time in South Africa. Until the QLFS data are released we believe that the high-level trends evident in NIDS-CRAM 2020 are indicative of the underlying labour-market dynamics in South Africa in 2020, and that subsequent waves of NIDS-CRAM will reveal important labour market trends in South Africa.
*NIDS-CRAM was a short 20 minute telephone survey and so some relevant questions could not be asked. This means, for example, that it is not possible to estimate the change in the unemployment rate between February and April using NIDS-CRAM. One can only estimate the fraction of the sample who had a job.
NIDS-CRAM finds an 18% decline in employment between February and April 2020: The weighted NIDS-CRAM 2020 Wave 1 data identifies that 17-million people were employed in February 2020 but only 14 million people were employed in April 2020. This means that 3 million fewer people were employed in April compared to February, an 18% decline. The 95% confidence interval is that the decline in the number of people employed from February to April is between 2.5 and 3.6 million people.
Defining “employment” is difficult in the current time and labour market: Traditional definitions of employment do not account for the large presence of furloughed workers and temporary layoffs. As a result, different studies using the NIDS-CRAM data motivate for how to include different categories of workers (see Ranchhod & Daniels, 2020; Jain et al, 2020) but find broadly similar trends irrespective of how employment is calculated.
1 in 3 income earners in February did not earn an income in April: Using their definition of employment, Ranchhod & Daniels (2020) find that the proportion of adults who earned an income in February declined by 33% which is made up of a roughly equal share of those who lost their job and those who were furloughed. Jain et al (2020) report a 40% decline in ‘active employment’ also split equally between those who were laid off and those who were either furloughed or on paid leave.
Job losses were concentrated among the already disadvantaged: All authors find that job losses were disproportionately concentrated among the already disadvantaged groups in the labour market:
“Women, manual workers and those at the bottom half of the income distribution have suffered disproportionately higher rates of job loss”
-Jain et al., 2020.
“The over-arching finding from this analysis is that the job losses were not uniformly distributed amongst the different groups. In particular, groups who have always been more vulnerable – such as women, African/Blacks, youth, and less educated groups – have been disproportionately negatively affected”
-Ranchhod & Daniels, 2020.
“The adverse labour market effects of the pandemic and lockdown have been disproportionately borne by individuals in lower-income households”
-Köhler & Bhorat, 2020.
“In comparison to formal workers, those in the informal economy have been disproportionately impacted by the pandemic. A larger share of the informal economy (relative to formal employment) were locked out of employment during the month of April. Moreover, for the typical informal worker that was employed in both February and April the hours worked per week decreased by as much as 50%. Decreases in typical working hours were particularly large for women and workers in self-employment and for informal casual workers”
-Rogan & Skinner, 2020.
/file/dailymaverick/wp-content/uploads/Employment-Figure-1.jpg "Figure 1: The percentage of respondents experiencing net job loss or furlough (an employment relationship but no income) in the working age population: February to April 2020. Source: Jain, R., Budlender, J., Zizzamia, R., and Bassier, I. (2020) using NIDS-CRAM W1 data.")
Women face a double disadvantage: Of the approximately 3 million net job losses between February and April, women accounted for 2 million, or two thirds of the total, even though in February they only accounted for less than half of the workforce (47%) (Casale & Posel, 2020). Of those women who were employed in both February and April, almost half of them reported working fewer or no hours in April (compared to 42% of men). Among those groups of people that were already disadvantaged in the labour market, and already faced a disproportionate share of job losses from the pandemic (the less educated, the poor, Black Africans and informal workers), women in these groups faced even further job losses putting them at a ‘double disadvantage.’
Significant numbers of the newly unemployed are in households with no grants: Many of those who experience job losses are in grant-receiving households, for example a Child Support Grant or an Old Age Pension, but there are also a substantial portion of people who live in households where there is no grant income. Jain et al (2020) find that approximately 30% of those who were retrenched between February and April report no household-level grant protection at all.
NIDS-CRAM Wave 1 job losses reflect the ‘peak’ of lockdown and before the full roll-out of government relief efforts: The NIDS-CRAM Wave 1 data was collected in May and June 2020 asking retrospective questions about February and April employment. April was the ‘peak’ of the hard lockdown in South Africa. In addition, data collection occurred during the roll out of the government’s ‘Special COVID-19 Social Relief of Distress Grant’. The Wave 1 data should therefore be seen as a ‘baseline’ with which to compare subsequent waves. Put differently, much of the government relief that has subsequently been implemented had not been fully realized at the time of the survey. It was also before much of the economy re-opened in early June. The subsequent four waves of NIDS-CRAM (Wave 2-5) will continue to report on employment and grant receipt for these same individuals over the period June-December 2020. As a result, the panel nature of the NIDS- CRAM study will be able to assess the labour-market dynamics in the lockdown and post-lockdown period, as well as measure the household welfare impacts of new employment and receipt of the new government relief grants. The NIDS-CRAM data can therefore be seen as one barometer to measure changes over time during this turbulent time.
3. Hunger
An overview of results from NIDS-CRAM Wave 1 2020
Caution in interpreting the NIDS-CRAM 2020 results: In addition to the caution shared by the labour group in the preceding section around extrapolation and representivity, there is an additional note on interpretation for the welfare questions. That is that all responses should be interpreted relative to the period to which they refer. The question “In the month of April did your household run out of money to buy food?” reflects on the time period before the top up to government grants (which began in May). Yet questions related to hunger ‘in the last seven days’ refer to the months during which the data was collected (i.e. 7 May – 27 June) and thus households will have already been receiving the top-up grants, although most would not have received the Special COVID-19 Social Relief of Distress Grant. Therefore, the timeframe in question should be borne in mind when interpreting the welfare results. Like the labour group, we believe that the high-level trends evident in NIDS-CRAM 2020 data are indicative of the underlying welfare dynamics in South Africa in 2020, and that subsequent waves of NIDS-CRAM will reveal important inter-temporal trends in these areas.
47% of respondents reported that their household ran out of money to buy food in April 2020. Prior to the lockdown, 21% of households reported that they ran out of money to buy food in the previous year (GHS, 2018). The NIDS-CRAM Wave 1 data shows that 47% of the respondents reported that they had run out of money to buy food in a single month, April (i.e. during lockdown). Given that the second measure is a much stricter measure of food insecurity it seems quite clear that the incidence of running out of money to buy food has more than doubled.
1-in- 5 respondents reported that someone in their household went hungry in the last 7 days, and 1-in-7 reported that a child had gone hungry in the last 7 days: Respondents were asked “In the last 7 days has anyone gone hungry in this household because of lack of food?” and “In the last 7 days, has any child in your household gone hungry because there wasnt enough food?” as well as follow on questions about frequency if respondents answered yes. One in five respondents (21%) answered that someone had gone hungry in the last 7 days and in households with a child, 1-in-7 (15%) respondents reported that a child had gone hungry in the last 7 days.
1-in-8 respondents reported frequent hunger (3+ days in the last 7 days) in their household, and 1-in-14 reported perpetual hunger (almost every day or every day): 1-in-8 respondents (13%) reported that someone in their household had gone hungry for three or more days in the last 7 days. The most comparable pre-lockdown statistic comes from the GHS which showed that only 5% of households reported skipping meals for “5 days in the past 30 days” in 2018. By comparison, NIDS-CRAM Wave 1 shows that 7% of respondents (1-in-14) report that someone in the household went hungry ‘Almost every day’ or ‘Every day’ in the last 7 days. Using the NIDS-CRAM weights these respondents represent 2,2-million individual’s in South Africa.
In households with children, 1-in-13 respondents (8%) reported frequent child hunger (3+ days in the last 7 days) in their household, and 1-in-25 (4%) reported perpetual hunger (almost every day or every day): 1-in-8 respondents (13%) reported that someone in their household had gone hungry for three or more days in the last 7 days.
/file/dailymaverick/wp-content/uploads/Hunger-Figure-1.jpg "Figure 1: Reported hunger in the last seven days (asked separately for ‘anyone in the household’ and for ‘children (<18 years) (NIDS-CRAM Wave 1, weighted).")
Evidence of adults ‘shielding’ children from hunger: Reported hunger of some household members in NIDS-CRAM is much higher than child hunger, 22% against 15%, pointing to high adult hunger. In households that experienced hunger in the last seven days, 42% managed to ‘shield’ children from that hunger. That is, even though adults are reporting hunger, children are reported not to have gone hungry in the last 7 days. This ‘shielding’ ability declines with the extent of household hunger. Where adults experienced hunger for four days or less in the last 7 days, about half of respondents (47%) indicated that a child did not go hungry in the household (i.e. half of children were shielded). However, when there was perpetual adult hunger (hunger ‘Almost every day’ or ‘Every day’ in the last seven days) then adults appear less able to shield children, since only 33% of respondents indicated that a child did not go hungry. It is worth noting that adult and child hunger do not differ at all in the GHS 2018 data. It would seem that in times of acute crisis like the COVID-19 pandemic, many households have managed to protect or ‘shield’ the children in the household from that hunger. This protective capacity of households has its limits however; where hunger becomes too pervasive households seem unable to keep protecting children.
The Child Support Grant is well targeted to alleviate child hunger: Among those respondents who report a child going hungry in the household in the last 7 days, 84% said that there is at least one Child Support Grant (CSG) in the household. If one includes the presence of either a CSG or the Old Age Pension (OAP), this figure rises to 89%. Furthermore in households where the respondent indicated that someone had gone hungry (an adult or a child), 72% have either a CSG or OAP in the household, and 63% have at least a CSG in the household.
Pre-lockdown, three quarters of grant receiving households relied on income sources other than grants. There is often a misconception that poor, grant receiving households are ‘immune’ to income shocks because they get grants. Pandemic-induced job losses present a major threat to the livelihoods of a large proportion of grant receiving households precisely because earnings has been an important source of income for most grant-receiving households. The General Household Survey of 2018 shows that three quarters of grant receiving households reported that they received some income from employment, a business or remittances. It further shows that for 44% of grant- receiving households wages from employment or business income was the main source of income for the household. This can partly explain why hunger has been exacerbated despite grant income not changing, or even increasing.
4. Health
An overview of results from NIDS-CRAM Wave 1 2020
The need to draw on two datasets: NIDS-CRAM W1 and MATCH W1: One of the challenges when collecting data on health needs is that, at any one time, only a fraction of the population will need care. This inevitably leads to small sample sizes on which to base conclusions. We approach this in two ways: Firstly, the NIDS-CRAM study is currently the largest survey of South African households (n=7000) and therefore the inclusion of health questions has allowed us to identify unmet health needs as well as COVID-19 risk perceptions, knowledge and behavior. Secondly, we have supplemented our reporting on the NIDS-CRAM Wave 1 data by also reporting preliminary results from the Maternal and Child Health (MATCH 2020) study. The MATCH SMS-survey did not use NIDS as a sampling frame but rather the Department of Health’s MomConnect platform. NIDS- CRAM and MATCH are completely independent studies. The MomConnect platform has more than half of the women attending public sector antenatal care services in South Africa, making it the largest database focusing specifically on pregnant women and new mothers. We drew a sample of 15,000 new and prospective mothers stratified by province, gestational age or age of the child (in months), and their type of phone. We received 3140 responses (21% response rate). The Wave 1 survey that we report on here was conducted between 24 and 30 June. The survey covers access to antenatal care, vaccinations and ART.
We view our findings as providing supplementary evidence to address concerns about the unintended health effects of COVID-19 due to large observed drops in ART visits and TB tests. In particular, the analysis of reasons that prevented access to care or treatment, is often based on small subsamples, and we therefore focus on broad trends across the dimensions of care and treatment. In interpreting these results it would also be important to bear in mind that we were motivated to examine areas of care and treatment where interruptions would matter most. Estimates from high-stakes health services such as ART access for pregnant women may underestimate the broad, population-level unintended public health impact of COVID-19.
1-in-4 respondents (23%) reported they were unable to access medication, condoms or contraception in the past four weeks (NIDS-CRAM). Of the 7073 participants in NIDS-CRAM 23% reported that they were unable to access medicine, condoms or contraception in the past four weeks (all respondents were surveyed 7 May to 27 June). Among the nearly 1-in-5 respondents (18%) who had a chronic condition such as HIV, TB, a lung condition, a heart condition or diabetes, the reported inability to access medication, condoms and contraception is considerably higher. Of the 1524 respondents with a chronic condition, 705 (39%) reported that they could not access medicine, condoms or contraception. Given the survey length restrictions, it was not possible in Wave 1 to ask multiple questions which would allow for the disaggregation into different categories (i.e. medication, condoms and contraception separately).
Almost all respondents (96%) who said they needed to see a healthcare worker for a chronic condition (e.g. HIV, TB or diabetes) in the last four weeks said they were able to do so (NIDS- CRAM). Approximately 19% of the sample (1612 respondents) reported that in the last 4 weeks they needed to see a health worker about a chronic condition (e.g. HIV, TB, diabetes etc.). This is encouraging since the period referred to was during Level 5 or Level 4 lockdown in South Africa.
Of those that needed care for an acute condition, only 78% visited a healthcare facility (NIDS- CRAM). Nearly 1-in-10 respondents (9%) reported symptoms in the last four weeks that indicated they might need care (for example fever, sore throat, coughing, shortness of breath or injury). We distil health needs for these questions further by excluding those who said that they did not see a health worker because they did not require care for their symptoms, illness or injuries. Of those that likely needed care, 22% did not visit a healthcare facility. Although this is a relatively small number of respondents (133 individuals) their stated reasons for not seeking care are nevertheless interesting to unpack further. It is worrying that for those respondents who did not seek care for their acute health needs, COVID-19 and lockdown-related fears were mentioned as the number one reason.
Affluent South Africans have exaggerated infection risk perceptions. The proportion of individuals reporting that they are likely to contract COVID-19 increases substantially when comparing the poorest fifth (20%) of the population to the richest fifth. Affluent individuals in the top quintile are almost twice as likely (53%) to believe that they will contract COVID-19 than those in the poorest quintile (25%).
Although 90% of respondents reported changing their behaviour in some way, only 1-in-3 are reporting implementing the most effective preventative measures (NIDS-CRAM). While 91% of respondents reported changing their behaviour in some way to try and prevent contracting or spreading the virus, much of this effort is expended on low-impact strategies. As droplet transmission is the most common means of spreading the disease, the first-best strategies are widely acknowledged to be avoiding large groups of people, physical distancing and mask-wearing. Of those that reported changing behaviour, only 35% reported enacting first-best preventative behaviours.
Knowledge about the three most common COVID-19 symptoms is limited, especially for tiredness. Although 64% of respondents listed coughing as a symptom, and 63% listed fever, only 11% listed tiredness as a symptom. This implies that many South Africans would not be in a good position to make decisions about when it would be vital to quarantine and/or seek care for COVID-19 symptoms. This is expected to have negative consequences for individuals but also on more broadly for society because it works against the containment of the disease. Furthermore, knowledge of symptoms and compliance with preventative behavior were not significantly higher amongst high- risk groups such as the elderly and those with chronic health conditions.
1-in-10 HIV+ new and pregnant mothers in our sample ran out of ARTs in May and June (MATCH). Of the 3047 new or prospective mothers that answered the question about ARTs, 46% said they did not require ART. Of the 1610 that required ART, 175 mothers (11%) said that they ran out of ART. When asked the question* why they ran out of ARTs, 40% selected “Afraid of getting the Coronavirus” as their reason. This fraction is very concerning as interruption in ART risks the health of the mother, as well as increasing the risk of transmission to the baby, whether vertical or through breastfeeding.
*The exact wording of the question was: “Why did you run out of ART? 1-Afraid of getting the Coronavirus 2-No ART available; 3-Waiting time; 4-Transport problems; 5-Don’t want to answer” (note there are character restrictions to SMS survey questions)
/file/dailymaverick/wp-content/uploads/Health-Figure-1.jpg "Figure 1: Selected reason why new and prospective mothers ran out of ARTs (Note this graph reports on the 175 mothers that reported running out of ARTs) (Source: MATCH)")
1-in-6 mothers and pregnant women report at least a 2-month gap in care (visiting a clinic or hospital) (MATCH). Of the 3140 women in our sample surveyed at the end of June, nearly 60% reported attending a healthcare facility in June and a further 24% in May. Of concern is the fact that 16% of the sample (513 women) reported that their last clinic visit was in April or earlier. This equates to a 2-month gap in care, which represents a risk to pregnant mothers and to new lives in this important developmental phase. Admittedly, the risk varies substantially based on the individual’s health. Nearly 1-in-10 respondents (9%) reported a more than 3-month gap since they last visited the clinic or hospital, which is of particular concern. Of those who did not go to the clinic, 37% cited Coronavirus fears as the reason why they did not consult (see Figure 2).
/file/dailymaverick/wp-content/uploads/Health-Figure-2.jpg "Figure 2: Stated reason why new and prospective mothers did not visit the clinic recently (Note this graph reports in the 513 women who did not go in the last 2 months) (Source MATCH Wave 1 2020)")
Policy options: What can policymakers do about this?
- Deploy community health workers more effectively as service linkers
- Strengthen local coordination structures to ensure local ownership and champions that are required for changing social norms
- Distribute free masks to the poorest communities: Not all citizens who need them can afford appropriate face masks, or enough of them. These should be distributed with instructions as well as information flyers.
- Provide specific and actionable recommendations on key preventative behaviours: with a focus on mask-wearing and physical distancing
- Clear, concise, and consistent communication: to improve knowledge of symptoms especially weakness/tiredness
- Anchor messages in hope and a positive vision for the future
5. Background information
This section provides further information on the background to the NIDS-CRAM study which may be helpful for those who want to know more about it.
5.1. Funders
The NIDS-CRAM study is funded by the Allan & Gill Gray Philanthropy, the Federated Employer’s Mutual Fund Education Foundation (FEMEF), and the Michael & Susan Dell Foundation. The views of the authors do not necessarily reflect the views of the funders. The NIDS-CRAM grant is managed by the Allan Gray Orbis Foundation Endowment who is the contracting authority for all service providers.
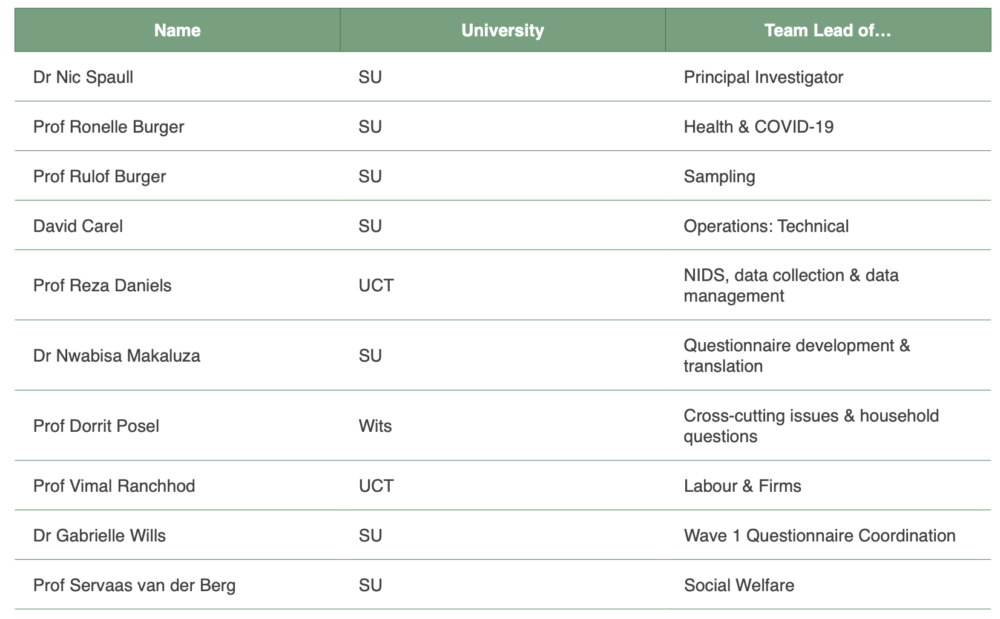
5.2. Questionnaire Development, Team Leads and Working Groups
The development of the NIDS-CRAM Wave 1 questionnaire was a rapid, collaborative and iterative process that was lead by the ten Team Leads who are the Co-Investigators of the NIDS-CRAM project together with the Principal Investigator Nic Spaull. The content areas are summarized below. Each Team Lead oversaw a Working Group which included the 30 researchers in the broader NIDS-CRAM consortium. All Team Leads participated in the weekly 2-hour Friday meetings from the beginning of May 2020 until July 2020. The aim of those meetings was to review data quality, response rates and representivity and to jointly decide on issues related to sampling, questionnaires, ethical approval etc. The full list of researchers per working group is available on https://cramsurvey.org/about/
The questionnaire went through 12 iterations and was piloted in English, isiZulu and Sepedi by two companies. The aim of this was to check for length and any other problems before piloting with the NIDS Pilot Sample. Following these pre-pilots we shortened the questionnaire significantly to make sure that it could be completed within 20-minutes, the length we were advised was the maximum time for a telephone survey. The results from the full Wave 1 sample show that the mean interview time was 19.6-minutes (interquartile range of 15.4min - 22.5min). The main aim of the NIDS Pilot Sample was to run the survey with a group of approximately 100 members of the NIDS sample group which do not form part of the NIDS Wave 5 sample. In addition to the above Team Leads convened a number of “sector-specific” Zoom meetings to discuss matters arising from the alpha, beta and final release of the data.
5.3. Data Collection
The management of the telephone survey service provider, including data quality checks and contact protocols has been managed by the Southern African Development Labour Development Research Unit (SALDRU) National Income Dynamics Study (NIDS) team consisting of Reza Daniels, Tim Brophy and Kim Ingle. These are the same researchers that were involved in NIDS Wave 5 in 2017 and thus are most familiar with the NIDS protocols and data quality checks. For more information see Ingle, Brophy and Daniels (2020).
5.4. Ethical clearance
Given that the NIDS-CRAM study is a follow-up survey to NIDS it was decided that the appropriate channel through which to request primary ethical clearance would be the same ethics committee that granted ethical approval for NIDS Wave 5, which was the UCT Commerce Ethics Committee. The draft and final questionnaire were submitted to UCT ethics and approval was granted (REC 20202/04/017). On the advice of the Steering Committee we also submitted an application for reciprocal ethical clearance at the University of Stellenbosch since the PI (Nic Spaull) is based there as well as a number of the Team Leads. That reciprocal ethics application was also approved (REC 15433).
5.5. Translation processes
Given that more than 90% of respondents in NIDS 2017 indicated that their preferred language of interviewing was not English but rather one of the other official South African languages, we prioritized the translation and re-translation of our NIDS-CRAM Wave 1 questionnaire. We commissioned two independent translation companies to translate the questionnaire in addition to the survey service provider’s translations, and to test the length of the survey in translation. Based on the feedback from the service-provider’s call-center agents and our own quality control we decided to use ‘Uliza’ as the service provider for translations going forward. Our contact person at Uliza was Grant Bridgman (grant@uliza.org). The translations were done using a double-blind procedure; one translator and one proof-reader worked separately from each other and were not in communication. Their translation manager then conducted quality checks on the formatting, completeness, and basic grammar of the submission. Once we received the translation from Uliza, we sent it to the survey service provider where they conducted an internal pilot to ensure correct understanding of the questionnaire in African languages.
5.6. Peer-review process for NIDS-CRAM Working Paper Series
All papers in the NIDS-CRAM Working Paper series have undergone peer-review. Given the rapid turn-around times, the size of the research team, and the fact that many of the peer-reviewer’s we would have selected were team members we decided to do an internal peer-review process. The peer-reviewers were Prof Cally Ardington, Dr Nwabisa Makaluza, Dr Gabrielle Wills, Dr Anja Smith, Prof Murray Leibbrandt, Prof Vimal Ranchhod, Peter Barron, Prof Mark Tomlinson, Prof Servaas van der Berg, Prof Ronelle Burger, Prof Ingrid Woolard, Prof Daniela Casale and Dr Nic Spaull.
5.7. NIDS-CRAM Steering Committee
The NIDS-CRAM Steering Committee is made up of ten people that come from academia, philanthropy and government. The aim of the Steering committee is to provide governance oversight for the project. All publications arising from the NIDS-CRAM consortium are authored by specific individuals and the views in those papers are those of the authors rather than the broader group of researchers. Papers are not ‘vetted’ or approved by the Steering Committee but do go through an internal peer-review process managed by the PI, Nic Spaull. Both Ingrid Woolard and Murray Leibbrandt were original Principal Investigators of NIDS. The full list of members and their affiliations are included below.

5.8. Selection of Survey Service Provider
Following the approval of the proposal by the NIDS-CRAM funders, the PI received advice from a number of people familiar with telephone surveys in South Africa. Following these discussions, on the 31st of March we put out a Terms of Reference asking prospective telephone survey companies to submit their bids and proposals. We received proposals from eight companies. The NIDS-CRAM selection panel consisted of members from the funding group, the NIDS team, the Team Leads, and the Steering Committee. Of the eight bids, six were long-listed and asked to re-submit their bids in a standardized costing template provided and subsequently three were short-listed for interviews before the final service provider was selected and contracted.
5.9. Data access and data storage
All data collected under the NIDS-CRAM project is freely and immediately available on the Data First Open Data Portal. All researchers and interested members of the public are invited to download the data and analyze it themselves (https://www.datafirst.uct.ac.za/dataportal/index.php/catalog/ central/about). The Team Leads were given access to the Alpha data on the 11th of June. This allowed Team Leads to flag any issues arising. After signing an NDA, the broader NIDS-CRAM consortium of researchers were sent the Beta dataset (the first 4,000 observations) on the 15th of June to begin their preliminary analysis, code their do-files etc. The final dataset was sent to researchers on the 30th of June allowing them time to re-run their do-files, finalise their analysis and submit their papers for peer-review.
6.References
Ingle, K., Brophy, T., Daniels, R.C., 2020. National Income Dynamics Study – Coronavirus Rapid Mobile Survey (NIDS-CRAM) panel user manual. Release July 2020. Version 2. Cape Town: Southern Africa Labour and Development Research Unit.
Kerr, A., Ardington, C., & Burger, B (2020). NIDS-CRAM sample design and weighting. NIDS-CRAM Technical Document B. (Online). Available: https://cramsurvey.org/reports/ [15 July 2020]
National Income Dynamics Study-Coronavirus Rapid Mobile Survey (NIDS-CRAM). 2020, Wave 1 [dataset]. Version 1. Cape Town: Allan Gray Orbis Foundation [funding agency]. Cape Town: Southern Africa Labour and Development Research Unit [implementer], 2020. Cape Town: DataFirst [distributor], 2018.
Southern Africa Labour and Development Research Unit (SALDRU). 2018. National Income Dynamics Study 2017, Wave 5 [dataset]. Version 1.0.0 Pretoria: Department of Planning, Monitoring, and Evaluation [funding agency]. Cape Town: Southern Africa Labour and Development Research Unit [implementer], 2018. Cape Town: DataFirst [distributor], 2018. https://doi.org/10.25828/fw3h-v708
Spaull, N., Wills, G., Makaluza, N., Carel, D., Ingle, K., Brophy, T., Daniels, R. C, Burger, R., Burger, R., Posel, D., Ranchhod, V., Van der Berg, S. (2020). The NIDS-CRAM Wave 1 Questionnaire. NIDS- CRAM Technical Document A. (Online). Available: https://cramsurvey.org/reports/ [15 July 2020]