


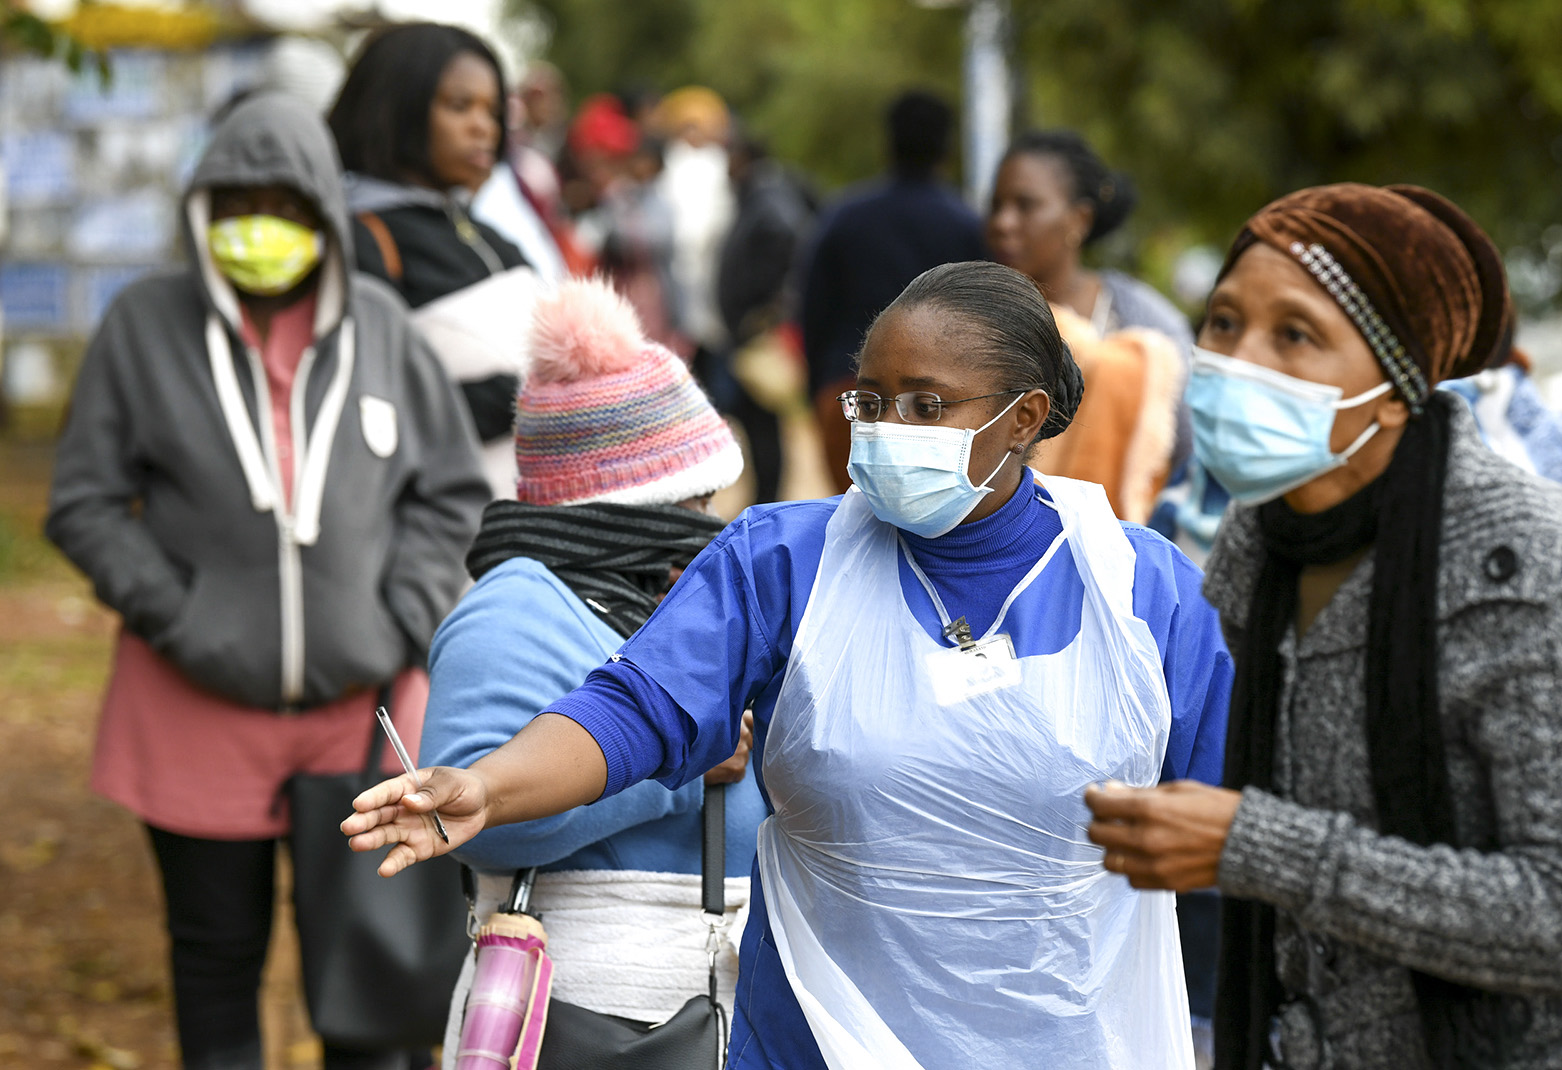
 Medical staff encourage social distancing outside the Stretford Clinic in Orange Farm, Johannesburg. (Photo: Chris Collingridge)
 President Cyril Ramaphosa has emphasised that we must all play our part in fighting Covid-19. However, without sufficiently detailed data and more specifically, geospatial data, this will be difficult. When comparing South Africa to other democracies in providing information on the epidemic, we are not doing well.
Under lockdown Level 3 and the start of business operations in many sectors, government ministers are emphasising that businesses and their workers must play their role and show accountability in limiting the spread of the disease. This objective is undermined to the extent that businesses and citizens do not have access to sufficiently detailed data on the risk level of Covid-19 and supporting health infrastructure.
We are poorly informed as to where the epidemic is expanding most rapidly demographically or geographically. At best, the national, provincial and metropolitan Departments of Health release data describing trends at highly aggregated levels. For example, information is released for the seven regions of Johannesburg. The average population of each region is over 800 000, limiting insight as to what trends can be detected.
The National Institute for Communicable Disease (NICD) produces a weekly and daily report that provides useful aggregate information at a national and provincial level. The weekly report has a breakdown for tests and confirmed cases by province, age and gender. No demographic breakdown of deaths or comorbidities is provided. Interestingly, the weekly report contains provincial figures on incidence rates and changes in incidence, which would be far more valuable if provided in the form of a map.
The daily NICD report provides statistics on cumulative and new cases by province and gender. It includes data on the testing by public and private as well as community and passive means. By contrast the Netherlands’ Ministry of Health, Welfare and Sport provides a detailed daily report, which shows daily statistics on confirmed and new cases, total and new hospitalisations and total and new deaths by province. What it also shows is the cases, hospitalisation and deaths by gender and age.
/file/dailymaverick/wp-content/uploads/Gugulethu-confirmed-cases-washing-hands.jpg "We have captured the Western Cape suburb level case data into a GIS. Red & orange colours are high incidence of cases. Circles represent compliance to washing hands. People in the high incidence areas seem to be washing their hands but analysis of other compliance measures may identify gaps. From the paper that you are publishing, we have been able to ascertain that connectivity of the population is a critical aspect of the spread of the pandemic. It is clear that connectivity is a potential factor in the spread in the Cape Peninsula. Further analysis will have to be done.")
The South African authorities have comparable detail at hand, but insist on aggregating it before releasing it. This at the very least, denies access to official statistics needed to ensure academic credibility. The yardstick of academic credibility in so far as statistical analysis is concerned, is replicability. The tests here are whether other users come to the same conclusion when using the same data. By concealing the base data, South Africans have no way of knowing whether the data has been misinterpreted or otherwise censored. This credibility gap can only be overcome by the authorities releasing the data to the broader research community.
The aggregated statistics being released by government offer limited insight. If accompanied by demographic and geographic detail, the utility improves dramatically. It is this lack of detail that limits individuals and businesses from formulating their risk-adjusted strategies. Surely government has a responsibility to provide this information so that it can be used to make informed decisions. This paper urges that a number of sources of information needs to be provided so that individuals, communities, municipalities, provinces and businesses can inform their risk-adjusted strategies and so that South Africa can bring Covid-19 under control.
Business needs comprehensive information to tackle Covid-19
South Africa needs all hands on deck, whether they are frontline staff or data scientists analysing the progression of the disease. Much more can be done by the national government to make the information required for analysis available, as has been done in most established democracies.
In developing their risk-adjusted strategies, the private sector is desperately in need of detailed information regarding demographic vulnerability and geographic concentrations of infections and recoveries. Some progress has been made in this regard, especially with the Western Cape government releasing information at suburb level. Unfortunately, even this move was met with criticism from key stakeholders that one would expect to be supportive of increased data dissemination. The resistance suggests that we are best protected from too much information and that carefully curated scenarios provided by the state are a viable alternative.
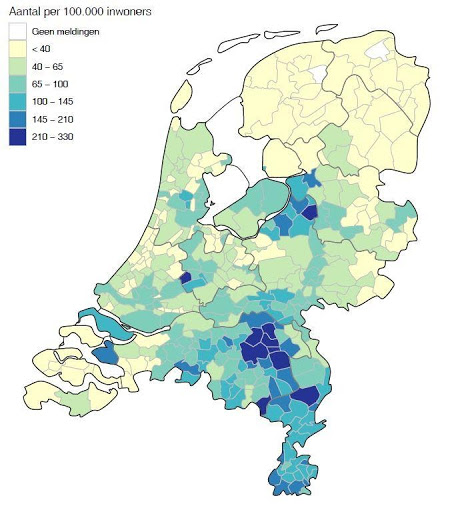
The Netherlands also produces thematic maps at a community level. Presently, South Africa provides maps at provincial level while Cape Town has mapped its data down to sub-districts and the Western Cape province, to community level. There is clearly no standardisation and understanding of the importance of making this information available at a sufficiently detailed spatial level. Ideally, data on Covid-19 should be released in digital formats that allow more detailed inspection and analysis. The map below shows the total number of hospitalisations per 100,000 population for the Netherlands. Data of this nature is desperately required for South Africa.
Information on Covid-19, health system and social aspects needed
The information required by economists, healthcare professionals, risk assessors and data scientists include the total number of cases, hospitalisations and deaths on the health system. Short (month-on-month) and long-term (quarterly or annual) trends can identify areas that have either an acute or chronic problem. Indices like Location Quotients can be used to show if cases, hospitalisation and deaths in particular areas are above or below expectation.
All these forms of indicators should be used in standardised reports so that researchers and analysts can integrate the information and provide insights that may inform private and public sector strategies.
The key variables that are needed to fight Covid-19 are information on the total and daily number of cases, hospitalisations, recoveries and deaths at a sub-place level combined with location and demographic details of patients. This information should preferably be available in standardised formats that are regularly released. Other datasets can then be integrated with the Covid-19 data to reflect the progress of the pandemic more effectively. For example, having access to the digital data at a geographic sub-place level allows current population estimates to be used in calculating the ratio of cases, correlate infections to hospital facilities, and derive area-specific recovery and death rates.
Information on the health system (field hospitals, occupancy rates and so on) is also critically needed, including the location of hospitals (number of Covid-19 and ICU beds) testing lab capacity and burden (public and private) as well as occupancy of isolation and quarantine facilities. Businesses need to be able to conduct origin-destination studies so that they can estimate the risk profile of employees and be able to minimise exposure.
Workers use different modes of transport (eg taxis, buses and trains) to travel from their place of residence (origin) to their place of work (destination). These nodes are associated with wildly varying risks and it is essential for businesses that they are able to minimise their workers’ risk profiles. This requires the detailed data indicated above. Along the way, they may have to pass through several connection nodes, possibly moving from one mode of transport to another, and being exposed to different levels of risk to the disease. So, information on taxi, bus and rail routes and number of commuters would provide important insights.
There is a growing argument that this information must be made publicly available. Some would argue that this would only benefit a few in our society and that citizens would remain uninformed. In following principles of social accountability where citizens are a partner with government and service providers in dealing with a crisis like this, the use of mass media to inform them is clearly an option. Print media, community radio and television are crying out for material to convey to their audiences on a daily basis.
National and local levels of compliance
Other factors that need to be understood are the risk-aversion behaviour being followed by populations where they reside. An internet-based social attitude survey conducted in April/May by the University of Johannesburg (UJ) and the Human Sciences Research Council (HSRC) looked at factors reflecting risk aversion behaviour followed by respondents.
It asked respondents whether people were using prevention measures such as washing hands, using hand sanitiser, social distancing and wearing masks in their areas of residence. Nationally 77% of respondents indicated people were washing their hands, 66% indicated residents were social distancing, 63% of respondents were using hand sanitisers but (then) only 37% were wearing masks. The responses varied widely reflecting the socio-economic and human settlement characteristics of areas.
As an internet-based survey, it relies on respondents heeding to the call to participate in the social attitude survey, but by not having to face an interviewer, the responses are probably more candid. The 5,481 completed interviews were well distributed across the country and within different socio-economic and human settlement strata. The beauty behind the on-line survey is that responses can be linked to geographical areas.
When respondents voice their opinion, it informs analysts about their areas as well. By responding to the survey, it is possible to identify areas of non-compliance. The indices of non-compliance highlight how the diseases may continue to spread. The survey should be conducted again in a few weeks’ time to see how the situation is changing and where areas are that have a high incidence of Covid-19 and low compliance.
An analysis of the data available shows that people from all walks of life including metros, towns, rural areas are washing their hands. Those that cannot do so, are found largely in areas where access to water is an issue (eg informal settlements & deep rural areas). By contrast, social distancing is more difficult for people living in informal settlements, township residents, especially those living in backyard dwellings, and in the inner city centres. Even so, the data shows that most people are social distancing. The patterns of wearing face masks are more apparent as people living in townships are generally not doing so.
The figure below shows the level of compliance to washing hands, using hand sanitiser, social distancing and wearing of masks using Circle Point Thematic maps. The centre of the circle shows where the respondents live and the dots represent their answers to questions on compliance with preventative measures. Green dots indicate compliance while red dots represent non-compliance. This is a qualitative method that conserves the confidentiality of respondents and allows patterns in the survey data to be discerned.

With factories being open in the large industrial areas (eg Rosslyn in Tshwane Metro), a detailed understanding of the risk behaviour of employees who commute is essential. Most Rosslyn employees live in Soshanguve, Mabopane and Garankuwa. Residents of these areas routinely wash their hands as a preventative measure. Although the data shows that most people in these feeder areas are social distancing and sanitising their hands, there are fewer people in Soshanguve that are complying. In all communities, the wearing of masks is not being done as much as the other preventative measures. This does give some indication of the variation in risky behaviour and what preventative measures are feasible for people to do, considering aspects such as access and affordability.
China shows how data can be leveraged to limit the epidemic
The government should make standardised data available so that the research community can apply their scientific, methodological, data and technological know-how in providing insights into aspects of the disease. More importantly, citizens and businesses would have access to data that informs them of the dynamics of the pandemic. A scientific paper in Geography and Sustainability shows how China used many research institutions to contribute to understanding the disease and to develop strategies to monitor and control the pandemic.
The research showed the importance of having easy access to spatiotemporal or geospatial big data. Countries such as Taiwan have shown how important this is to track people at risk of exposure as they move through different communities. The success of these campaigns has relied on key information relating to Covid-19 testing, positive cases, levels of hospitalisation and fatality indicators being mapped at detailed spatial levels.
Having access to comprehensive information, the Chinese were able to develop exposure and transmission risk indices so that hotspots could be identified, and appropriate transmission control centres established. This will become more important in South Africa, especially as Level 3 lockdown progresses and as the number of infections rise.
By following this approach, China is now at the stage where they are talking about the “end of the Covid-19 epidemic”. This is similarly the case in Vietnam where they have been able to fully open their economy with regulations to control the disease. Information is needed to adjust prevention and control strategies. The fact that there are reports in the media raising concerns about the accuracy of figures being reported by China, which is evident in Our World in Data, this does not detract from the methods being used and described in this international journal.
The research showed that the severity of the disease is highly correlated to the number of people moving and especially on mass transport systems like trains. The available data enabled the identification of high transmission nodes in the transport network, where and when the nodes of greatest intersection were. This was typically where commuters changed modes of transport (eg train to taxi) or moved from one service provider to another. When the high-risk nodes were identified, strict surveillance measures were used to contain the spread of the disease.
A broad understanding of daily movement can be obtained from some businesses, transport authorities and by integrating data from the National Household Travel Survey (NHTS) of Statistics South Africa. In Rosslyn industrial area as an example, the NHTS shows that just over 7,500 (23.2%) of people come from Soshanguve South, just over 3,300 (10.4%) from Soshanguve North, close to 3,000 (9.1%) from Mabopane, with the remaining 18,500 (57%) coming from the other parts of Pretoria. Most people from Soshanguve South travel either between the hours of 5am-6am (44%) or 6am-7am (37%) while people from Soshanguve North travel between 5am-6am (47%) or 4am-5am (21%) because they are further away. Eighty-five percent of people travelling from Mabopane travel between 5am-6am.
Nearly all people use taxis from Soshanguve South and no changes in transport mode is required. Just over half of commuters from Soshanguve North use taxis and one fifth use lift clubs with 18% switching transport. People mostly use taxis from Mabopane (69%) with 30% switching transport. Statistical analysis between Covid-19 cases and this sort of travel information data would enable the correlation coefficients to be determined and help in defining the levels of transmission and exposure risk as well as where interventions are needed the most. Based on the experience of China, knowing levels of compliance and switching modes of transport at key intersections are critical points to control the disease.
The figure below shows the mapping of where people come from to reach their place of employment in Rosslyn. It also shows the mode of transport and whether people change their transport type. Strategies to disperse the flow of commuters over time periods and minimising the switching of transport modes should be considered, but probably the most effective is to ensure effective preventative measures are implemented at all stops and major transport nodes, especially the sanitising of transport types and commuters as they move from one mode to the other.

Information is foundational in dealing with pandemics
Severe Acute Respiratory Syndrome Coronavirus 2 (SARS-CoV-2) causes Coronavirus disease or COVID-19. Similarly, the Human Immunodeficiency Virus (HIV) causes Acquired Immune Deficiency Syndrome or AIDS. Since the early 1980s, HIV/AIDS has caused an estimated 39 million deaths while to date Covid-19 has caused more than 416,000 deaths. Both are considered pandemics and as a consequence, parts of the new UNAIDS 90-90-90 strategy being implemented to end the AIDS pandemic by 2030, must be applicable to Covid-19.
The strategy to control HIV was premised on knowledge (and data) dissemination, the changing of attitudes and behaviour. The route to combating Covid-19 is no different; what does appear different is the state’s attitude to sharing information, the promotion of analysis by academics and research communities.
Although there is no cure or effective vaccine for HIV (or for Covid-19), antiretroviral therapy has slowed the progression of the disease and saved the lives of millions of people in South Africa and across the world. The UNAIDS 90-90-90 strategy has set the goal that by 2020, 90% of all people living with HIV will know their status, be receiving antiretroviral therapy and have viral suppression. In achieving this strategy, UNAIDS is clear that information and knowledge are of vital importance in developing an evidence-based approach to tackling the pandemic.
So, the fight against Covid-19 must be evidence based through the use of information. This does not mean that only those involved in the strategy or global and national programmes should be in the know. It means that all citizens have a right to know the risks that they are facing. It is important for the government to make sufficiently detailed information available so that citizens and businesses are informed and so that the greater research community can contribute to the knowledge needed. This will enable South Africans to be part of a unified approach to fighting Covid-19. DM/MC
Craig Schwabe is a geospatial specialist and focuses on the development of geospatial information for South Africa and Africa. He has assisted in the defining the fundamental geospatial datasets development as well as developing key geospatial datasets for South Africa and Africa. As part of the AfricaScope team he has developed demographic and income data for South Africa and countries across Africa. He has been an adviser to multilateral and multinational organisations in the development and use of geospatial data in Africa. Schwabe has published several reports, books, chapters and scientific papers as well as presented papers at a number of national and international conferences. He assisted the Department of Public Service and Administration in publishing guidelines for improving geographic access to government service points.
Michael O’ Donovan is a data scientist and demographer and specialises in the analysis and management of large socio-economic and political databases. He is currently a director of a not-for-profit organisation dedicated to the improvement of quantitative analysis in the social sciences. He is a specialist in the use of statistical and data-mining techniques. His focus areas include crime, poverty and inequality, migration, socio-economic development and political behaviour. O’Donavan has undertaken detailed analysis of Covid-19 data in South Africa.
Bibliography
National Institute for Public Health and the Environment. 2020. Epidemiological situation COVID-19 in the Netherlands. 30 May 2020.
University of Johannesburg & Human Sciences Research Council. 2020. UJ Coronavirus Impact Survey Summary Findings. 20 April 2020.
Zhou, C., Su, F., Pei, T., Zhang, A., Du, Y., Luo, B., Cao, Z., Wang, J., Yuan, W., Zhu, Y., Song, C., Chen, J., Xu, J., Li, F. and Ma, T. COVID-19: Challenges to GIS with Big Data. Geography and Sustainability, 1: 77–87.