


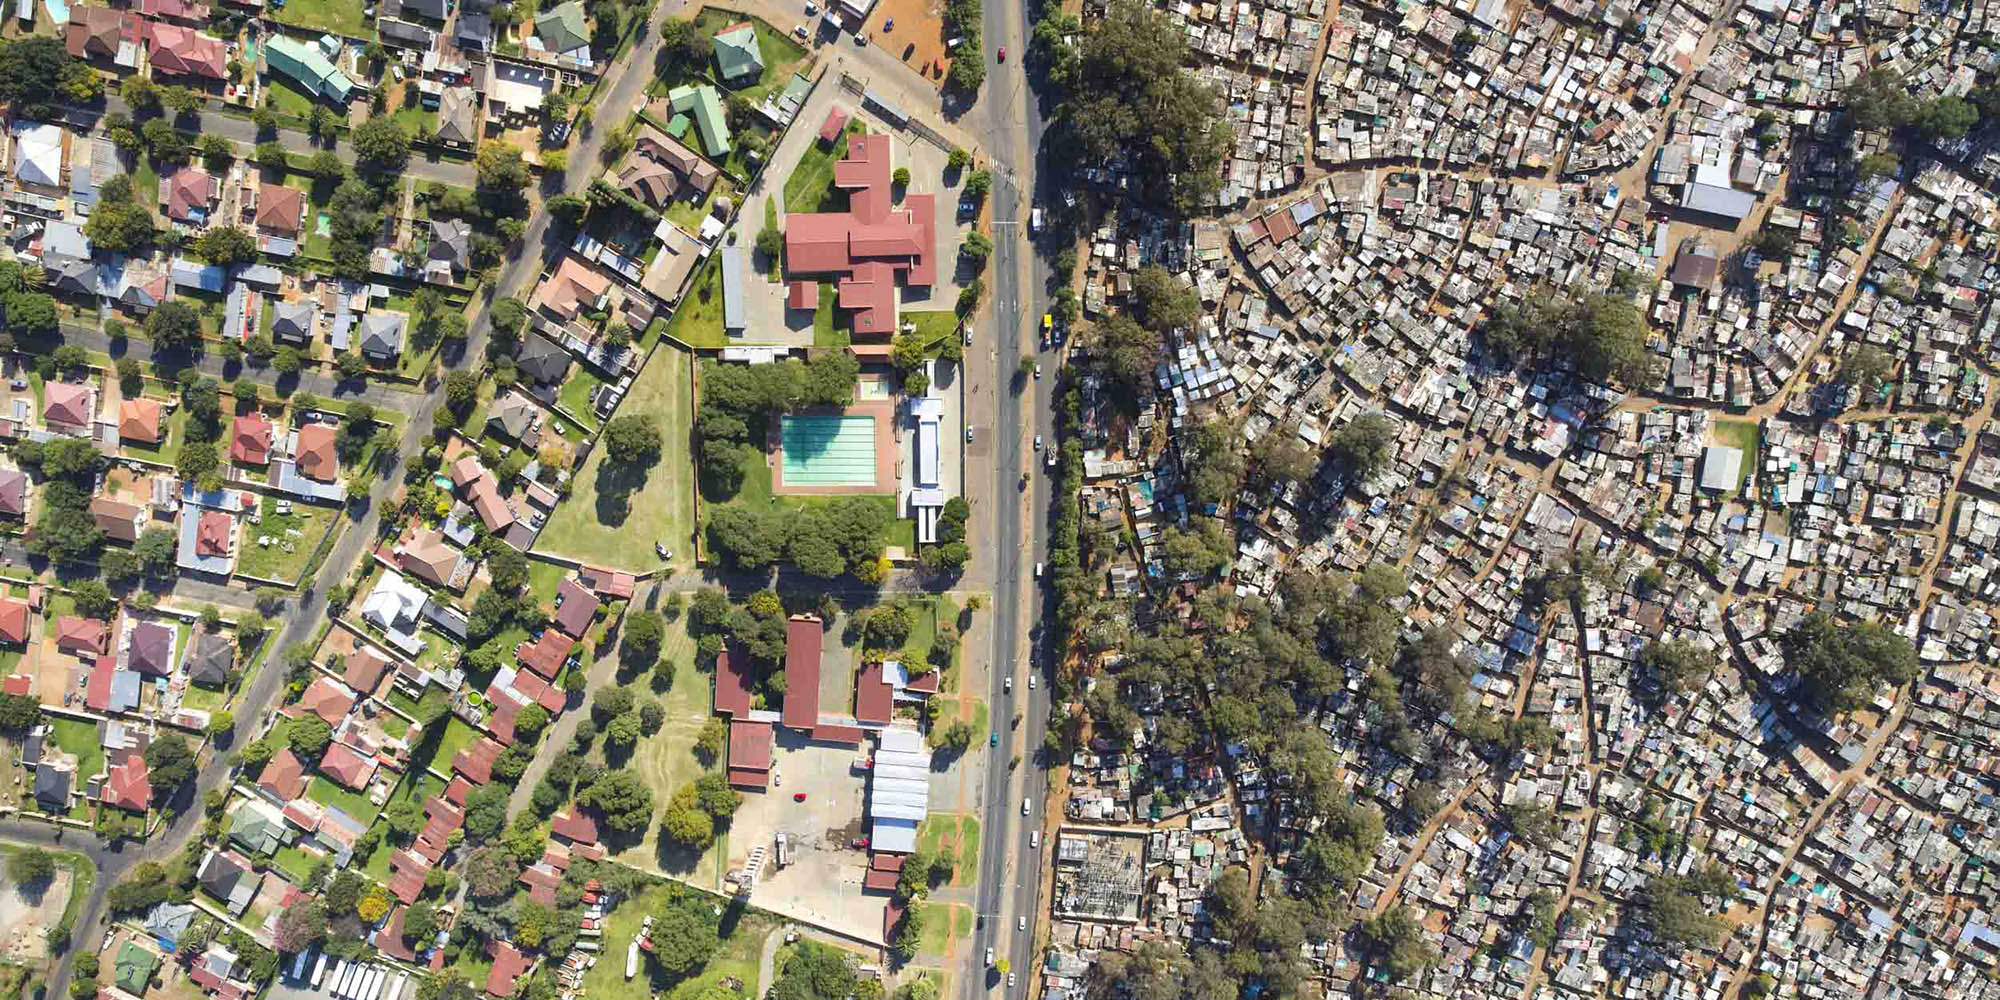
 Despite democracy being realised in 1994, very little progress has been made to redress the ills of the past.
(Photo: @johnny_miller_photography)
Despite democracy being realised in 1994, very little progress has been made to redress the ills of the past.
(Photo: @johnny_miller_photography) Inequalities that were borne of South Africa’s history of colonialism, as well as apartheid, still reign in today’s society.
This is according to the inequality trends report compiled by Statistics South Africa (Stats SA) in partnership with Southern Africa Labour and Development Research Unit and the Agence Francaise de Developpement.
The report, which is the first of its kind in South Africa, used data collected by Stats SA from 2002 until 2017. These include the Income and Expenditure Survey, Living Conditions Survey, General Household Survey and the Quarterly Labour Force Survey.
The report’s combined data, presented by Statistician-General Risenga Maluleke, showed that despite democracy being realised in 1994, very little progress had been made to redress the ills of the past.
“If you browse through the report, you’ll see that inequality is actually quite high still. So even when we talk about reductions, and we talk about progress being made, the levels [of inequality] that are being reported in South Africa are still very, very high compared to other countries,” said Werner Ruch, director of research and product development at Stats SA.
“And we see that this is still very much rooted in structural challenges that are left over from the legacies of apartheid and colonisation,” he added.
Basic services
Apartheid spatial planning continues to influence inequality trends in the country, as rural provinces such as Eastern Cape, KwaZulu-Natal and Limpopo lag behind the other six provinces when it comes to inequality. This is even for access to basic services such as water and electricity.
KwaZulu-Natal and Eastern Cape showed households with the lowest proportion of access to electricity. The districts of Umzinyathi (49.0%) and Umkhanyakude (39.6%) in KwaZulu-Natal, as well as Alfred Nzo (47.3%) in the Eastern Cape had the fewest number of households with electricity.
With regard to access to piped water, in KwaZulu-Natal, the Umzinyathi and Umkhanyakude districts had the lowest percentage of access.
In the Eastern Cape, the OR Tambo and Alfred Nzo districts had the lowest percentage of households with access to piped water, while Nelson Mandela Bay, located in the same province, showed the opposite with 96.4% of households having access to piped water.
Healthcare
Eight out of 10 black-headed households usually use public healthcare facilities. This is in stark contrast to the one in 10 white-headed households that use this service.
Overall, the trend shows that most black and coloured-headed households use public health facilities, while most Indian/Asian and white-headed households prefer private facilities.
This is because, according to the report, about 10.1% of the black population reported having access to medical aid, while 72.4% of the white population had access to medical aid.
The stats show that in 2017, about 20.2% of the coloured population had access to medical aid, compared with 48.9% of the Indian/Asian population.
Black people living in Limpopo reported having the lowest access to medical aid between 2002 and 2017, with the access never rising above 10% in the 15-year period.
Gauteng and Western Cape had the highest number of households with access to private healthcare in the same period, with 25% and 24.8% respectively. However, even in these provinces, the group with the least access was black people, a clear demonstration of geographic and demographic inequalities.
Labour market
Income from the labour market, that is a normal nine-to-five job, accounts for more than 70% income in South African households, the report said.
However, the unemployment rate difference between black and white people in 2017 was stark. A staggering 31% of black people indicated that they were unemployed, while 6.7% of white individuals said they were jobless. Coloured people sat at 23.5% unemployed while Indians/Asians were on 11.6%.
Unemployment has not discriminated though, as was noted by the Statistician-General.
“And as we can see, coming out of 2011, prior to that, about 2008, the unemployment rate for whites in South Africa was sitting at about 5%. Which generally would have meant, in international standards, that whites were not necessarily unemployed at the time.
“As we look, over time, unemployment is creeping in among the white population, albeit at a lower rate compared to the other population groups,” said Maluleke.
Furthermore, trends in the labour sector showed that individuals that earned about R75,000 a month and above saw an increase in the earnings from 2011 to 2015. Meanwhile, those that earned in the region of R25,000 a month or less saw no change in their earnings over the same period.
Inequality also showed across genders in the workplace, with the report saying that females earn less than males across all educational levels.
Females earn about 70.4% of what their male counterparts make, while females with primary school or no education earn 55% of what males in the same group earn.
“The situation is bad. The story is that parts of it are getting better. But even when it’s getting better, we are still at such a high level that South Africa stands out as one of the most unequal countries in the world” said Ruch. DM