


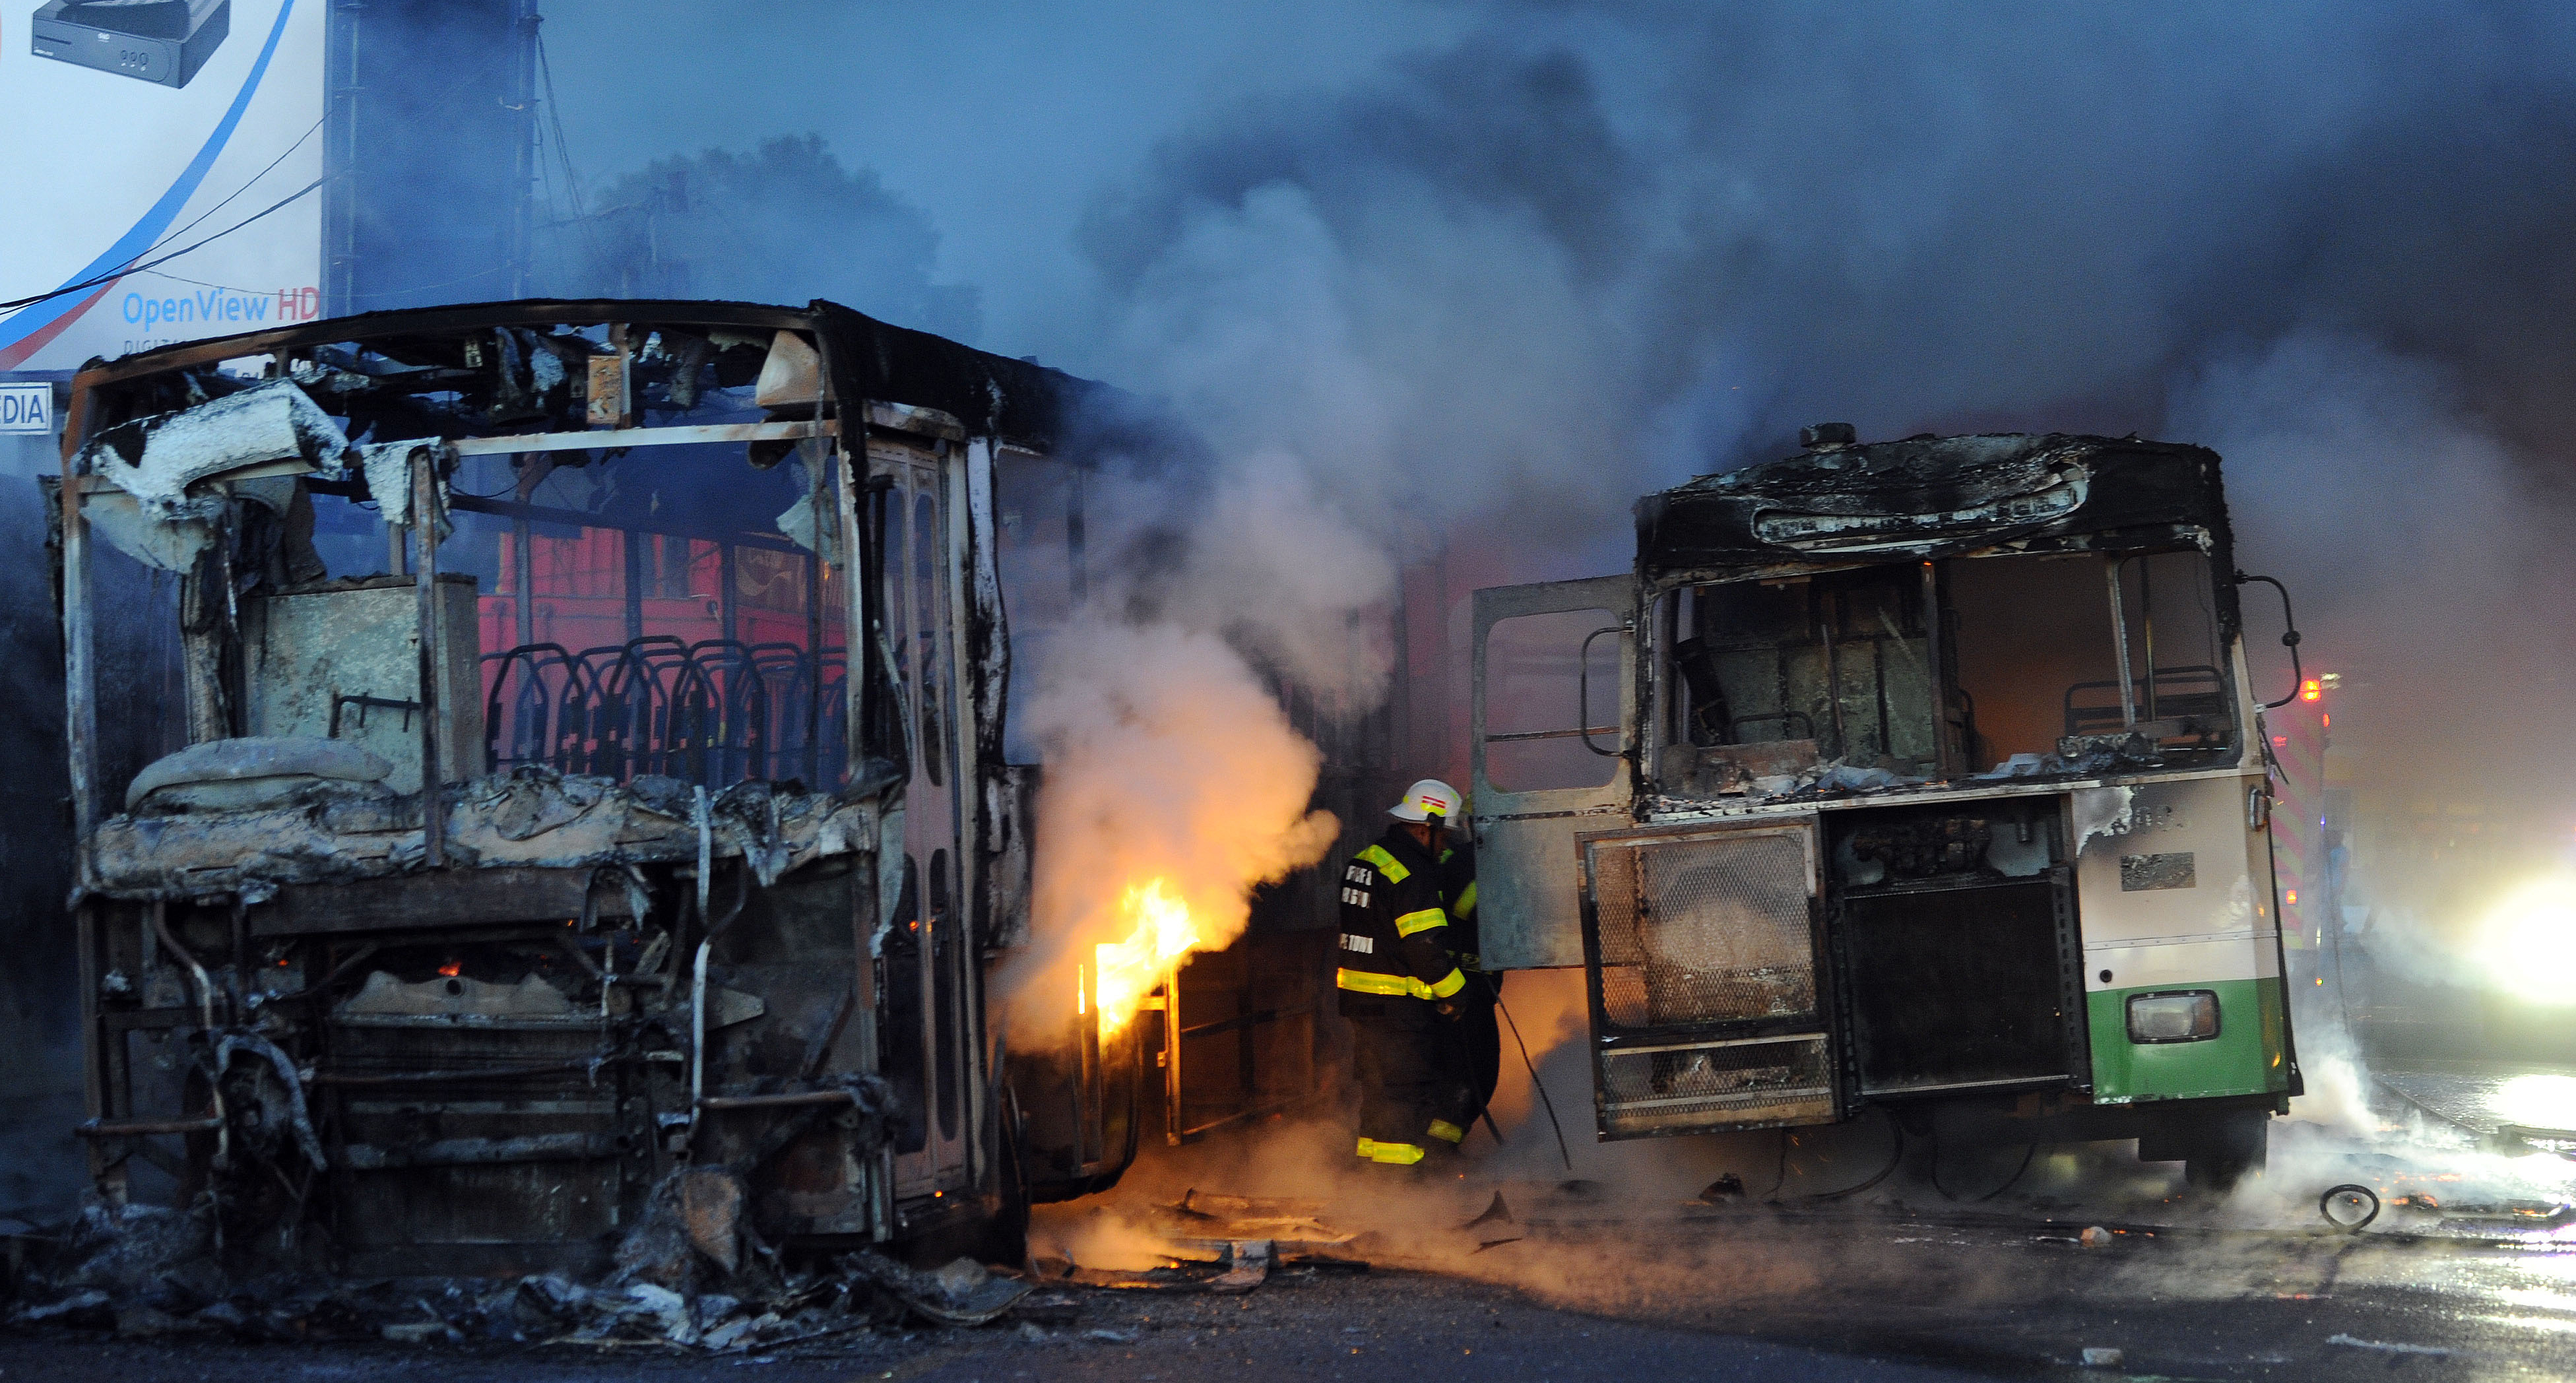
 Buses set alight during service delivery protests on the Cape Flats on September 1, 2014 in Cape Town, South Africa. Protesters set buses alight and assaulted 11 bus drivers. (Photo by Gallo Images / Foto24 / Lulama Zenzile)
 I recently wrote about the necessity of looking more carefully at the crime statistics. For instance, looking at the number of murders per number of people in an area was more meaningful than looking at just the number of murders. When this is done, Nyanga is not seen to be the “murder capital” of the Western Cape. Instead it sits in the company of Gugulethu, Bishop Lavis, Ravensmead and others which have a similar murder rate per number of households.
There is another way of getting meaningful information from the latest murder statistics. This way is to compare the number of murders in the past to the number of murders in the latest report, per police precinct. If we take our starting point as the 2010-2011 crime statistics we are able to leverage the fact that this was also the year of the last census.
In 2016 the Community Survey showed an average of 7% growth in Cape Town since the census. If we extrapolate from that figure we would expect approximately 10% growth by 2018. Obviously this is not evenly spread across the city and some areas will have grown more than others, but it is the best that we can do as an estimate.
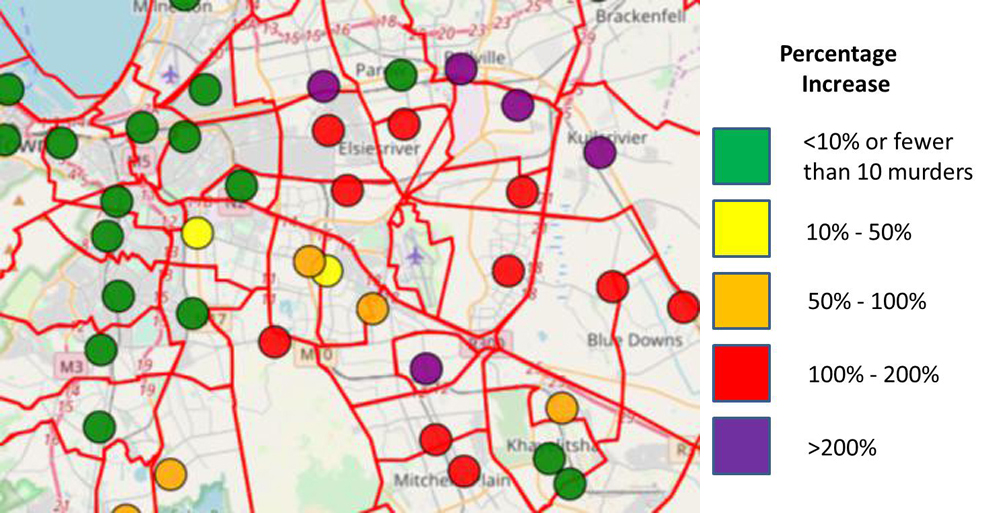
Having this information, we would consider an increase in the murder rate of 10% to be consistent with the population growth. Anything higher than this would be a cause for concern. We thus take the number of murders in each police precinct for 2010-2011 and 2017-2018 and find the percentage increase. We are able to plot these on to a map to see what may be learnt.
The green dots indicate places where the murder increase was less than 10% or where there were very few murders (less than 10). All the other dots indicate an increase in the number of murders above the population growth rate — in the case of the red and purple dots very much higher. In these latter cases, the number of murders has doubled or more in the last eight years. This should surely be a cause for concern.
On looking at the figures we see that most of the purple dots (highest increases) are in areas with relatively few murders — between 20 and 50. These figures could perhaps be dismissed as anomalies. However, these purple dots make a band from Goodwood through Bellville to Kuils River, including Durbanville to the north. Although the number of murders is relatively low, there has been a threefold increase in murders in these areas. There may be some value in paying these areas some attention before the situation gets worse.
Before looking at the red dots, it would be good to see how Nyanga and Khayelitsha have shown. These are both known hot spots. It is interesting to see that two of the Khayelitsha police precincts show as green and that the other, as well as Nyanga, show as orange. While a 50% increase (orange) is still too high, it is much better than other areas, suggesting that interventions in these areas are having a positive effect.
Red dots — indicating areas where the number of murders has doubled — are seen in Bishop Lavis, Ravensmead and Delft, among others. The number of murders in these areas is high and these increases are significant. These police stations showed up previously as having similar murder rates to Nyanga — in other words they are hot spots for murder. Nyanga, however, due to intervention, may be going into “remission”.
We see from Nyanga’s orange dot that the increase in murders there is much lower than Bishop Lavis, for instance. The number of murders a year in Bishop Lavis has gone from nearly 40 to nearly 100. Delft has gone from about 70 to nearly 200. Ravensmead has gone from 23 to 65. These increases are frightening. It would seem that interventions in Nyanga have an effect, but that intervention now needs to happen in other areas. The red dot areas are probably the biggest areas of concern in 2018. DM