


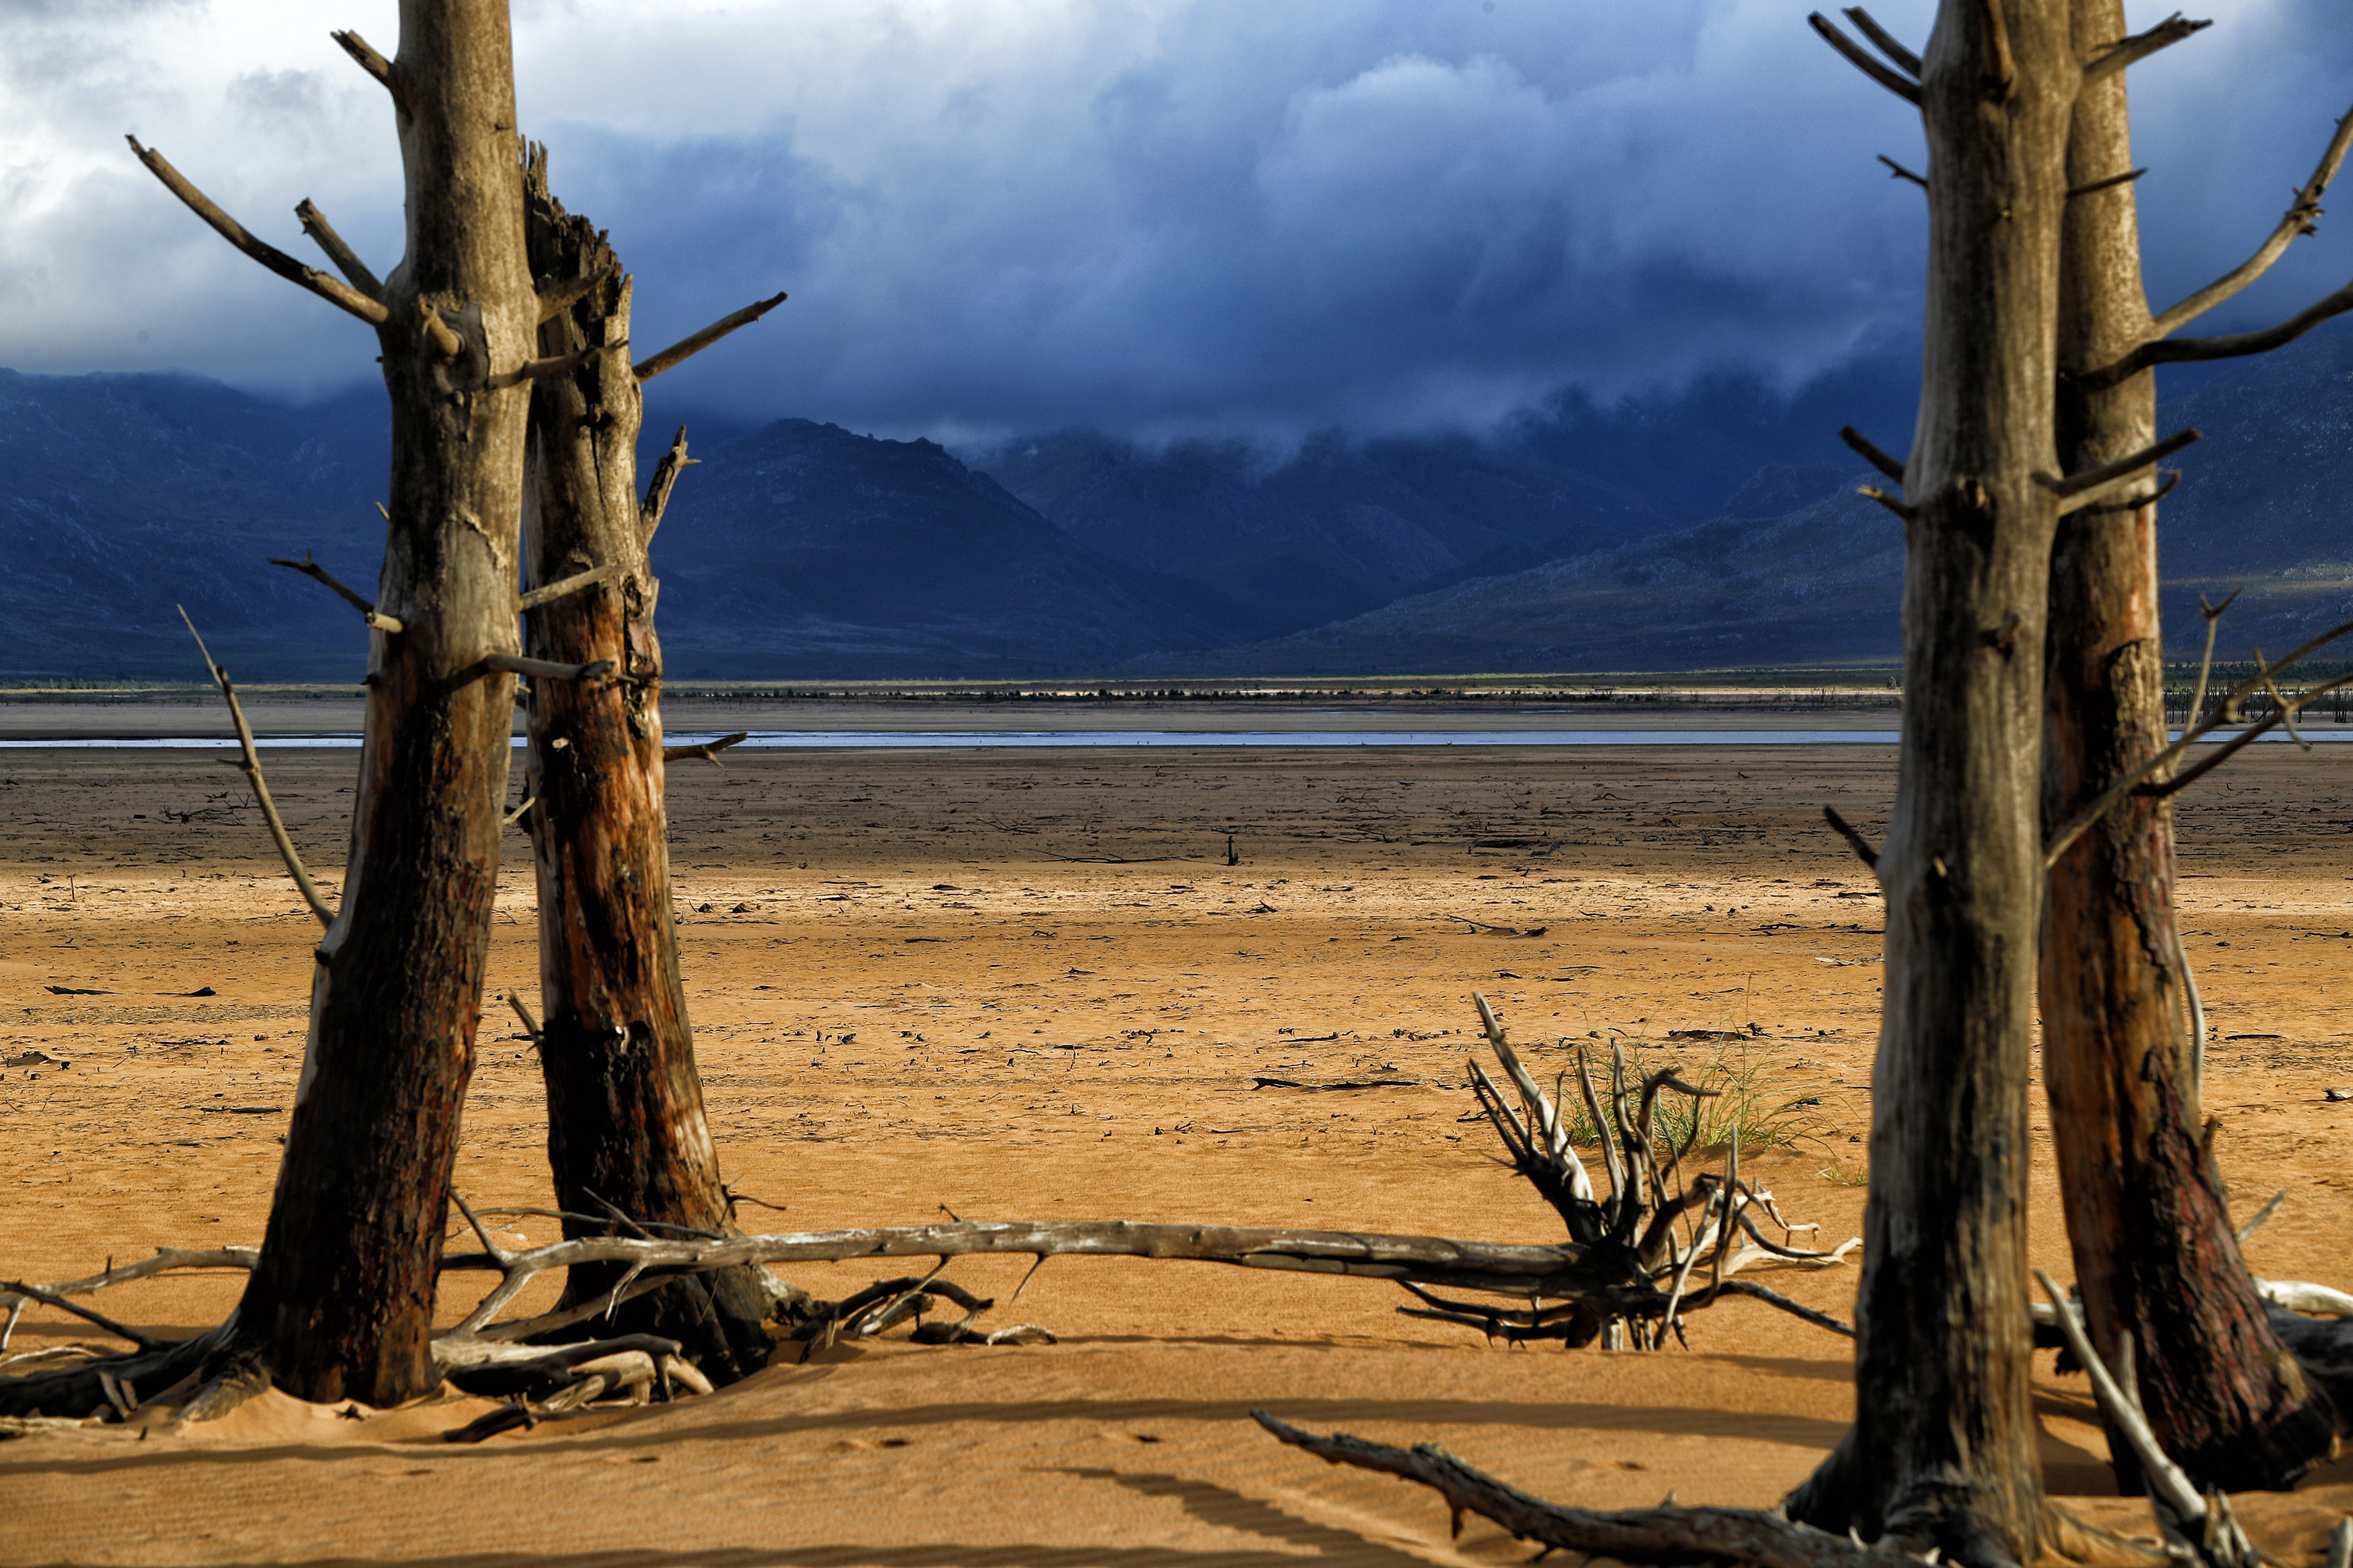
 After the Day Zero scare of 2017 and 2018, better rainfall in the Western Cape is welcome to farmers — but the province needs a few seasons of above-average rainfall for agriculture to fully recover. (Photo: EPA-EFE / Nic Bothma)
 First published by GroundUp
Much has been argued about the causes of the 2017 Cape Town water crisis. Is it the drought? Is it climate change? Is it population growth? Is it lack of foresight by national government or local government? Is it the rich? Is it the poor? Is it farmers? Or industry? Or invasive trees?
The process of analysing causes is understandable and necessary. We want to know. We need to know. We need to understand, because only then can we learn properly from the experience in order to avoid similar crises in the future.
We have heard and will continue to hear various perspectives on this. They are, and will be coming, from scientists, civic activists, the government, various interest groups, experts and non-experts alike. Importantly, opinions might be based purely on perceptions, or they might be based on data and facts.
Here I would like to contribute to this discussion with some data-based analyses. I will attempt to answer a question about the last three years (2015-2017): To what extent has unusual climate and unusual water use in this period affected dam levels and the amount of water available to Cape Town?
To answer these questions we have developed a simplified water balance calculation — a hydrological model — for the Big Six reservoirs and their catchments. The model accounts for the main factors affecting dam storage: rainfall, evaporation and releases for water supply, as well as runoff from the catchments. That runoff is calculated based on rainfall in the catchments, taking into account processes such as soil moisture replenishment and evapotranspiration.
Details of the model and calculations are available in the accompanying blog at the UCT Climate System Analysis Group website.
In those calculations, rainfall is taken as an average of values from five sites, which are located near each of the Big Six dams (there are two Steenbras dams, but I use only one rain gauge to represent rainfall over them, so there are five and not six rain gauges). Potential evaporation is calculated from meteorological variables measured at 35 Agricultural Research Council meteorological stations across the region. Water use by agriculture, Cape Town and the smaller municipalities are represented by data from the City of Cape Town.
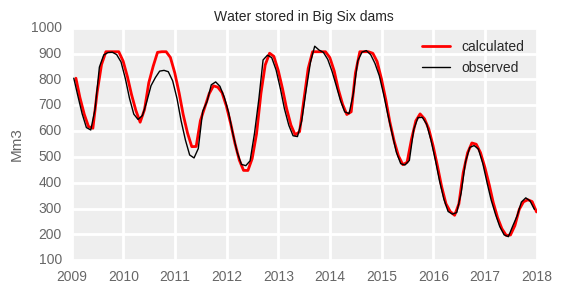
It looks like the model works well indeed! There is some difference in 2010, but that is most likely a result of an error in the data rather than deficiency of the calculation procedure.
Now, I can use the model to answer the question posed earlier: what is the relative role of climate versus water use in lower dam levels in 2015-2017. However, I rephrase this question slightly differently as four “what if” questions.
- What if rainfall was average?
- What if evaporation in that period was average?3) What if municipal water use in that period was average? 4) What if agricultural water use was average?
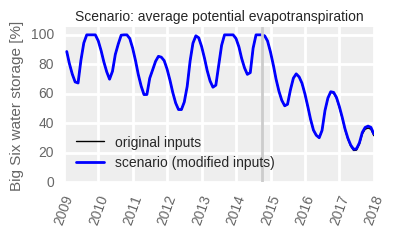
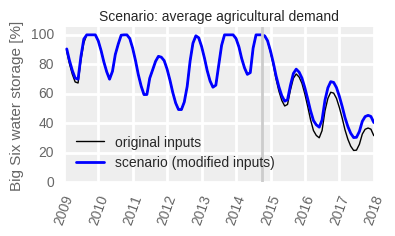
To answer these questions I do the water balance calculations with either rainfall, or evaporation or water use in 2015-2017 set at values representing the 2006-2014 average. These average values are illustrated below, together with the original data:
And this is how the results of the water balance calculation (a water balance model) compare with observed reservoir storage:
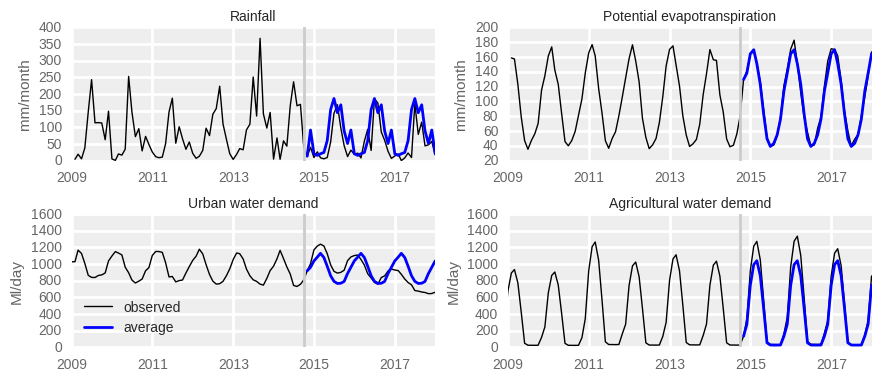
The graphs show clearly that in 2015-2017, rainfall was considerably lower, evaporation was not different, and agricultural use was higher than the recent average. Urban use was higher than recent average in 2015 and 2016, but lower in 2017.
These average values are included in the water balance calculations one at a time. This means that with average rainfall, actual observed values of the three remaining variables (evaporation, urban and agricultural use) are used. This creates four scenarios describing the “what if” situations. The results are as follows:
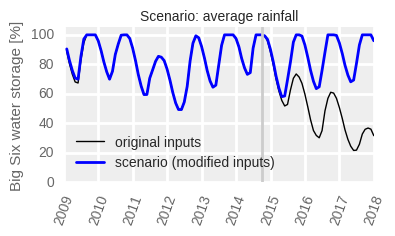

It is clear from the above figures that the main driver of the dropping dam storage was lower rainfall. Unusual evaporation played a very limited role. Increased water use (compared to that in the preceding years), both municipal and agricultural, also contributed relatively little to the reduction in the available water.
If rainfall was average, we would have had full dams at the end of the rainy season every year from 2015 to 2017. If urban water use was average, dams would have only been five percentage points higher at the end of the 2016 rains than they actually were. The lower urban demand in 2017 compensated for that deficiency, however, and at the end of 2017 there was no longer a difference between dam levels under the actual, and under the hypothetical average urban use. The higher than normal agricultural demand, however, reduced the reservoir storage at the end of 2017 by about 8.5 percentage points compared to average demand.
Water shortage may, but does not have to result in a crisis. A water shortage may be merely a nuisance of prolonged, but relatively mild, water restrictions and it does not have to grow into a full-fledged crisis that threatens the existence of a city with dramatic social and economic consequences. Perhaps the “day zero” threat could have been avoided if water allocations were slightly lower, or water restrictions were implemented earlier.
Had agricultural demand been curtailed by approximately 25% already in the 2015/2016 and 2016/2017 growing seasons, dam levels in 2017 would be 8.5 percent points higher than they actually were. Similar reasoning applies to the urban use. But we know this only now, with the benefit of hindsight. It’s easy to have opinions about past events while having such a benefit. It is more difficult to take decisions there and then without it.
To assess the role of water management decisions that were taken in the last three years requires a different analysis than the one done here, however. We are busy with such analyses.
For the time being, let me reiterate: the water shortage in 2015-2017 occurred mainly because rainfall was low. DM