


In her piece published in Daily Maverick on 13 July, Why counting service delivery protests is more complicated than it seems, Rebecca Davis states that “the process of counting and defining violent protest action is not a simple matter” and that “it appears that the (Municipal IQ) data provided this week should be treated with a certain amount of caution”.
Davis questions the Municipal IQ definitions of what constitutes a protest, as well as what constitutes a violent protest. It seems that her main gripe is the “minimal information provided to media”, as well as our refusal to pass on more detailed information on our methodology and the location of protests.
Initially when protests erupted in the form of service delivery grievances in the Free State in 2004, some analysts claimed that these protests were the work of a third force, and therefore illegitimate. This deflected responsibility for service delivery complaints away from government.
Municipal IQ felt strongly at the time that this was not the case, and as a public service to assist stakeholders, the media, and the public at large to keep track of protests in both a systematic and objective way, we started releasing periodic press briefings to the media on our aggregated protest data collected on our Municipal Hotspots Monitor.
We have been doing this for more than 10 years and we are the only organisation to do this on a regular basis. As a research company, we survive off paid subscriptions; we are not obliged to share our data in the public domain and we receive no compensation for this service, including fielding media queries. We are also not supported by any political party or specific interests.
A full third of our press release on protests released last week contained (as they always do) a comprehensive outline of the methodology used to collect and analyse our protest data. We feel we make clear the source of the data as well as how we define protests, violence, and so forth. This aside, we spend a significant amount of time collecting, analysing and appraising this data and we don’t think it is unreasonable to restrict access to our base data to journalists or researchers.
As to the accuracy of the information in Municipal IQ’s Municipal Hotspots Monitor, which Davis questions, we are confident that this monitor accurately and objectively reflects the situation on the ground, using a consistent methodology over many years.
In essence, our Municipal Hotspots Monitor is an unbiased tool which uses definitions which, we feel, objective and reasonable people would agree with. Protests are defined as those staged by community members against a municipality (our specific area of focus), as recorded by the media or other public domain sources. Every single protest in our database has been entered manually, by a Municipal IQ analyst after reading a protest description, assessing the location of the protest to the ward level, and appraising whether the protest was violent or not.
We have 14 years of data and have been building our database on a weekly basis for more than 10 years. There is no extrapolation or use of other data. We spend time and effort using various electronic tools to search for and identify such protests.
While unwilling to accept our totals or methodological explanation, Davis quotes – and is happy to accept at face value – comments made by Carin Runciman, at the University of Johannesburg’s Centre for Social Change, to provide an alternative and definitive view on protests. Runciman states that her estimates on protests are at least double what ours are, that the media captures information on less than a quarter of protests, that smaller protests go unreported, as do protests without an element of violence or spectacle, and that there is bias to reporting in Gauteng and the Western Cape. But Runciman provides no evidence to back up these claims, and this goes uninterrogated by Davis.
Runciman quotes 2017 “SAPS records” as evidence that the media only covers a fraction of protests; presumably using SAPS “crowd-related incidents” data which she refers to and this seems to be the key source of Runciman’s views on protests, even though she herself recognises that this data lumps together every incident requiring the presence of public order policing. In fact, SAPS has made clear that the incident data (known as the Incident Registration Information System or IRIS) is not a reliable source of data on protests and indeed may well exclude information on a number of protests.
SAPS itself uses the data internally only as a broad source of information to inform policy and strategy on public order policing. The IRIS database is a vast and rough record of incidents. Runciman’s own research concluded that it contained 156,000 entries for 1997-2013 alone, divided into 27 unrest categorisations including incidents ranging from taxi disputes, demands for release of suspects, revenge, and mob justice, as well as 47 peaceful categorisations of crowd incidents as diverse as funerals, personality conflicts, and social events.
In a 2016 publication analysing protests using data from the IRIS database, Runciman again claimed a total number of protests hugely in excess of our figures. At the time, we had a closer look at her research in this publication and concluded that it was deeply flawed. She analysed 3% of the Iris database to identify protests from the morass of different incidents and then proceeded, on the basis of this unrepresentative sample, to draw conclusions on the number of protests in the country, including whether they were violent or not. She then claimed (using no empirical evidence that we could see) that figures for 2007-2009 were under-represented and so inflated her totals for those years.
These methodological issues aside, and accepting at face value Runciman’s unsubstantiated claims that protests are in excess of double our estimates, in her 2016 report she defines a protest as “a popular mobilisation in support of a collective grievance”, with popular mobilisation defined as “something more than … individual action”, which it seems includes any meeting (no matter how small) as long as a set of demands was articulated. Municipal IQ would certainly contest that a meeting of two or three people agreeing on a set of demands would constitute a protest, much less a protest representative of collective grievances. Defining meetings of a few people as protests would in and of itself explain why Runciman’s estimates put protests at more than double our figures – it’s surprising that they are not exponentially more!
Furthermore, implying that all protests are either popular or representative of collective grievances is questionable and, on the basis of an assessment of our 14 years of data, we would conclude, simply not true. A cursory objective glance at any number of protests covered in the media, would provide a clear indication that a significant number of protests represent key individual or unrepresentative group/political interests, notwithstanding our view that protests are a fundamentally important democratic exercise for communities to express grievances.
The position that all protests are somehow a popular mobilisation speaks to Runciman and her colleagues at the Centre for Social Change’s view of protests as a “rebellion of the poor”; a phrase often used by both Runciman and the centre. Our research shows that protests are often not carried out by the poorest citizens, but rather in those localities which are more organised. In addition, a significant number of protests occur in areas where communities perceive that they are relatively more deprived than their immediate neighbours or are not receiving the same level of access to services as their neighbours, irrespective of poverty levels.
Our stated definition of violence (from our press release) also seems inadequate for Davis, who questions our figures of violent protests. For us it seems logical that a peaceful protest is defined as one where protesters march through an area and then disperse peacefully, whereas a violent protest includes protests impinging on the freedom of movement or property of others, including the state.
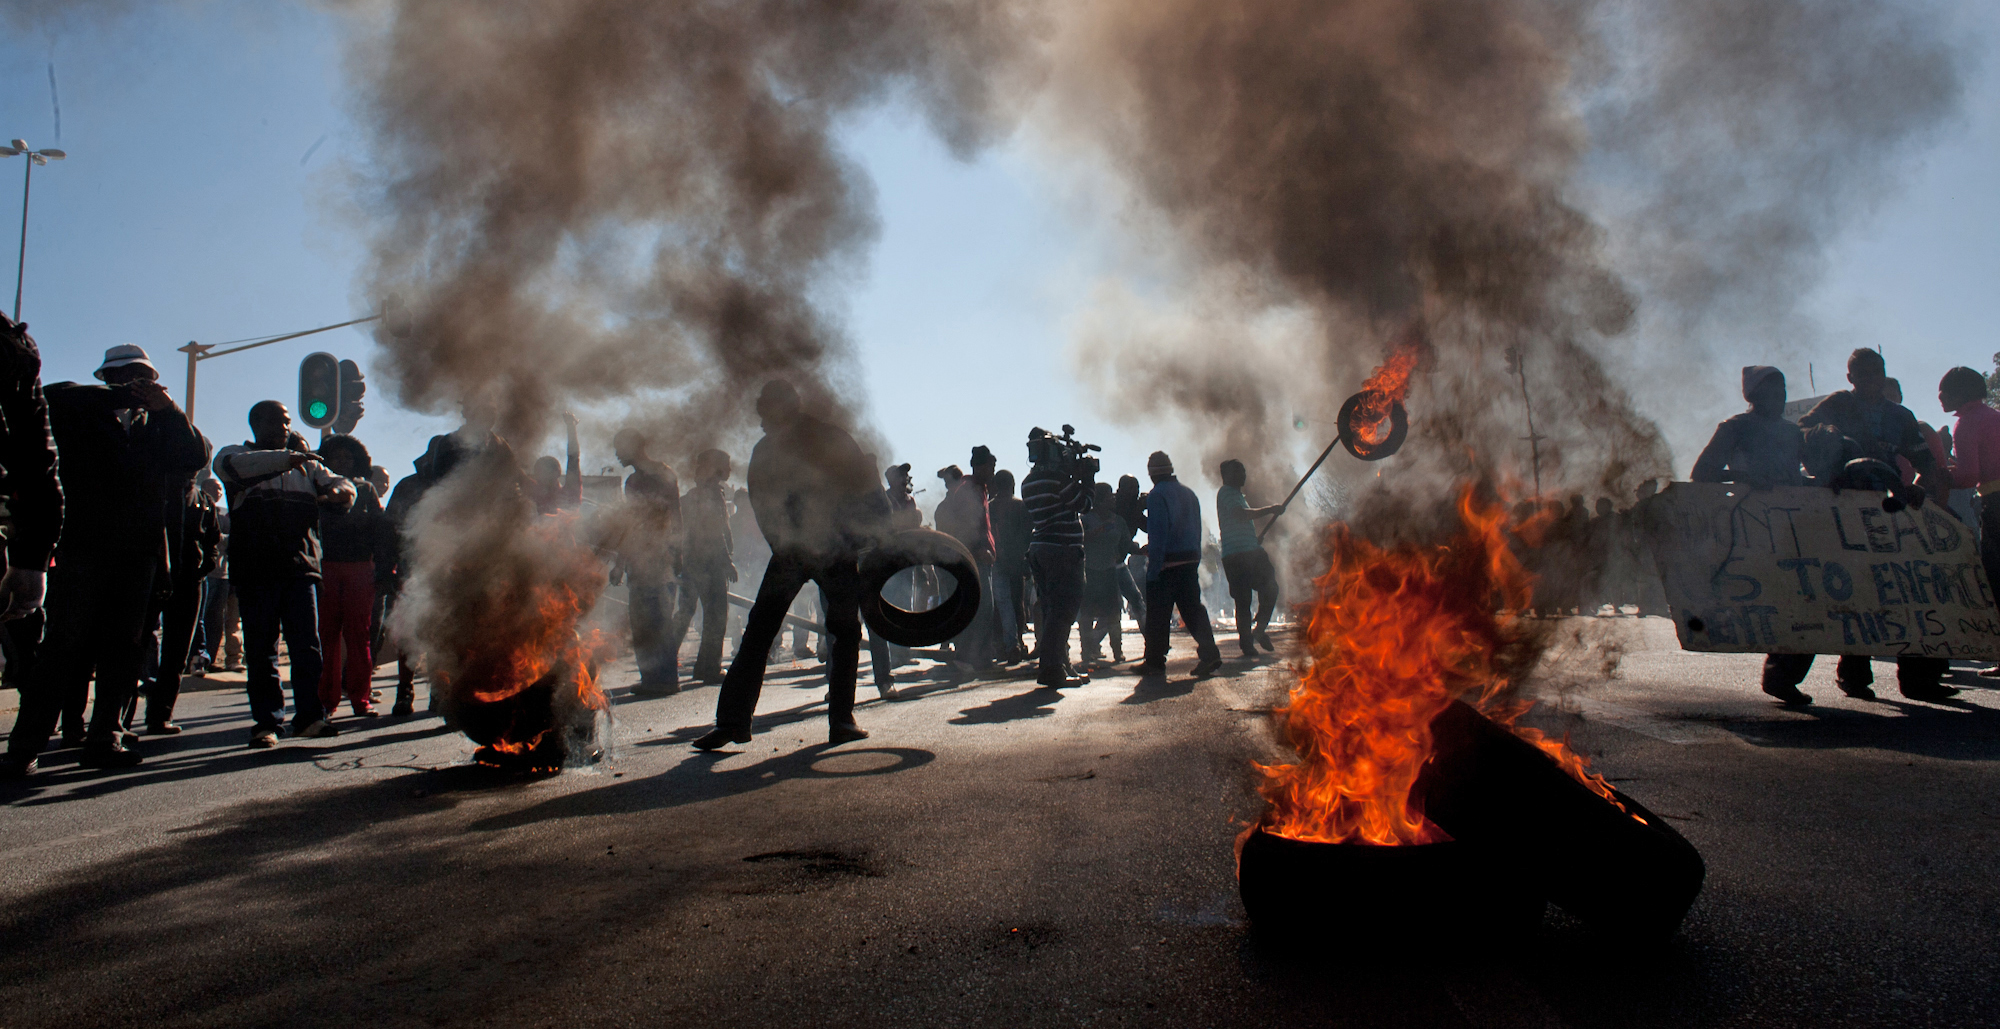
If a community blocks a road (often with burning tyres) and threatens cars or pedestrians who try to pass, the violence is clear. Again, we feel that very few objective observers facing an illegally blocked road, angry protesters, and burning tyres, would define this situation as non-violent, nor would they be willing to test the non-violent nature of such a situation by forcing their way through. We apply a violent/non-violent test to every protest we enter manually into our database, and for the most part reading a description of the protest makes it clear whether the protest is violent or not, and there is usually little to debate in a description stating that protesters threw stones (or more recently petrol bombs) at passing vehicles, or protesters set fire to a vehicle or a building.
We find Runciman’s claim presumably based on the SAPS incidence data, accepted uncritically by Davis, that the Centre’s 2017 data shows the number of violent protests has been stable since 2010, very much at odds with our annual trend data showing significant increases in violent protests, year on year from 2004 to 2018. Sasria (a state-owned special risk insurer) data on claims also supports our analysis.
Runciman, by contrast, defines protests as orderly, disorderly, and violent and states that “disrupting the social order” by, for instance, blocking a road (with stones or burning tyres), is not violent. But how is the illegal road closure enforced if not by violence, or the threat of violence? The danger to the public in such incidents is so clear that the standard police procedure is to immediately divert traffic away from such road blockages, with incidents of lethal car accidents, residents deprived of access to emergency services, and damage to public infrastructure all causes for concern. For us, there is little to debate here and we feel that any objective research would reach similar conclusions regarding increases in violent protests.
Runciman and the Centre for Social Change’s work is based on an ideologically framed position and questionable research to support the narrative that a “Rebellion of the Poor” is under way. Municipal IQ does not take any ideological position and observes service delivery protests as an unfolding phenomenon, with no axe to grind. Despite 14 years of data, released for over 10 years, with transparent definitions and consistent methodology, we take issue that Davis still sees fit to dismiss Municipal IQ data, but accepts at face value Runciman and the Centre for Social Change’s opinions and debatable conclusions on protests. DM