


The City of Cape Town recently claimed in a press release that 60% of Capetonians were not meeting the monthly target of 10,500 litres of water per household required to keep its taps running past April. However, analysis of the data on Cape Town’s Open Data Portal shows that Capetonians have cut water consumption dramatically. Its figure of 60% could be the result of a rounding error.
To analyse the data, we compared water usage in April 2017 to that in December 2017. We excluded suburbs without data, leaving us with a total of 550 suburbs, which includes a surprisingly symmetrical 566,566 households.
In April, the average household was using 13kl of water a month. Some suburbs – and you'd be right in guessing they’re at the top end of the market – were using 22kl. On the other end of the scale, Delft recorded a median of only four kilolitres per household per month, although such a surprisingly small number could call for further investigation.

Map: Cape Town suburbs using over 10kl per household per day in April 2017 are shown in red. Note that much of the lower consumption is on the Cape Flats.
Capetonians were asked in April 2017 to reduce consumption to 100 litres per person per day, and the sharp dip in usage is visible in the data. By May, median consumption drops from 13kl to 11kl, while the maximum consumption, which was sitting at 22, drops down to 15. There’s a significant drop of 18.9% usage between April and May. May to June, we drop another 10%, before levelling off with a 1% increase between June and July.
By December, we’re using a full 32% less water than April. And important, we’d dropped the median average down to 9kl. The worst suburbs are down to 12kl. Domestic users were asked to reduce their household consumption to 10.5kl by January. So it sounds as if Capetonians are winning. Which raises the question, where are the 60% using above the 10.5kl per household per month limit?

Map: Cape Town suburbs using over 10kl per household per day in December 2017 in red. Much of the Atlantic Seaboard, as well as Bishopscourt, remain above the 10kl mark.
If we look at the actual number of households up to and including 10 kilolitres of water a month, we find that the overwhelming majority – 505,766 – are compliant. That leaves just 12% using 11kl and up. However, if we adjust just slightly and count those on the 10kl mark in the data as being non-compliant, the result shifts dramatically. Suddenly we’re down to 362,751 compliant households versus 203,815 non-compliant or 56%, very close to what the City is telling us. (DA leader Mmusi Maimane put the number at 50% in his recent public speech on the water crisis.)
To unpack this and figure out who’s right, we need to look at the metadata. It states: “Median values are rounded”, which means that if a suburb’s median average was 9.5kl, it will have been rounded up to 10kl. If you count 10kl as being over, you include the 9.5kl users in that bag. Likewise, if a suburb is at 10.4kl, it will be rounded down, creating a problem when we’re using 10kl and below as the measure of a good citizen.

Map: Suburbs that managed to decrease water usage between April and December are shown in blue, while those that saw an increase – mostly on the impoverished Cape Flats, as well as the commercial hub of Westlake, are in red. Philippi, Gugulethu, Tafelsig and Nyanga saw a significant increase in usage.
The issue is really in the data. Most of the suburbs are hovering around the 10kl mark, and rounding instead of including a few decimal places makes it very hard to ascertain an exact figure. However, the shape of the data does tell us something. Looking at the percentiles, 9 and below are in the 69th percentile. In other words, if we have to chose between including or excluding the 10kl mark when counting mostly compliant suburbs, we’d be more accurate to include it.
We can also draw a distribution curve, and then measure the area under the curve above and below 10kl and 10.5kl. This gives us a pretty good idea as to how many people are using more water than they should. Only 20% of Cape Town’s households are using over 10kl per month, and when we shift the measure up to the City’s official target of 10.5kl, we find that only 12% of households are over.
Without more granular data it is difficult to gauge the true figure accurately, but the data indicates that 60% is an inflated claim. The true number is somewhere between 60% and 12%, and would be closer to 12%.

You can access the dataset and my calculations here.
The City responds
The City of Cape Town’s deputy mayor, Alderman Ian Neilson, responded to our investigation by stating that the City came to its figure by looking at individuals, with the target of 87 litres per day per person. The City assumed 3.2 people per household, which would set the target per household per month as 8,352 litres, not 10,000 litres.
“This then provided a relationship which we tracked, on the assumption that at 500 megalitres per day of demand, 100% of Capetonians would be using 87 litres of water,” says Neilson. “If you were to rerun your figures using the 8,352 litre benchmark, you would get a very different result. We have not found any major inaccuracies is our previous reporting, however we acknowledge that we do not have enough information to ensure this estimate is totally precise.”
Neilson says that the City will not be including the metric on the water dashboard going forward. “We cannot deny that water consumption per household has declined significantly, and we would like to congratulate all households that are saving water. We are encouraged that latest consumption figures indicate that this positive trend is likely to continue. However, we cannot escape the importance of more residents meeting the stringent savings targets required,” he says. DM
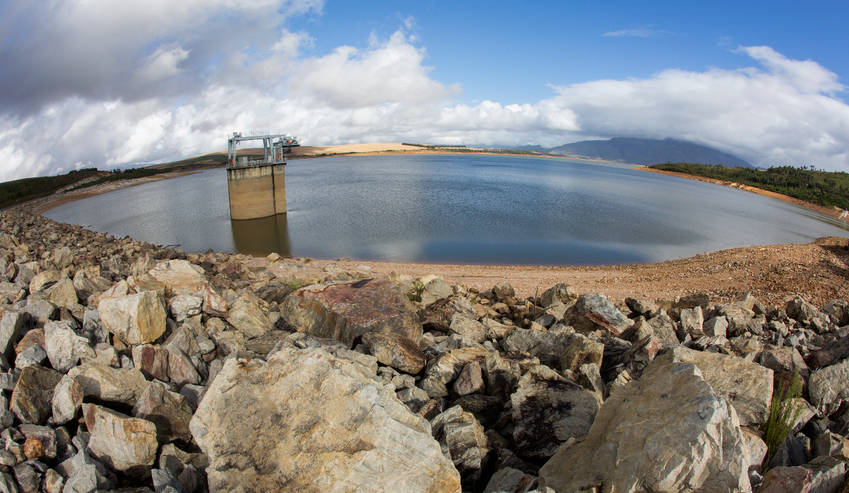
Photo: A general view of the critically low Theewaterskloof Dam in Villiersdorp, South Africa, 25 January 2017. Theewaterskloof Dam is the single biggest dam supplying water to the metropole of Cape Town. Photo: EPA/NIC BOTHMA
Comments
Scroll down to load comments...