South Africa
GroundUp: How severe is the drought? A detailed look at the data
Facts are few, opinions plenty, on the cause of the water crisis. By Piotr Wolski for GROUNDUP.
First published by GroundUp
The causes of Cape Town’s water crisis are hotly contested. There is a drought, of course. But there are also other reasons brought up in the public discourse, particularly on social media, such as population and water demand growth, unreported agricultural use, invasive species sucking out water in catchments, poor planning and mismanagement of the water supply system, and lack of foresight in development of new water sources. Are these significant contributors to the shortage? It’s very difficult to say without dedicated, comprehensive analysis. But facts are few, opinions plenty.
Few people question whether there is a drought: what is questioned is its severity. This has important implications. If the drought has been mild, then it should not have resulted in a major water crisis. If it has been severe, then it has just been a bad ticket on the climate lottery, and all the other factors would be at most aggravating factors, but not the main cause. The issue is obviously socially tense, creating wedges between authorities and citizens, between those who institute water restrictions and those who have to bear the brunt of them.
In this article I look at the most up-to-date rainfall data to assess how severe the current drought is. I have tried to answer that question before. But that article was based on very limited data, and was carried out well before 2017’s rainy season had finished. Now I have a more comprehensive dataset, which provides an opportunity to perform a more robust assessment.
There are a number of stations that measure rainfall in the vicinity of the Western Cape Water Supply System dams. Data for them are available from the Department of Water and Sanitation website.
Not all stations in this dataset have good records; there are numerous gaps. It appears that nine stations have data available for recent years, but four are located in the region of the Western Cape Water Supply System dams, and have no significant gaps or systematic errors from 1981 through 2017. Those stations are: Vogel Vallij, Zacharashoek, Theewaterskloof and Kogel Baai.

This is annual rainfall at these stations for 1981 to 2017:
.jpg)
Note that the year in the above figures is taken to be between November and October. This is because October is more or less the end of rainy season, and the last month when an increase in dam levels may be recorded. Also, because at the time of writing this, data is available only till October 2017. Putting the end of the year in October allows me to use the 2017 data without estimating rainfall in November and December.
To make further analysis more robust, instead of analysing data from individual stations, I calculated their simple average. And to account for the fact that the drought is probably of a multi-year character, I created plots showing two-, three- and four-year average rainfall:

These plots tell a consistent story: 2017, as well as the preceding two-, three- and four-year average rainfall in the region, are the lowest since 1981. What it means is that the 2017 drought was at least as rare as once in 36 years.
But looking at the last 36 years is not enough. We know that before that there were droughts in the 1920s and 1970s. We need to compare the current drought to the old ones. Can we go back further in time?
The Department of Water and Sanitation data do not span further back. But data from other sources do. The rainfall data from the South African Weather Service for some stations in the Western Cape go as far back as the late 1800s. Unfortunately, there isn’t any overlap between the Department of Water and Sanitation and South African Weather Service rain stations, so we cannot simply extend the record of the four stations used above. We need to repeat the analysis on the entire South African Weather Service dataset. If available South African Weather Service data is screened in a similar manner as the Department of Water and Sanitation data was (i.e. for continuity and consistency of record), we get five stations with data covering the period 1933 to 2017. Only three are located in the Western Cape Water Supply System dam region: Vrugbaar, Rustfontein and Nuweberg.

Similarly to the above analysis, I plot below the mean rainfall for the three stations:

The figures show that 2017 was the lowest rainfall year since 1933. They also show that the mean rainfall in the three preceding years, 2015-2017, was unprecedented. However, the two-year mean as well as the four-year mean leading to 2017 were not the driest.
We can even go back further in time to 1920, but then we can rely on one station only (Vrugbaar). This is how plots for this station look:

Again, the 2017 rainfall for that station, and importantly the mean of 3-years prior to 2017 were lower than in any period experienced by this station since 1920.
Interestingly, if you look at the long-term rainfall data for the stations located near the coast, the situation is slightly different:

Here, although relatively bad, 2017 was not – either alone or in combination with preceding years — the driest on record. But this is not the area where most of our water is supplied from.
So the long-term South African Weather Service data from the Western Cape Water Supply System dams region shows that 2017 and the period 2015 to 2017 were the driest since 1933. This translates into a drought return period of once in 84 years, possibly rarer. But how rare exactly? The statistical analysis I have done to calculate this is explained in my blog which will be published soon after this article. My findings are that this kind of drought occurs once in 311 years with a 90% confidence that it falls between 105 and 1,280 years.
This is pretty rare and actually in the same range as the earlier estimates.
Of course, one may question that result in many ways. Are the stations used representative? Perhaps if we had a different set of observations we would get a different result? Does it make sense to use the average of several stations in the analysis? Perhaps there are errors in data?
I think this dataset is robust. I have taken care in the preparation of the dataset to find continuous, long-term data. Using averages of several stations reduces the chance that data errors affect the result.
The drought, as manifested by rainfall in the region of Western Cape Water Supply System dams, is indeed very rare, and very severe. Importantly, the analyses reveal that the drought was probably less severe in the coastal plains and in Cape Town itself. A possible reason for that might be a weaker penetration of cold fronts that bring winter rainfall to the region into the higher and distant inland regions.
Before I conclude this story – one more figure to think about:

This figure shows a trend in rainfall in the Western Cape Water Supply System region over the last 84 years. That trend is towards lower rainfall and it has a relatively strong magnitude – 17mm per 10 years. It is barely statistically significant, though. The important thing is that this trend may be an expression of human-caused climate change, and may be affecting the magnitude of droughts. Simply, if that trend were not there, the 2017 drought would probably be less severe.
In summary – the analyses presented above, based on the best rainfall data available at this time, show that the drought, manifested through low rainfall in 2015 to 2017, was very rare and severe. DM
Acknowledgements to SAWS and DWS for data, and Chris Jack and Stefaan Conradie (both CSAG/UCT) for valuable discussions.
A more detailed version of this analysis will be available shortly after publication on GroundUp.
Editor’s summary
- Piotr Wolski, a water scientist at UCT, has used the latest rainfall and best available weather station data to compare the current drought to past ones.
- The data shows that the drought over the water catchment area is the worst on record over one- and three-year periods. Rainfall in 2017 was especially poor.
- This kind of drought is expected once in 300 years (90% confidence interval: 105 to 1,280 years).
- The drought in the city itself is severe, but not the worst on record. Very little of Cape Town’s water is sourced from in the city itself.
- There is a trend towards lower rainfall over the past 84 years in the catchment area. This may be due to human-caused climate change.
Dr Wolski is a researcher with UCT’s Climate System Analysis Group.
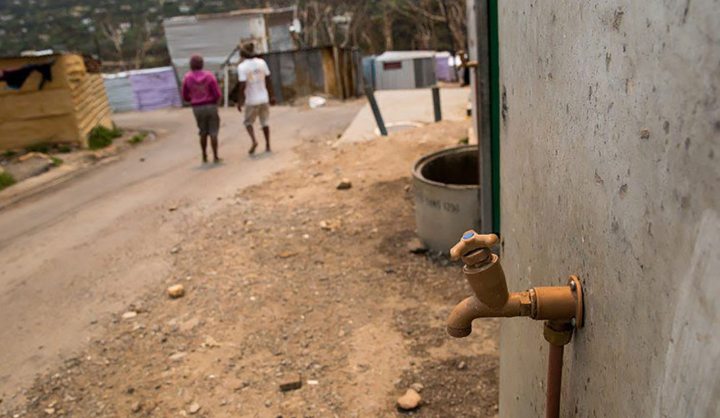
Photo: A tap inside the Imizamo Yethu informal settlement in Hout Bay. Photo: Ashraf Hendricks