


On 24 October the crime statistics for 2016/2017 were released nearly a month late. In this short article only national crime statistics will be discussed at this stage. A more detailed report on provincial crime statistics will follow a few days later. The following should also be made clear to the reader:
- The focus will exclusively be on more policeable crime. That is, the categories of crime which should be influenced by police action like the back-to-basics approach. It is crime where all three functions of the police – crime prevention, detection and crime intelligence – should impact on a crime category. If not, the relevant police service, in this case SAPS, should go back to the drawing board.
- Some crimes, such as sexual offences (including rape) and assault (both GBH and common), are very social in nature and usually originate in an argument about money, relationships, family matters, sexual matters, liquor/drugs etc. and occur mostly in private spaces where the police are not usually present. So it is difficult to impossible for a police service to do full crime prevention, detection and intelligence. These crimes are also very much influenced by reporting and under-reporting behaviour and by a slow but sure change in lifestyle. They are just included to show that they can, because of the numbers, be used to hide the more policeable crimes.
Other crimes, like the single largest category of crime – “all theft not mentioned elsewhere” – is a total mixed bag of crimes which include anything from the theft of an old perished garden hose, a R50 note which was left on the bedside table, or three kilometres of copper cable which was stolen and left Johannesburg without power for three days thanks to the resultant power failure that cost millions of rand. So although it includes very important crimes like cable theft – by far the most policeable – the majority of it is of small, less important items which may not even have been stolen. So it is unclear which subcategory of “theft other” decreased if the “all theft not mentioned elsewhere” category decreased as it indeed did during 2016/2017 by 3.6%. Hence, this category is not included.
Shoplifting and commercial crime are mostly reported to SAPS after these crimes were identified and investigated by the private companies that are the victims of these crimes.
Murder and attempted murder are both included in the two tables in this article although both categories are a mix of different kinds of murders of which some are more policeable (murder during robbery and the vigilante reaction to it) and others less policeable (e.g. domestic murders, and femicide). Analysis by SAPS in the 2015/2016 Annual Crime Report p.14 clearly indicates that at least 40% of murders today are more policeable. Therefore these two very important categories are included in this article.
Good, bad and no news
TABLE 1
Increases (red), decreases (green) and stabilisations (blue) of more policeable crimes in 2016/2017

In table 1 the increases (depicted with red in the last column), decreases (depicted in green in the last column) and stabilisations (depicted in blue) of nine categories of more policeable crime, seven sub-categories of aggravated robbery, and three categories of less policeable crime are provided. From this table the following can be deducted:
- The SAPS can actually only claim three small successes, namely a -1.6% decrease in residential burglary, and a -1.3% decrease in common robbery. These marginal decreases may also at least be partly as a result of an increase in victims of these crimes who believe that it will make no difference to report these crimes to the police. Furthermore, several people, known to this analyst, reported attempted housebreaking to the police (a lock had been tampered with, an electric alarm fence cut etc.) but these are then registered as malicious damage to property instead of residential burglary.
- The decreases of 6.7%, 5.2% and 4.3% in assault GBH, common assault and sexual offences respectively cannot be claimed by the police since these are less policeable crimes which are also highly influenced by reporting behaviour.
- The increases coloured red in the last column are particularly worrying since these are not once-off increases only in 2016/2017. So, for example, carjacking, street/public robbery, house robbery and business robbery increased with 77.5%, 38.6%, 33.3% and 30% respectively.
- Nowhere in the tables on the police website (www.saps.gov.za) was provision made for street/public robbery and it was also, as far as this analyst could establish, not mentioned in the briefing. This despite the fact that the SAPS’ own analysis in the past indicated that this subcategory of aggravated robbery is in all probability the second largest generator of murder and attempted murder. The events in Nyanga and the Marikana settlement in Philippi East during the week of 24 to 30 September were in all probability generated by vigilante reaction to street robberies and revenge attacks on vigilantes. One can’t believe that the SAPS closed their eyes to this scourge of the poor workers who use public transport from informal settlements to CBDs on a daily basis.
TABLE 2
A comparison between the annual average increases/ decreases for different periods of policing: Did the Back to Basics strategy work?

If Table 1 is scrutinised it is already clear that the Back to Basics Approach which has now been followed for a year did not start to turn the more policeable serious crime around.
In Table 2 the 2016/2017 year is compared with three distinct periods of policing:
- The Selebi period (2003/2004 to 2008/2009);
- The Cele period (2009/2010 to 2011/2012), and
- The Phiyega period (2012/2013 to 2015/2016).
These three periods represent three very distinct styles of leadership and strategies in the SAPS. The use and operationalisation of intelligence in SAPS also differed quite substantially. The percentages under each period are average annual decreases or increases.
From the table it is quite clear that during the Selebi period the police struggled with some of the sub trends of robbery aggravated (marked with light brown), but achieved systematic reductions in most of the other crimes (marked green).
During the Cele period, only theft out of and from motor vehicles and business robbery could not be reduced.
The Phiyega period was a disaster and crimes with the exception of a few were on the increase. Towards the end of that period a new approach to policing was implemented called the Back to Basics Approach. There were very high hopes that it would start to reduce crime significantly. This did not happen even after a full six months of implementation and piloting at the end of the Phiyega period and after a full year (2016/2017) of implementation by police generals. The only turnaround is small decreases in common robbery and residential housebreaking.
Clearly this approach will have to be revisited and taken back to the drawing board. DM
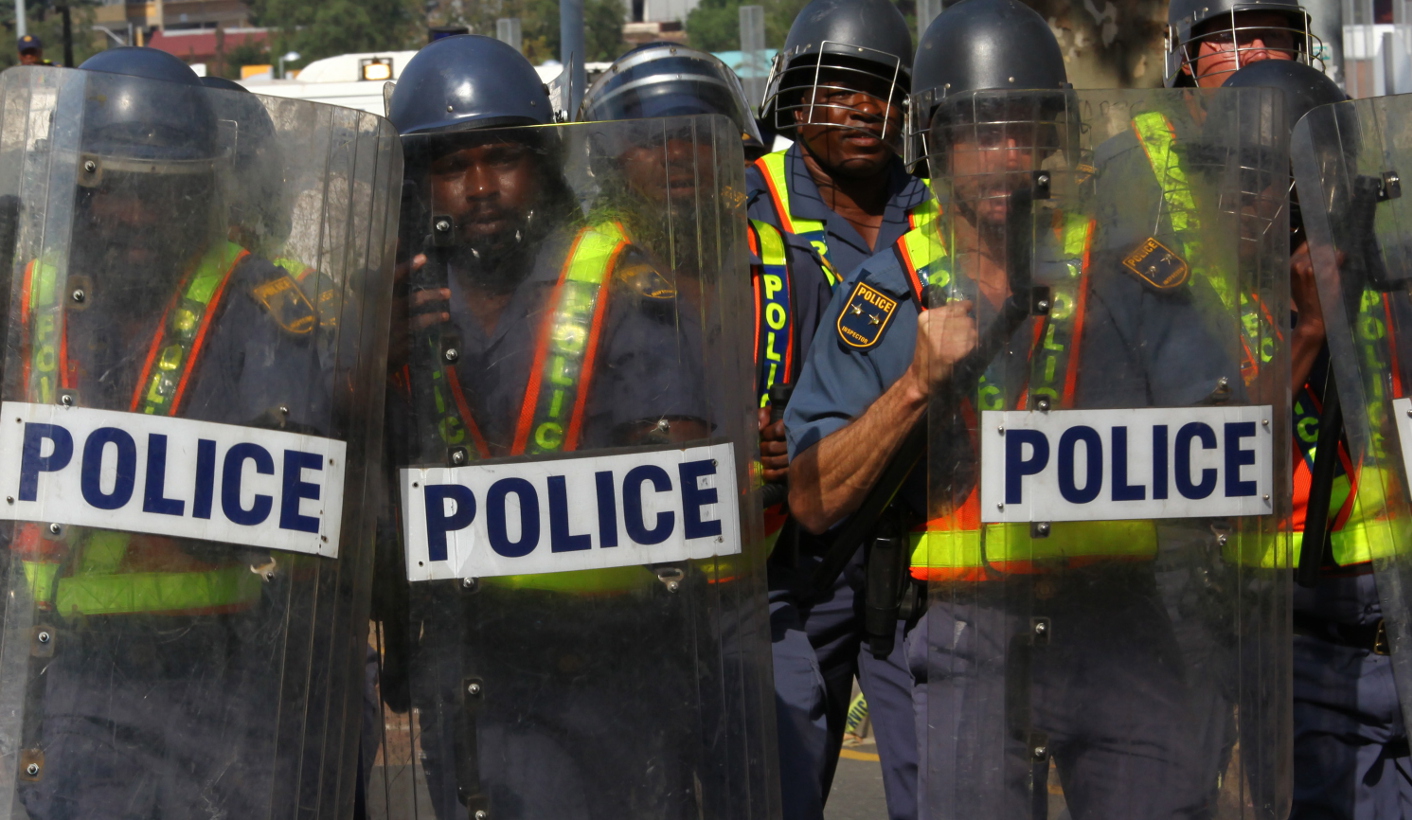
Photo: Members of the South African Police Services (SAPS) practise crowd control during an exercise outside Ellis Park Stadium in preparation for the upcoming FIFA 2010 Soccer World Cup, Johannesburg, 15 April 2010. Photo: EPA/KIM LUDBROOK
Comments
Scroll down to load comments...