


While heading the Crime Information Analysis Centre (CIAC) of SAPS from 1995 to 2012 and being, inter alia, responsible for all crime statistics briefings in SAPS and to other departments and structures of government and the releases of the crime statistics to the public, I always believed that crime statistics were one of the most powerful tools in the fight against crime and that the statistics as such should never be spun or massaged in any way.
They should be presented to power and the public as objectively as possible. Crime statistics can be explained and contextualised through analysis, but increasing crime trends should never be presented to anybody in such a way that the receiver may start to feel that “this crime is really not that bad at all”. It should be about the fight against crime and not a fight against crime statistics.
During his last nine months before retirement in April 2013, which coincided with the arrival of National Commissioner Riah Phiyega in June 2012, it was very clear that the fight against crime had changed to a fight against crime statistics. In the last four-and-a-half years this fight against crime statistics continued despite the fact that General Phiyega was already suspended two years ago in October 2015 and the SAPS were under various acting National Commissioners from police ranks.
One of the probable explanations for the fact that more “policeable” crime like street/public robbery, car-jacking and murder increased with respectively 32.0%, 55.1%, and 20.1 % since 2011/2012, and is in all probability still increasing, is the success with which the SAPS could convince the decision-makers, and at least part of the public, that as General Phiyega likes to put it: “It (crime) is still going south.” By using very broad groupings of more and less policeable crime categories mixed together, as indicators of police performance, they could even convince the Portfolio Committee on Police that they are in control and that South Africa is not moving into a crime crisis. So there was not near to the same degree of pressure to reduce the more policeable crime than during the period 2004/2005 to 2011/2012 when street/public robbery, carjacking and murder decreased with respectively 45.5%, 31.7% and 21.5%. On at least these three trends the gains made over eight years were destroyed in four to five years.
The top of the tip of the iceberg
Over the last couple of years the SAPS have used smaller and smaller top sections of the vertical axis of line graphs and histograms. Strictly speaking, if the analyst really wants to provide a true picture of the reality he/she should provide the full vertical axis from zero to just above the top value, but it has became common business practice to only provide say the top third or half of the values on the vertical axis so that the line or histogram shows a clearer upward or downward trend.
In the presentation of the trimester data, slide 19 on murder is a good example of this suspicious method. The histogram for trimester murder figures only covers the top 0.2% of the vertical axis and in the process it looks as if murders decreased to such an extent that there will soon be no murders at all. But in the meantime murders dropped with only 10 counts in the period of nine months. Just in the week immediately after the trimester crime statistics’ release, 14 illegal mineworkers (so-called Zama-Zamas) were killed on the East Rand. This would have wiped out the gain of 10 within a few hours.
In table 1, a comparison of the percentage coverage of the vertical axis in the trimester presentation and the addendum to the SAPS Annual Report of 2015/2016 is done. One can only make the deduction that the presentation was either not compiled by the same compilers and/ or that if it was compiled by the same compilers, the purpose of the presentation was to impress the audience with the visual decreases in crime trends, while that of the report was to present a more scientific image of the crime. The 2015/2016 crime report shows on the average 7.6 times more of the vertical axis then the trimester presentation.
TABLE 1: A comparison of the percentage coverage of the vertical axis in the Trimester presentation and the addendum to the SAPS annual report 2015/2016:
| CRIME | TRIMESTER PRESENTATION Percentage of vertical axis covered. | ADDENDUM TO THE SAPS ANNUAL REPORT 2015/2016 Percentage of vertical axis covered. |
| Murder | 0.2 | 23.1 |
| Attempted murder | 1.3 | 38.1 |
| Sexual Offences | 11.1 | 40.5 |
| Assault GBH | 10.1 | 18.2 |
| Common Assault | 6.5 | 28.6 |
| Common robbery | 1.2 | 50.0 |
| Aggravated robbery | 9.3 | 32.1 |
| Burglary at non-residential premises | 2.1 | 31.3 |
| Burglary at residential premises | 1.0 | 15.1 |
| Theft of motor vehicle | 1.5 | 44.4 |
| Theft out of and from motor vehicle | 0.9 | 33.3 |
| Stock-theft | 3.7 | 20.0 |
Mountains made out of molehills?
Table 2 provides the percentage “decreases” which were marginal and which are indicated in the 2016 Trimester Presentation (slides/pages 11, 12, and 13) as green decreases. The CIAC (Crime Information Analysis Centre) always used three colours to indicate different trends in their crime tables. Where there was an increase of 1.0% and more in a period, that trend would have been highlighted with a red colour. Decreases of 1.0% and more were highlighted with green and if the decrease or increase was 0.9% and smaller it was highlighted in blue. The blue was seen as stabilisation. Where the trend is not yet clearly increasing or decreasing it needed some policing work to take it in the desired direction. Blue after periods of green also indicate that the relevant role-players should do something or it may turn to red. The use of these colours had the effect in operational and other management meetings of all levels of SAPS, meetings with other government stakeholders and public meetings and b-riefings that the attention was immediately on the reds and the blues – it focused attention where it should be. When one scrutinises the tables on slides 11, 12, and 13 of the Trimester Presentation one actually discovers that seven trends coloured green should have been coloured blue and which still needed much more operational attention.
TABLE 2: Marginal decreases which should have been coloured blue in the 2016 Trimester Report (slides 11, 12, and 13).
| Murder | -0.1% | -10 |
| Attempted murder | -0.8% | -108 |
| Common robbery | -0.7% | -275 |
| Burglary Residential | -0.6% | -1 087 |
| Theft of motor vehicle | -0.8% | -330 |
| Theft out of/from motor vehicle | -0.6% | -592 |
| Sexual assault | 0.0% | -2 |
The fear of ‘the devil is in the details’
There is an old English saying that “the devil is in the details” and it seems that since the crime statistics’ release of 2012 the fear of this became dominant in all crime statistics releases of the SAPS. Most of the time and space spent during any of the releases is on broad groupings of crime categories which were never grouped together with any crime combating objective. The categories used in the groupings should have been disaggregated down to more operational, usable subcategories (see: 4 July 2017, Daily Maverick. At least in the SAPS Annual Crime Report 2015/2016: Addendum to the SAPS Annual Report, which was compiled by the Crime Registrar but only released weeks after the crime release event in September, the emphasis was on the detail, although for unknown reasons at least one of the most important subcategories of aggravated robbery were ignored. Street/public robbery and the vigilante reaction to it in all probability is the key to the understanding of the increase in murders like those of the week of 26 September to 1 October 2017 in Nyanga and neighbouring Marikana in Philippi East.
Then came the trimester crime statistics’ release in March 2017 and the emphasis was back on the broad categories such as contact crime, contact-related crime, property-related crime and crime detected as a result of police action.
In all probability the reason for the emphasis on the broad groupings of categories of crime and the evasion of detail (which is anti-analysis behaviour) is to distract the public attention away from the facts that since 2012 the SAPS had made no major progress in crime reduction.
Table 3, which is fully based on the trimester crime statistics, clearly support the statement in the previous sentence. Contact crime decreased with 1.9% in the first trimester (April-December) of 2016/2017. But contact crime consists of two subtypes, namely less policeable social contact crime which include assaults and sexual offences and made up 61.8% of all contact crimes, and more policeable contact crime which only made up 38.2% of all contact crime.
TABLE 3: A comparison of the Trimester crime statistics (April to December, 2015 and 2016) for contact crime categories and subcategories of aggravated robbery.
| Contact crime | 2015 trimester | 2016 trimester | Count difference | Percentage difference |
| Murder | 14 343 | 14 333 | -10 | -0.1 |
| Attempted murder | 13 806 | 13 698 | -108 | -0.8 |
| Common robbery | 41 247 | 40 972 | -275 | -0.7 |
| Aggravated robbery | 101 252 | 107 445 | 6 193 | 6.1 |
| Street/public robbery | 59 208 | 61 933 | 2 725 | 4.6 |
| Carjacking | 11 086 | 12 743 | 1 657 | 14.9 |
| House robbery | 16 003 | 16 844 | 841 | 5.3 |
| Business robbery | 14 955 | 15 925 | 970 | 6.5 |
| Truck hijacking | -- | -- | -- | -- |
| Cash-in-Transit robbery | -- | -- | -- | -- |
| Bank robbery | -- | -- | -- | -- |
| More policeable contact crime | 170 648 | 176 448 | 5 800 | 3.4 |
| Assault GBH | 137 200 | 129 454 | -7 746 | -5.6 |
| Common assault | 122 351 | 117 811 | -4 540 | -3.7 |
| Sexual offences | 40 143 | 37 630 | -2 513 | -6.3 |
| LESS POLICEABLE SOCIAL CONTACT CRIME | 299 694 | 284 895 | -14 799 | -4.9 |
| TOTAL CONTACT CRIME | 470 342 | 461 343 | -8 999 | -1.9 |
The SAPS did not disaggregate it like this in the Trimester Presentation because then they would have to admit that the more policeable contact crime actually increased with 3.4% and the less policeable social contact crimes decreased by 4.9%. So the 1.9% decrease in contact crime is fully due to the 4.9% decrease in social contact crime. In short, the 6,193 cases of increases were: street/public robbery (2,725), carjacking (1,657), house robbery (841) and business robbery (970), which should have been the police’s reduction target, are hidden behind the decrease of 14,799 less policeable social contact crimes like assault with GBH, common assault and sexual offences which may have very well decreased as an result of under-reporting to the SAPS, or the community changing their social behaviour.
This analyst wants to emphasise that in the years 2004/2005 to 2011/2012 where the SAPS were kept accountable for first a 7-10% decrease per annum per contact crime category and later to a 4-7% decrease in contact crime, but with a specific target for TRIO crimes (car-jacking, house robbery and business robbery), significant reduction of more policeable contact crimes were achieved. Since 2011/2012 no decreases were achieved in more policeable crimes because they now have such a broad target (serious crime) that they can hide behind less policeable crime categories; there is no pressure on the police to perform, and they are not kept accountable. DM
Chris De Kock is an analyst: crime, violence and crowd behaviour.
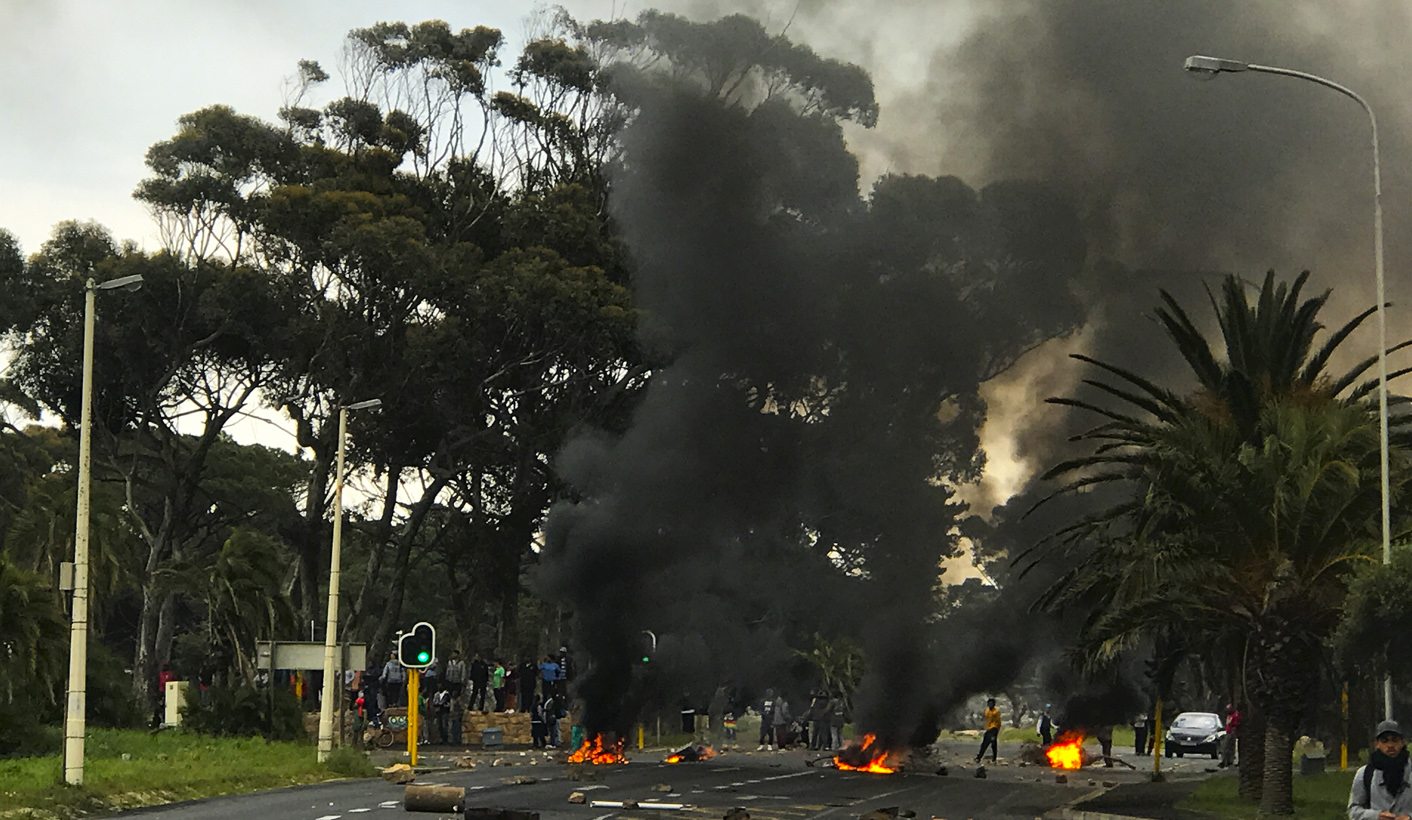
Photo: Residents of Ocean View burn tyres and blockade the Kommetjie road in protest against the lack of policing in their area in Cape Town, South Africa, 21 September 2017. Ocean View has been plagued by gang violence. Recently Aqeel Davids, 9, was killed in suspected gang crossfire. Residents claim the police and the ward councellors responsible for the area are not doing enough to combat the problem whilst innocent residents are being killed. EPA-EFE/NIC BOTHMA