


Almost four in 10 (37.6%) households in the Eastern Cape rely on grants as their main income, as does one in three households in Limpopo (33.2%), and 32.1% in the Northern Cape. Social grants account for about a quarter of household incomes in KwaZulu-Natal (28%), North West (25%), the Free State (24%) and Mpumalanga (23%). In all these provinces, remittances, like the money migrant workers send back home, contribute about 10% or more of household income: 14% of Limpopo households declared remittances as their main income.
Stats SA says a specific household could have more than one source of income, and its 2015 General Household Survey shows the relationship of importance between salaries and grants: nationally, 58% of households reported salaries or wages as the main source of income, followed by grants (21.7%), other sources (9.6%) and remittances (7.9%).
But the devil is in the detail -- and that’s in the significant provincial variations and deep rural-urban divides.
Only in Gauteng and the Western Cape do salaries contribute the majority of household income -- 75% and 76.8% respectively -- with grants being the main source of income for 10% and 12% of households respectively. Johannesburg, Cape Town and Tshwane were the only three metros were 71% of households reported salaries as their main source of income. In comparison 27.6% of households in Nelson Mandela Bay Metro listed grants as their main source of income.
Breaking down these statistics into the actual numbers of individual grant beneficiaries, it emerges that almost one in three South Africans, or 30.1%, rely on one grant or another, and have done so since 2009. And grant reliance is racially-skewed: one in three black Africans depend on a grant, compared to 27% of coloureds, 12% of Indian and just 6.3% of whites.
In 2015 the highest number of grant beneficiaries were in the Eastern Cape (40,3%), Limpopo (38.2%), Northern Cape (36.9%) and KwaZulu-Natal (36.8%). In comparison, just 17.5% of Gauteng residents and 22% of Western Cape residents were grant beneficiaries.
Stats SA cautions that grant beneficiaries had to have actively applied to receive these (many social grants set a means test) rather than being identified by government as needing grants. This year’s R1.4-trillion budget has set aside R140-billion for various grants:
- the R1,525 disability grant,
- R860 foster care grant,
- R1,505 care dependency grant
- the state old-age grant of R1,505,
- R1,525 for the over 75s and
- the R350 child care grant up to the age of 18.
The high reliance on grants, particularly in the so-called rural provinces of Eastern Cape, Limpopo and KwaZulu-Natal, paints a stark picture of lack of citizens’ economic activity, be it due to a general lack of jobs, lack of resources to access job opportunities that could be some distance away, or inadequate educational qualifications.
On the educational front, the impact of no-fees schools becomes clear as the enrolment of five-year-olds skyrocketed from 2007. However, no money for school remains the main reason in 2015 why youngsters are not at school, even if it has dropped slightly in prevalence. For young women, family commitments are the third leading reason for not attending school after poor academic performance, while young men cite “education is useless” as the third most prevalent reason, after poor academic performance.
In one of the curious findings, the survey showed that despite the ban on corporal punishment in schools, 11.3% of pupils countrywide still find themselves at the receiving end of such. Corporal punishment happened more often in rural areas and cities, and most often in KwaZulu-Natal (20.2%), the Eastern Cape (16.7%), North West (13.6%), Free State (12.5%) and Limpopo (10.5%). In comparison, only 1.7% of pupils in the Western Cape experienced corporal punishment in 2015, and 2.7% of Gauteng pupils.
The 2015 General Household Survey showed textbooks at schools remains a challenge. In the first quarter of 2015, only 74.9% of pupils had all textbooks, although that rose to 81.1% in the forth quarter that year.
It is at tertiary level that educational matters take a decidedly racial twist against black African students. While 15.7% of whites are enrolled in institutions of higher learning, and 14.3% of Indians, only 3.1% of coloureds and 3.1% of black Africans are. These enrolment figures have not significantly increased over the past 15 years except for Indians: in 2001, 15.6% of whites were enrolled in tertiary education institutions, as were 2.8% of black Africans.
While in absolute numbers black African enrolment has increased -- and at 312,910 is almost three times higher than white enrolment -- the levels have not increased in proportion to the overall black African population, the largest in South Africa. And overall, successful bachelor degree completion rates by black African, and coloured students, have plummeted since the mid-1990, while white students increasingly completed degrees.
When these statistics were released a couple of months ago as part of Stats SA’s “The Social Profile of Youth, 2009-2014”, it sparked criticism by some education experts and academics. But on Thursday Statistician-General Pali Lehohla maintained it could not be about absolute numbers, but must be about proportions of black African students vis-a-vis the overall number of black African citizens.
If the argument about improved numbers advanced by critics were to hold true, Lehohla argued, then there should be 5.5-million black African students, and 200,000 black African graduates every year, given the population size. But this was not happening, and in the absence of appropriate police interventions, South Africa was losing out on the benefits of a young, largely black African population.
Known as the demographic dividend, it is the economic growth potential when a country’s working age population, including skilled and educated workers, is larger than those not working, or those younger than 14 and older than 64.
“While the absolute numbers are up, the number of those actually achieving is dropping… That is a big policy question,” said Lehohla. “This is tragic… This cannot be a demographic dividend despite a demographic transition.” DM
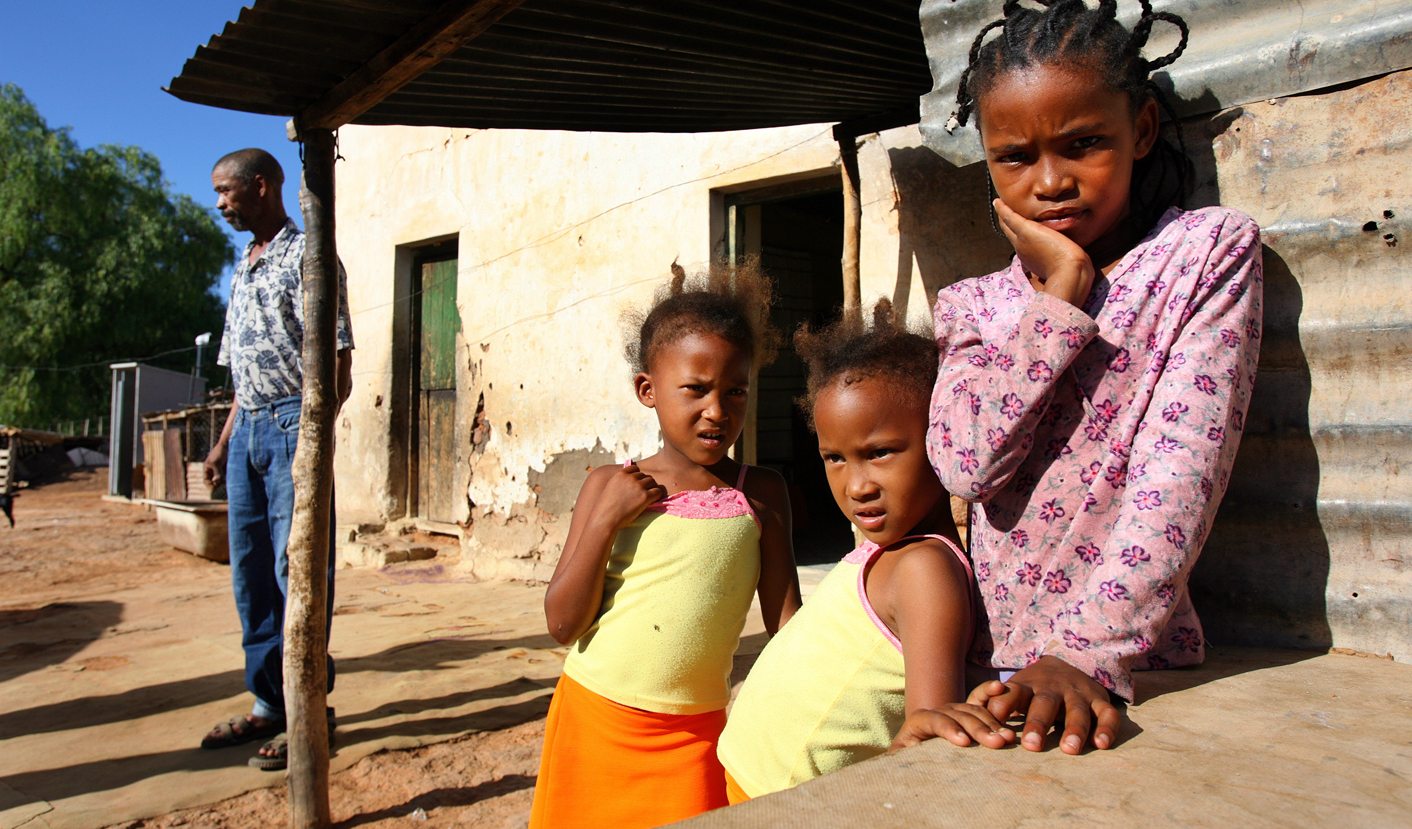
Photo: A picture dated 31 March 2007 shows the Coerecius family outside an unserviced house on a farm in the Oudtshoorn district of South Africa's Western Cape Province. EPA/JON HRUSA