


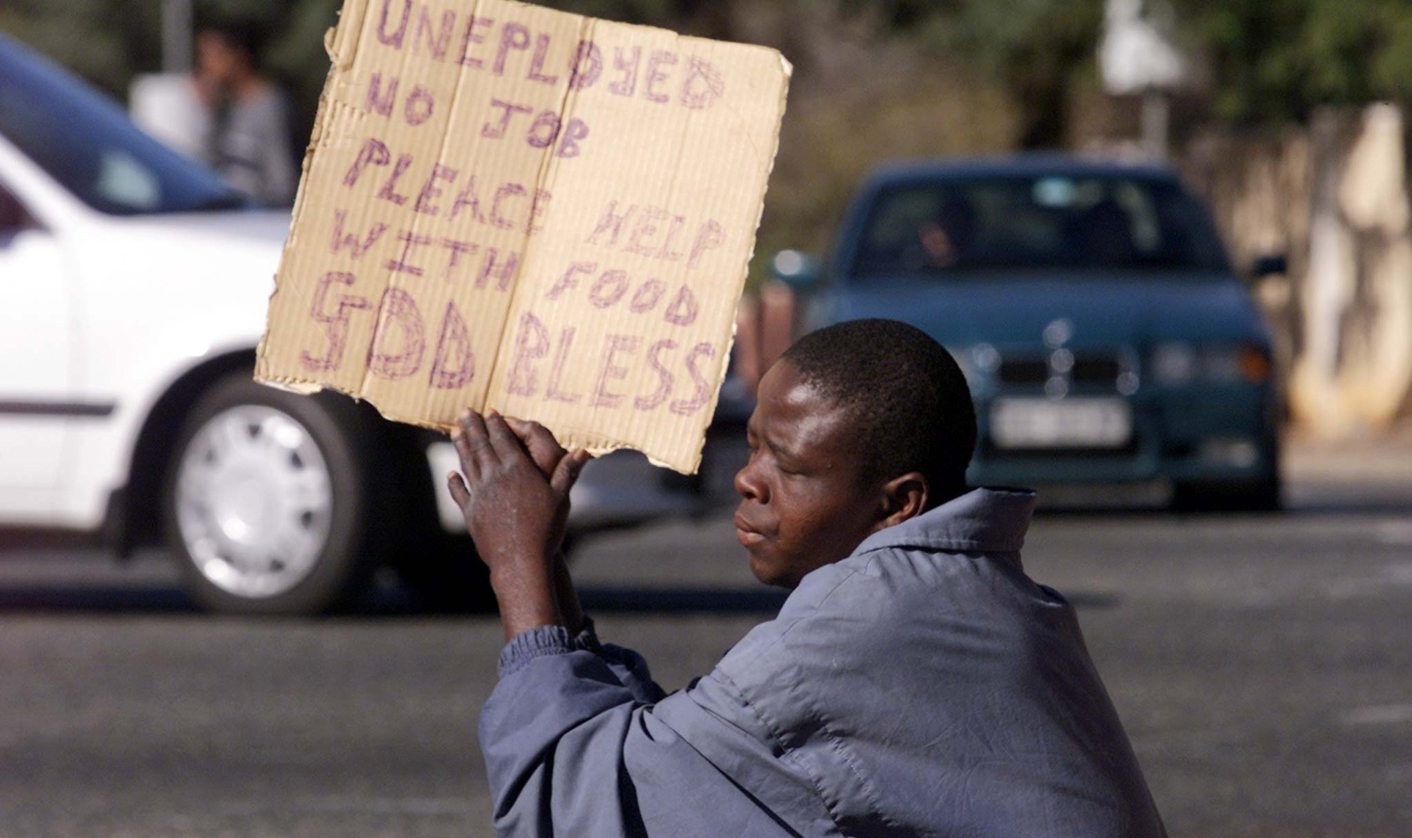
 An unemployed black South African pleads for money or food at a Johannesburg street corner July 21. Leaders at the Group of Eight industrialised nations meeting in Okinawa admitted on Friday they must breathe life into a stalled initiative to reduce the debts of the world's poorest countries. But they refused to ease the strict conditions linked to debt relief.
 The headline figures look good in the LFS release for Q4 2012. Unemployment (narrowly defined) fell from 25.5% in the previous quarter to 24.9%, while the broad rate of unemployment fell from 36.3% to 35.9%.

The underlying patterns in the numbers aren’t that positive – or, to be precise, the lack of a positive pattern in the numbers is cause for concern. Since 2008 there has been a strong seasonal factor in the narrow unemployment rate; in the final quarter of every year (except for 2009) there has been a sharp drop in the rate. The drop in the final quarter of 2012 is far smaller.
There are two seasonal effects that combine for a flattering fall in the unemployment rate in the final months of the year. One is the growth in employment numbers (which tend to drop off in the first quarter of the following year). The other is a fall in the size of the labour force (also partially reversed in the months that follow).
In 2012 there was a large fall in the labour force between the third and fourth quarters of the year, of some 225,000 people. They appear not to have joined the discouraged workers but are categorised under ‘other not economically active’. It may be a story of seasonal migration, where many urban dwellers return to rural homes to engage in ‘economically inactive’ activities until the new year.
This shrinking of the workforce was largely offset by the fall in the actual number of employed people, compared with the previous quarter. The only other fourth quarter that saw a fall in employment numbers was in 2009. Most of the decrease was in the trade and transport sectors.
The number of unemployed people fell compared with the previous quarter (as a result of the two abovementioned trends) but the number of discouraged work-seekers rose from the previous quarter:

The number of discouraged work-seekers has been rising in a steady trend since 2009. The graph below shows the sum of unemployed and discouraged work-seekers. This number has increased steadily since 2009 and appears to have stabilised over the last year, ranged between 6.6 million and 6.9 million.

The number of discouraged work-seekers was just over a million people in 2008, before the economic slowdown. It has been above 2.2 million people since 2011. The number of unemployed people has averaged around 4.5 million in 2012. Of these, more than 3 million people have been unemployed for more than a year.
The numbers rise and fall due to seasonal factors and people move between the unemployed, employed and discouraged groups over their lifetime. We don’t know exactly what proportion of the unemployed manage to find work eventually, but it’s believed to be quite small. If we took a rough estimate of the size of this group of the discouraged and the long-term unemployed, we could come up with an even 5 million people.
This is a number that can focus the mind. The people in this group have the following in common: they haven’t enjoyed much employment in the past few years and they probably have less chance of being employed in the future unless there is a serious change to the status quo.
The ANC has made some bold statements in the first few weeks of the year. Policy-makers in the party are signalling their intent to implement the youth wage subsidy and to put flesh on the bones of the NPC. The fallout from the platinum and farming sectors, labour-wise, is yet to be seen in the numbers but will only make them look worse for the next couple of quarters. There doesn’t seem to be any upside at the moment. DM
Photo: An unemployed black South African pleads for money or food at a Johannesburg street corner July 21, 2000. (Reuters)