


On Tuesday, StatsSA released an annual review of the labour market based on the Quarterly Labour Force Surveys (QLFS) it conducts. Entitled Labour market dynamics in 2011 it is a detailed look at trends in the labour market over the last six years.
The review looks at employment data on an annual level, which strips out all the bumpy seasonal effects found in the QLFS releases. We’ve commented on the fluctuations in the quarterly reports before and the graphs of the annual figures are a different picture, literally. In contrast to the quarterly undulations, the annual picture of employment is placid and flat. It does mean that some of the detail is lost; the annual data show the economic and employment downturn taking place between 2008 and 2009, while the quarterly figures might more accurately place the downturn in the middle of 2008.
Much of the review is not new; higher levels of education are correlated with lower levels of unemployment; there is a gender gap (women are far more likely to be unemployed) that doesn’t appear to be narrowing, and there is weak evidence of a recovery in the labour market. There are a few interesting trends that are developed in this release, however.
Firstly, the gap between the unemployment rate of black African graduates and other population groups is glaring. In 2011, 3.2% of white job-seekers with tertiary education couldn’t find work (versus 4.1% of Indian graduates and 6.2% of coloured graduates). For black African graduates the rate was 13.0%. If a similar standard of basic education is assumed for all people with tertiary education (and that might be a very big assumption) then serious questions must be asked about the types of tertiary training that black Africans are choosing and the quality of the institutions providing this training. It looks like this is a question for the minister of higher education.
Secondly, the effects of the global economic downturn have been clearly visible in the official figures since 2009, but the review adds much nuance to the broad measures of absorption rates and participation rates. The picture is both intuitive and a bit worrying. The evidence points to greater job losses among small businesses, the informal sector and the self-employed.
For example, an analysis of the employed stratified by their status of employment (employee, employer, self-employed) found that, between 2006 and 2011, annual growth in the number of employees was 1% but the number of employers and the self-employed contracted by 5-6% per annum. Given the trends in job creation through small businesses, we might want to ask whether more could have been done to promote the sustainability of small and new businesses.
Thirdly, there’s a detailed analysis of monthly earnings. The comparison of earnings is done with medians and quartiles, which reveals just how evenly or unevenly earnings are distributed within a group. (Take the hypothetical example of a group of employed women in Polokwane. If the median monthly earnings of this group equal R2,000, it would mean that half of the women in the group earn more than R2,000 a month and half earn less. If the lower quartile is R500, it means that 25% of the group earn less than R500 a month. An upper quartile of R5,000 would mean that 25% of the group earn more than this a month.)
The total group of employed people in 2011 (all 13.1 million of them) had a median monthly income of R3,033. A total of 25% earned less than R1,500 and 25% earned more than R7,890 per month. The overall distribution of earnings is exponential (many earning relatively little and a few top earners earning at a multiple of the median), as is the distribution within the subgroups.
Earnings in only three provinces exceed the national average. Against a national monthly median of R3,000 for all employees, people in Gauteng earned R4,000, those in the Western Cape R3,250…and the median earnings for employees in the North-West was also R3,250. This is partly a result of employment in the mining sector and the relatively higher wages. This is corroborated by the median wage statistics for different sectors. The utilities and social services sectors had the highest median wages at R6,000, but mining was close behind with a median wage of R5,800. Mining is hard and dangerous work, but it is also better paid, on average.
The median wages of unionised employees are also significantly higher than their non-unionised counterparts. Non-unionised workers had a median wage of R2,400 compared with R5,500 for unionised members. Even at the lower quartile measure (R1,300 vs. R2,600 for unionised members) and upper quartile (R5,500 vs. R10,500 for unionised members), union members earned double the amount that non-unionised worked earned.
Fourthly, the growing number of discouraged work-seekers on a national level has been clear trend over the past four years. On a provincial level, the numbers are quite varied. The number of discouraged work-seekers doubled from 1.1 million in 2008 to 2.2 million in 2011. The provinces that were hardest hit by the increase in numbers were KwaZulu-Natal (202,000 to 573,000), Limpopo (165,000 to 419,000) and the Eastern Cape (247,000 to 342,000). The Western Cape, by contrast, saw the number of discouraged workers fall from 34,000 to 33,000 in 2011.
The discouraged are not included in the narrow definition of unemployment, but they are included in the broader definition. Since the media and analysts tend to focus more on the narrow definition, a sharp increase in the number of discouraged work-seekers can obscure the problem of unemployment by presenting (indirectly) an unchanged or even favourable change in the narrow rate of unemployment (this has happened with Limpopo in 2011).
As a percentage of the not economically active (a group including students, housewives and househusbands) the discouraged work-seekers are a full 20% in North-West, Mpumalanga and Limpopo. This suggests that structural unemployment (according to the broad definition of unemployment) is growing in these northern provinces.
In comparison to other SADC countries, South Africa has the lowest rates of participation and absorption in the labour market, and its unemployment rate is exceeded only by Namibia and Lesotho. This is partly due to the much smaller role the agriculture sector plays in South Africa compared to the economies of our neighbours. DM
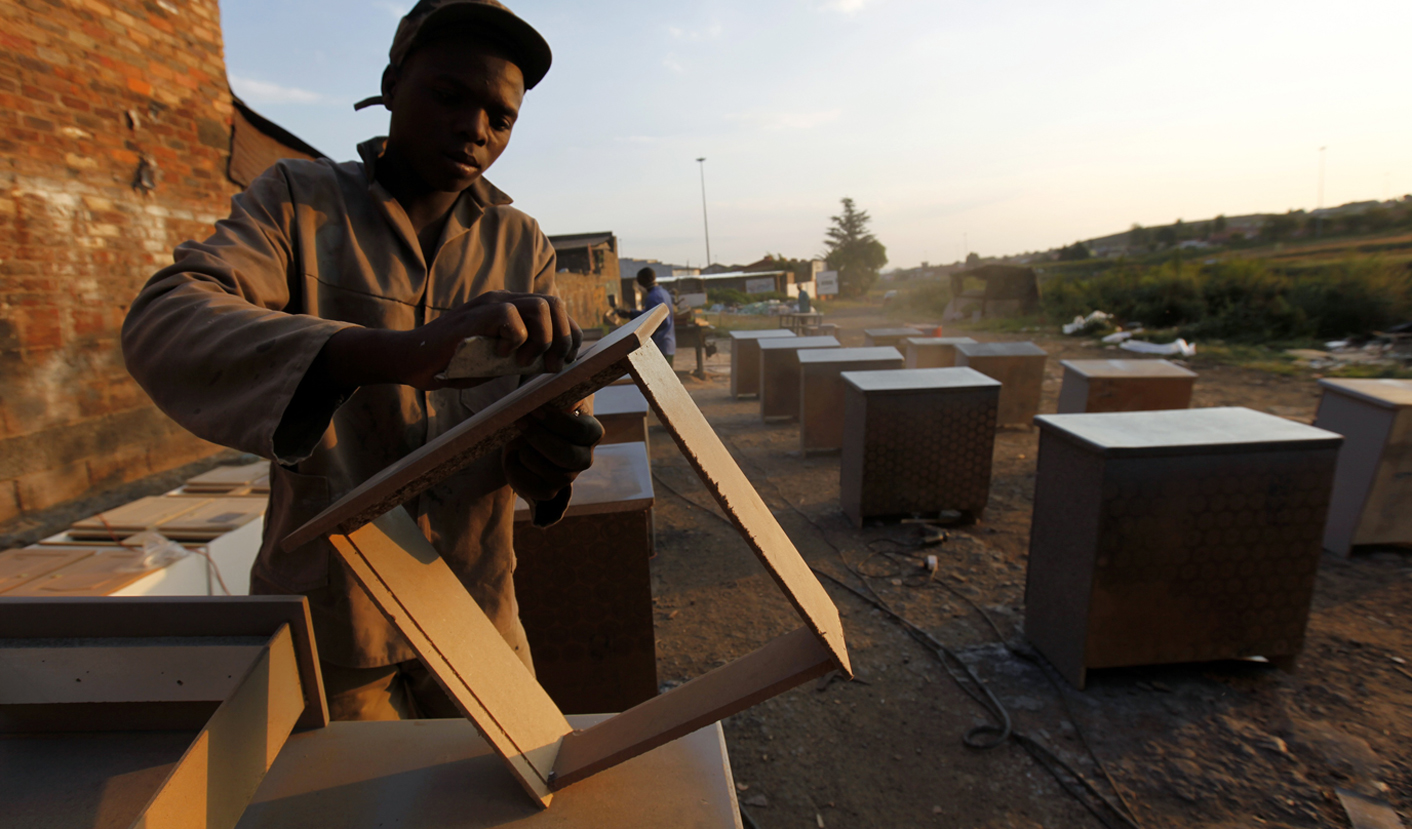
Photo: A carpenter makes cupboards to be sold in Soweto, March 22, 2012.The number of people employed in South Africa's formal sector inched up only 0.3 percent in the fourth quarter of 2011 with the manufacturing sector among the few that added jobs, Statistics South Africa said on Tuesday.Chronic unemployment remains one of the biggest challenges facing Africa's biggest economy, with nearly 24 percent of the labour force reported as jobless in the fourth quarter of last year. REUTERS/Siphiwe Sibeko