


Most of us would agree that poverty is a bad thing, at least in the abstract and general sense of the word. One definition of poverty is ‘the state of being extremely poor, of being inferior in quality or insufficient in amount’. The word connotes a lifetime of drudgery, privation and inertia. It means a lack of opportunity and little to no chance of improving one’s situation.
This last point is an important one. It is being immobile, economically and developmentally, that is the essence of poverty. Poverty means dependence. The poor are stigmatised as a burden; poverty is a disease to be eradicated. Following from this, we can agree that eradicating (or at least reducing) poverty is a worthy goal even if we disagree on what actions should be taken, or who should be blamed for poverty’s persistence.
The link between poverty and unemployment is also clear. The unemployed are dependent on others to support them, and these others include family networks, the kindness of strangers and the intervention of the government. At best, individuals and households without work can get by and lead quiet lives but they can’t hope to improve their lot.
Most of us would agree that gainful employment is the surest way out of poverty. A person with a job can earn, save and plan for the future. We might disagree loudly on whether job-creation is the responsibility of the public or private sector but we agree that jobs are a good thing.
More of us should acknowledge that creating jobs is difficult most of the time. Creating jobs that offer personal development and/or economic mobility is particularly hard.
What of inequality, the most controversial member of the Axis of Social Ills? Most of us feel that an unequal society is less healthy or desirable than an equal society. Our definitions of ‘unequal’ are even more divergent that our definitions of ‘poverty’ or ‘decent jobs’.
Some of us feel that inequality is the natural state of affairs, others that it has been socially engineered to a large extent. This newspaper has written previously on whether an antipathy to inequality may have any evolutionary roots, where the survival of smaller, pre-modern communities depended on sharing, co-operation and support for the less able.
Whatever the reason, most people would oppose inequality and poverty in the same breath. For those who believe that inequality and poverty are both socially engineered, there’s a strong link. But there is an important difference between the two that is usually overlooked: poverty is mostly perceived as an absolute state while inequality is, by definition, a relative measure.
To define poverty as an absolute state is to declare that there is a dividing line between those that can develop and those that cannot. It is to calculate, in one’s head or through a bureaucratic process, the minimum that a person or household needs to develop economically, socially and personally.
This minimum is typically defined in terms of a number of goods and services. They generally include (in ascending order of importance) nutrition and sustenance, basic services, healthcare, education and other social services.
Official definitions normally include the monetary value of these services. The jargon refers to the ‘poverty line(s)’ for households and individuals, measured in rands per month. The definitions are not without controversy. For example, how should subsistence farming and other household activities be valued? Does the money spent on public education, basic services and healthcare have any relationship with the value delivered to the beneficiaries?
Inequality, on the other hand, talks about the differences between members of a society. A society might be filled with well-lit homes sporting twin garages but the billionaires will still be wealthier than the millionaires by several orders of magnitude.
That’s a bit of trite example. The real world contains millions of people who are trapped in poverty. Human nature being what it is though, most of us will always compare ourselves to those who are richer and we will be left feeling like the poorer cousins.
South Africa is frequently held up as one of the most unequal societies in the world, if not the most unequal of them all. The country’s Gini coefficient is normally used to bolster this argument. The value of the coefficient ranges from 0.60 to 0.70 depending on the year and exact measure of income, consistently placing it in the five most unequal countries.
What is the Gini coefficient? Most people know that it’s some measure of inequality – beyond that they’re hazy on the details. A common answer is that the Gini coefficient measures ‘the gap between the rich and the poor’. It doesn’t, and the fabled ‘gap’ is, once again, a matter of personal interpretation and belief.
The derivation of the Gini coefficient is technical. It essentially quantifies the degree to which income distribution in a society deviates from a hypothetical society of perfect equality. The value of the Gini coefficient can range from 0 to 1, although in practice it ranges from 0.25 to 0.7.
The most strenuous opposition to inequality comes from the ranks of organised labour. Often the same people will use South Africa’s Gini coefficient to motivate for a more equitable distribution of salaries and income. There is an implicit assumption is this argument, which is that inequality can be reduced by a redistribution of income. The corollary of this assumption is that employment numbers and unemployment levels have a smaller effect on inequality, that the link between unemployment and inequality is not that strong.
The point of this article is not to convince you that inequality is a larger or smaller problem than you thought it was. Rather it is to look more closely at the Gini coefficient and its weaknesses¸ to show that measures of inequality are not clear and unambiguous, and that the link between unemployment and the Gini coefficient may be quite strong in the South African context.
Much of the evidence presented is circumstantial and you may remain unconvinced by the end. There is enough evidence to suggest that we have not been able to redistribute our way to equality and that reducing unemployment may be our best chance at reducing inequality.
Recent statistics compiled by the DPME show that the Gini coefficients for income are lowest in Gauteng and the Western Cape, and highest in the North-West and the Eastern Cape. The growth in the Gini coefficients in the latter two provinces has been high in recent years – in 2010 it was 0.73 in the North-West and 0.70 in the Eastern Cape.
Gauteng and the Western Cape also have the lowest rates of unemployment while the North-West and the Eastern Cape have the highest, according to the latest quarterly labour force survey. The rate referred to here is the broad rate of unemployment and this is an important point to note. It includes those who aren’t actively looking for work. In terms of our analysis of poverty, a person relying on grants who is looking for work is not very different from another person who has given up looking for a job and is also reliant on grants.
The link between income inequality and being without work has been made, however tenuous it might be. We can bolster the link by asking another question: how has the income of the unemployed grown, compared to the income of the employed?
For the unemployed group the answer is clear. The growth in the value of social grants has been below the inflation rate for the past few years and is forecast to grow at 3%-5% over the medium term, well below the expected rate of inflation. For the poorest households, their share of total income has been falling and will continue to fall.
What has happened to the income of the employed? That question is harder to answer. We can look at other data sources and make some broad assumptions. For example, average nominal monthly earnings were R9,600 in the first quarter of 2010, across the informal sector. This had risen to R14,000 in the first quarter of 2013. This is a cumulative increase of 45% in three years, or 13.3% annual growth.
For the mining sector (formal employment) average monthly earnings grew from R10,300 to R15,600 over the same period. This is a cumulative increase of 51% in three years, or 14.6% per year. Earnings in the sector grew faster than overall earnings growth across formal employment and they were higher to begin with.
Put another way, the average miner in formal employment earned 7.6% more than the average worker in formal employment at the start of 2010. Three years later the same miner’s earnings were 11.4% higher than the average.
What might happen in the North-West, where tens of thousands of people are employed in the platinum sector, earning well above the median formal wage, and the labour absorption rate for the province is 36%? Total gross earnings across the mining sector rose from R15.6 billion in 2010 to R24.4 billion in 2013, an increase of some 56%. Top management in the sector is responsible for less than 5% of this total figure, so that can’t be the driver of this growth.
None of these numbers say anything about the fairness of wages in the sector or whether the sector’s structure is ultimate sustainable, with its labour-intensiveness and migratory patterns. The numbers do suggest that recent developments in wage settlements and the ongoing structure of unemployment in the North-West have led to a significantly higher Gini coefficient in the province. How the traditional evangelists of the Gini numbers will respond to this will be interesting.
More research needs to be done to link the various dots, and a stronger case needs to be made to support the hypothesis that high wage growth by lower-to-middle-income workers coupled with high unemployment is driving the Gini coefficient higher. It’s not the difference between top earners and the rest of the employed that’s doing it, otherwise the Western Cape and Gauteng, with most of the country’s millionaires, should have the higher coefficients.
If we’re going to keep using the Gini coefficients as the only proxy of inequality then we can maybe accept the idea, counterintuitive to some, that the creation of entry-level jobs could lower both unemployment and inequality. To those that value ‘decent work’ above all else this might sound like apostasy. The alternative is to drop the Gini coefficient as the arbiter of inequality and choose a new metric. Either way, some long-held beliefs may have to be modified. DM
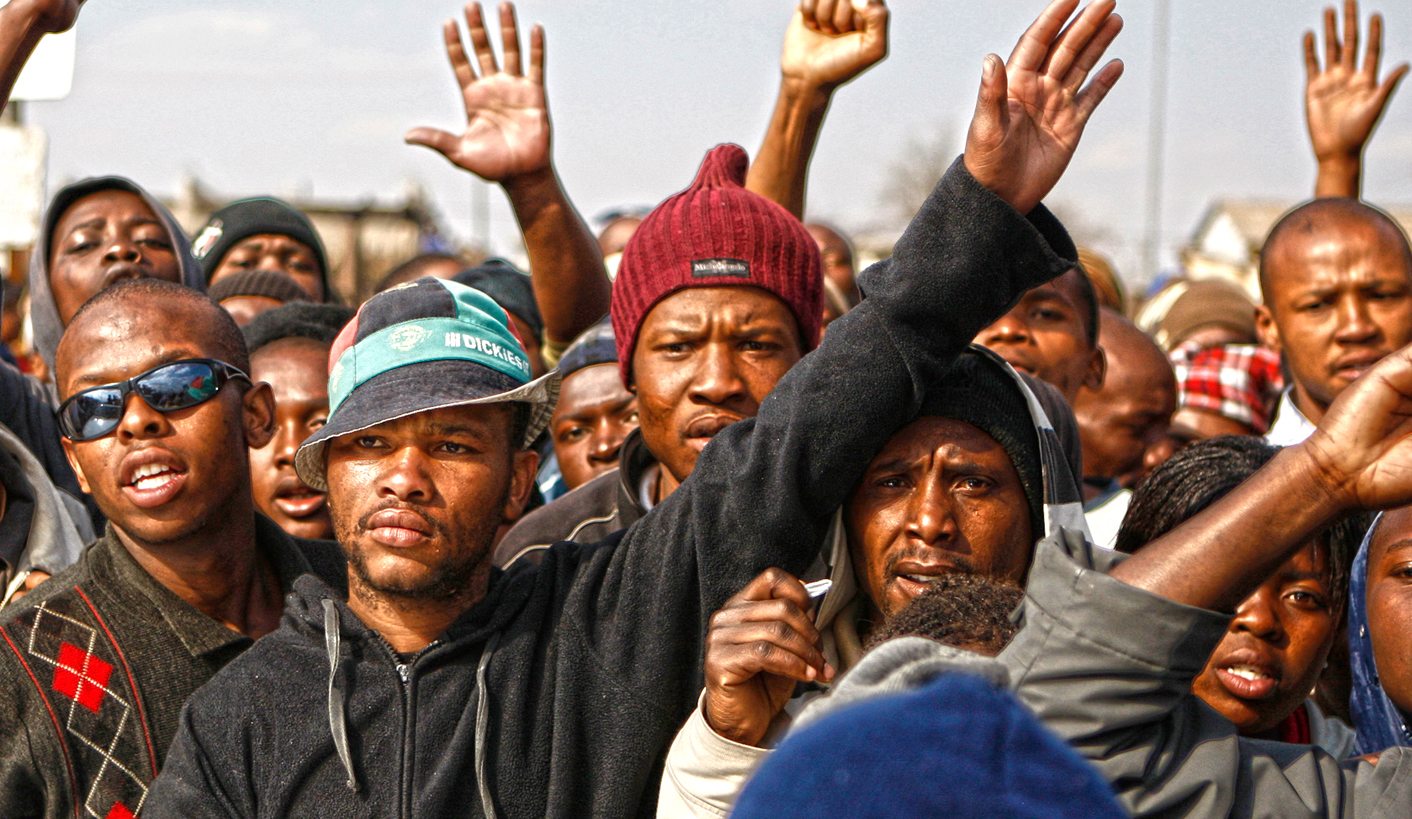
Photo: Protesters chant slogans in Siyathemba township outside Balfour July 22, 2009. Protesters hurled stones at police, who responded with teargas and rubber bullets, after thousands marched through the streets on Wednesday over poor services and unemployment. REUTERS/Siphiwe Sibeko.