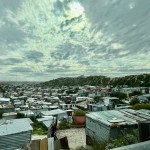
South Africa
Analysis: Mid-year population estimates point to Census 2011 problems
On Tuesday, Statistics South Africa (StatsSA) released its 2013 mid-year population estimates. This release is normally uncontroversial, but this year’s numbers clash quite glaringly with the 2011 census results. By PAUL BERKOWITZ.
The 2013 mid-year population estimates spoke to some interesting trends in South African demographics. According to the publication, the country’s population is just under 53 million people, almost one in four people now live in Gauteng and the country is winning the war against HIV. All of these trends, however, are overshadowed by the discrepancies between the latest estimates and the most recent census.
Before tackling the controversy, it’s interesting to look at the abovementioned trends – assuming, of course, that these aren’t compromised by the mismatch between the different sets of numbers.
The growth of Gauteng’s share of the population continues. The province now houses 24% of the population, while KwaZulu-Natal now has less than 20% of the country’s inhabitants. The Western Cape, at 11.4% of the population, appears to be catching up to the Eastern Cape (12.5%) and may even overtake the latter in the years to come. There are also more coloured people now than white people in South Africa – 4.8 million versus 4.6 million.
With respect to the HIV-positive section of the population, the trends are broadly positive. The prevalence (the percentage of the population with the virus) continues to increase, but the incidence rate (percentage of the non-infected population that contracts the disease in a year) has been falling since 2005. Even better, while the prevalence rate of the 15-49 age group continues to rise, the rate among the 15-24 group has been steadily falling for over a decade.
Unfortunately, the controversy surrounding the 2011 census numbers has flared up again with this latest release.
When the census numbers were released, it was claimed by some sources, notably the two professors of demography at UCT, contracted as independent consultants, that the trends in the census numbers were not in concord with the trends in earlier censuses and the annual mid-year population estimates.
Two professors released a statement on Tuesday afternoon reiterating their earlier concerns about the differing age distributions of the 2011 census and the latest estimates. To quote from the statement directly: “The mid-year estimates released today portray a version of the age structure of the South African population that is quite different from that of the census. The two versions cannot both be correct”.
The professors constructed a graph to demonstrate the extent of the differences between the estimates. The Daily Maverick reproduces the graph below:
The blue line shows the distribution of the different age cohorts from the 2011 census, and the green line shows these figures projected two years forward to 2013. The green line should be compared with the red line, showing the 2013 mid-year estimates.
If the trends in the census and the latest population estimates were the same, the green and red lines should be very close together, but they’re not. The 0-5 age cohort is about 5% lower for the mid-year estimate than for the projected census numbers, while the 10-14 age cohort is about 12% larger in the mid-year estimate.
This obviously has serious implications for spending on public education and health, to name just two areas. The professors end their statement with an appeal to StatsSA to “indicate as soon as possible which set of numbers is the more reliable, so as to ensure that national, provincial and local policies and planning are based on as reliable and consistent estimates as possible.”
While no-one is directly disputing the broad trends in the latest release, the value of StatsSA’s demographic data is still under a large cloud. The organisation needs to address the legitimate concerns of the analyst community, because these concerns spill over into pretty much everyone else’s lives: policy-makers, academics, forecasters and (of course) the rest of us in the country who are affected by public spending and planning.
Until StatsSA can conclusively and satisfactorily address all these outstanding issues, the value of their data will unfortunately remain debased. Until this happens, the ‘hatched, matched and dispatched’ data releases will be botched, blotched and far-fetched in the eyes of the public. DM
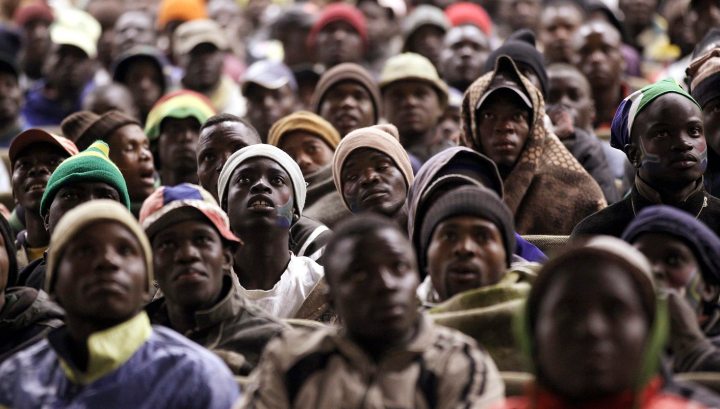
Photo: Homeless people, who are guests at the Moreleta Dutch Reformed church, watch the 2010 World Cup Group A Soccer match between South Africa and Uruguay at the church in the suburb of Pretoria June 16, 2010. REUTERS/Stefano Rellandini