


A product of the Social Media Research Foundation, NodeXL is a project that essentially grew out of Microsoft research. Largely financed by Microsoft, NodeXL is making the science of social networking much more accessible. Network theory is an established subject taught almost exclusively to the likes of engineers, mathematicians and computer science students. The rise and rise of social networks made network theory sexier and, thanks to NodeXL, social theory is catching on in liberal arts colleges as well as in political science classes, and among those studying economics, sociology, anthropology and education.
NodeXL is intended to be a panacea for the huge problem the connected world introduced: We are simply drowning in data, especially in social networks where everyone’s a publisher and each email, Facebook “like” and Twitter tweet leaves a footprint of our relationships with others. This creates a vast and easily accessible repository of data for understanding social behaviour on these networks. The problem with data is that it is data. Raw data looks like tables of metrics and takes a calculated mindset to decode and extract meaning.
A social scientist schooled at Cambridge and UCLA, Marc Smith’s always loved computers and interconnections, but never had an appetite for hardcore data or statistics. “I was one of the very first owners of what I’d call paleotechnology, a Radio Shack Tandy TRS-80.” Sold in the late seventies and early eighties, the TRS-80 was one of the world’s first home computers. “I soon found out that I was not destined to be a programmer, but rather someone who works with others to cause code to come into being.
"I would love to say I was numerate and did maths a lot better, but I can’t. I am not very quantitative and I suspect a lot of people are like me. If I want to do science and gain insight, I need to draw a picture,” says Smith. “Visualisations are an entry point for the non-numerate to come and do science, to gain insight. Why do newspapers print a chart instead of a table of numbers? The answer is that your eyes can think for you in ways that your brain cannot.”
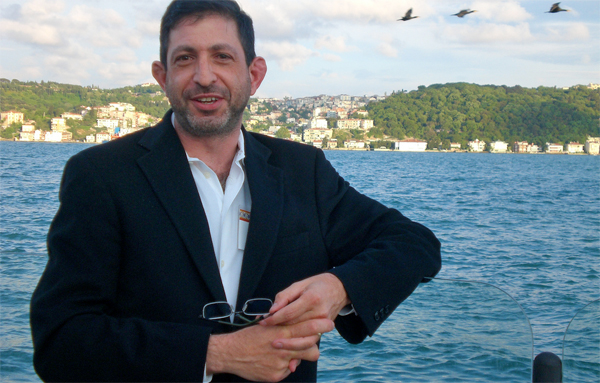
Photo: NodeXL's Marc Smith.
Almost every Wednesday for the past three years Smith has joined leading thinkers in the fields of sociology, computer science and visualisation to work on what they think is an important tool for analysing and visualising social networks. The likes of Ben Schneiderman and Jure Leskovec are also involved. Schneiderman is the founder of the Human Computer Interaction Laboratory at the University of Maryland, while Leskovec is assistant professor of Computer Science at Stanford. The team also includes top scientists from Oxford, Cambridge, Cornell and the University of Porto.
Human beings swim in a world of networks, yet if you look at the computers so many of us use there’s no place for social data structures. "We put our words in Word, tables of numbers in Excel, visualisations and pictures in PowerPoint. However, if you have information about your connections to other people in social networks, there’s no place for this to go,” says Smith. Three years of Wednesdays with Smith and company have changed that with the invention of a nifty tool called NodeXL. Built using open source, NodeXL integrates with Excel, is free to download and creates easy-to-intuit visualisations of complex data structures extracted from social networks.
"There is information in the shapes of peoples’ collections of connections and this is a data structure that is everywhere, yet we are blind to it. NodeXL enables people to capture this data, visualise it, discuss it, analyse it, present it and show it to other people,” says Smith. What’s interesting about NodeXL is that it is simple and easy to use, yet at the heart of the code is an algorithm with deep maths that determines how social structures be given a visual identity. This enables the creation of reliable visualisations of complex data sets, rather than some strange, obscure picture of “lies, damned lies and statistics”.
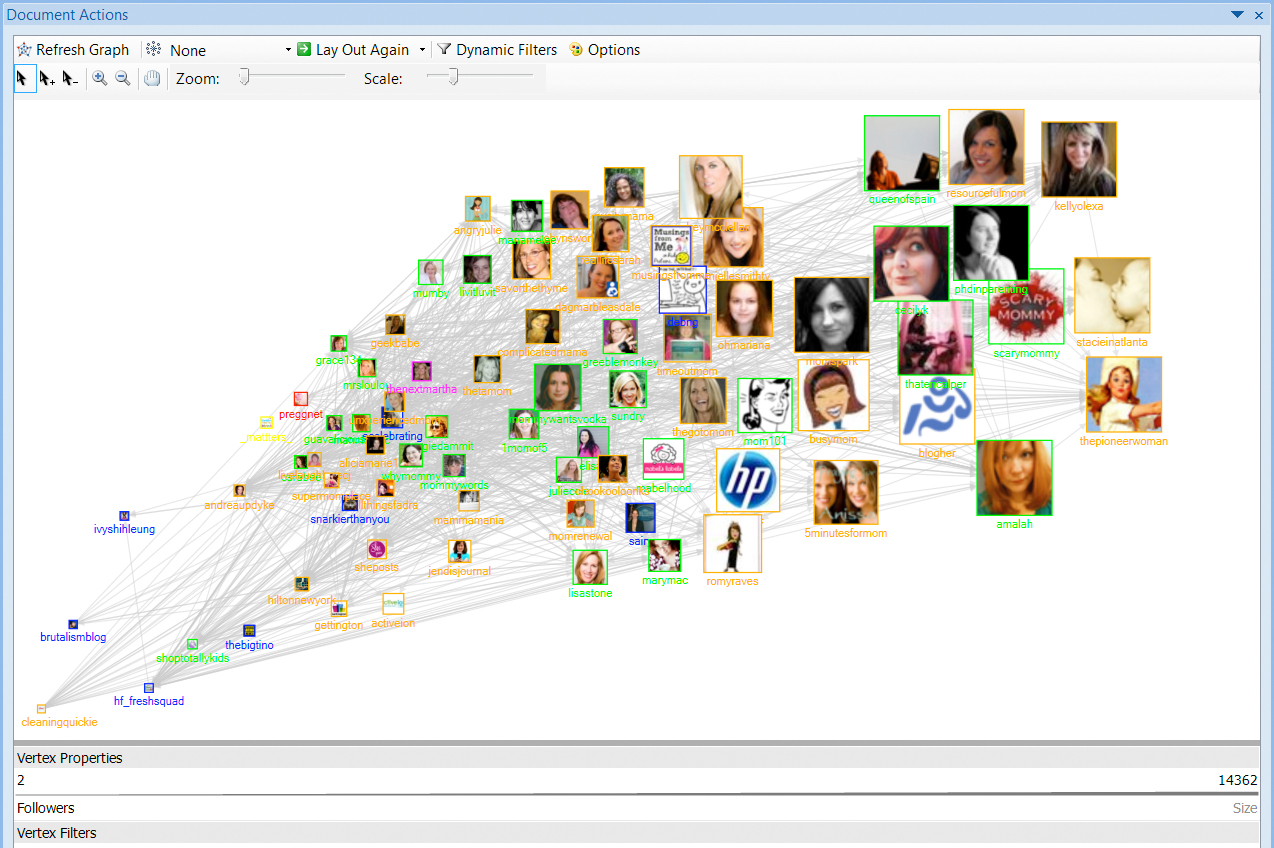
NodeXL would certainly be of interest to the likes of the ANC, DA and other political parties that want to understand how to lobby groups in social networks or know how to influence people who have the most sway in digital networks. Take a look at one of Smith’s visualisations. Each dot is a person in a social network, and each line is a connection. The shape of the collective is determined by the choices made by the individuals in the cluster. For a visualisation of a Twitter cluster the shape is influenced by those who “retweet” information and the clout they carry in the crowd. By analysing the visualisations it becomes obvious which people are influential, who has the most connections and how groups interact.
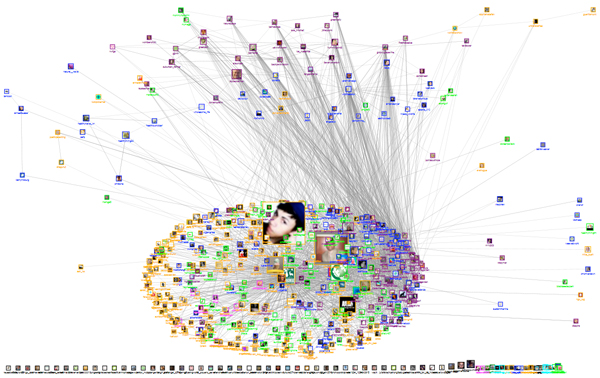
To explain how NodeXL works, Smith explores a chart created for the National Wildlife Federation (NWF), which tracks mentions of the phrase “NWF” for a 24-hour period on Twitter. “The NWF is a politically motivated organisation that intends to support legislation and policy that it believes has a positive environmental agenda. Like a lot of other groups in cyberspace, the NWF is trying to shape public opinion, but needs to better understand what its crowd looks like before it can do this,” says Smith. Looking at the graph it’s easy to see which shapes are bigger than others, which people have more followers and who is influential. One can discern hubs of influence above the primary hub, and to the left of the graph the less influential clusters. “The three most important aspects of social network analysis are position, position and position. Not every position is the same in the graph, and where people are located determines power and influence.
NodeXL is used by the NWF to discover how effective it is with lobbying in social networks, and to understand what its ideological competitors look like,” says Smith. “Using NodeXL organisations can figure out how to cultivate relationships with important people who are the gateways or gatekeepers to marketplaces or important social spaces.”
To use the open-source tool, you simply need to download it, run the executable file and open an Excel look-alike program with windows and columns that contain several worksheets. The program will prompt you to input parameters for your research and Smith says pretty much anyone who’s ever made a pie chart will be able to import data and construct a diagram.
The data is imported from social network sources. The tool talks to these networks on your behalf and the process is very well guided. You’ll be asked a series of questions about the words or subjects you’re interested in and what people you want to track,” says Smith. The data is then presented in an Excel-like framework and visualised, yet retains the functionality of a spreadsheet. This means the data and visualisation can be explored, analysed and manipulated.
Watch Marc Smith talking on NodeXL and mapping social networking analysis:
The social media tracking tool won’t only be used for public domain analysis. Smith anticipates it will be used in organisations to determine areas of influence. Within companies, NodeXL can be used to show who the opinion formers within a business are, who the lobbyists are, who has power and who has none.
Smith says it is likely the research obtained inside enterprises will be richer than those gleaned on the outside. “At Microsoft it was routine for people who didn’t know each other to meet. During meetings these people would flip open their laptops and interrogate the command chain of the person sitting opposite them to get a sense of where this person was placed in the organisation. At Microsoft we referred to this process as ‘walking to Bill’.”
Bill of course is former head of Microsoft, Bill Gates. In a company that Smith says contains some 89,000 employees in 216 buildings across 60 countries, Gates was often the only one common “ancestor” between two employees. “When you’re in Redmond and someone says ‘Hi, I work for Microsoft’ they may as well be saying: ‘Hi, I breathe oxygen’, because it is such a point of commonality.”
Smith says NodeXL can complement organisational charts by reporting on the real patterns of power through tracking in-company communications. “You go to the server and see who is emailing who, and here I insert a parenthetical note that this must be done with appropriate privacy connections in place. By doing this NodeXL sees who is talking to one another, who isn’t talking, together with all the patterns of connection, disconnection, bottlenecks and hubs. The invisible becomes visible in much the same way that an organisational chart seeks to plot official structures.
There is a beauty in the discovery of the structure of any data. We now swim in a world of data and more machine-readable data is generated every day than we will be able to consume in our lifetimes. The phrase I like to use is that the machines have gotten us into this problem and they are just going to have to get us out of it.”
Which begs the question: Who will be using the machines to build a better mouse trap and who will be manipulated in the effort to get the world to beat a path to some brand or organisation’s door? DM
Read more: “Now Playing: Night of the Living Tech” in the New York Times, “Deciphering the social media genome” by Sorin A. Matei, Associate Professor of Communication, at Purdue University, and “Tools for mapping social media networks” by Dr Marc Smith. Go to NodeXL.